Buckingham Pavilion Nursing and Rehabilitation
Nursing Home, Assisted Living, Memory Care, Skilled Nursing & Nursing Care · Chicago, IL
CMS overall rating Info CMS (the Centers for Medicare & Medicaid Services) is the federal agency that rates nursing home quality. Its Overall Rating runs from 1 to 5 stars, combining health inspections, staffing, and quality measures, with inspections weighted most heavily.

Buckingham Pavilion Nursing and Rehabilitation

Nursing Home, Assisted Living, Memory Care, Skilled Nursing & Nursing Care · Chicago, IL
CMS overall rating Info CMS (the Centers for Medicare & Medicaid Services) is the federal agency that rates nursing home quality. Its Overall Rating runs from 1 to 5 stars, combining health inspections, staffing, and quality measures, with inspections weighted most heavily.
Calculator: See prices in your area
Buckingham Pavilion Nursing and Rehabilitation accepts Medicare, Medicaid, and private pay.

Overview of Buckingham Pavilion Nursing and Rehabilitation

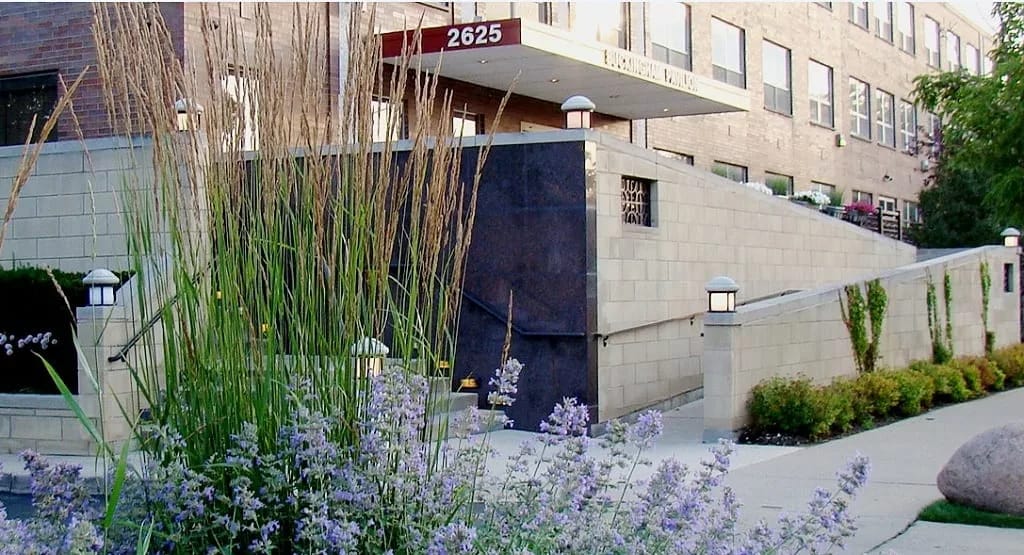
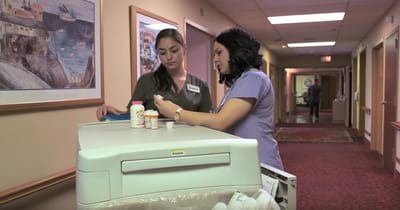
Find all the care you need with the extraordinary senior living community of Buckingham Pavilion situated in the charming residential area of West Touhy Avenue, Chicago, IL, that offers assisted living, memory care, skilled nursing, rehabilitation, transitional care, Parkinson’s care, and long-term care. With pet-friendly and fully furnished accommodations, seniors have a peaceful and convenient retirement. A team of compassionate and well-trained professionals delivers top-notch care and assistance around the clock to ensure seniors thrive and live to their potential.

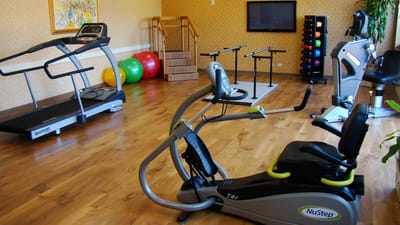
Discover new hobbies and relive old interests with a well-thought-of calendar of exciting events and enjoyable programs. Delight in healthy and delicious meals that satisfy cravings and dietary needs. Buckingham Pavilion features extensive amenities including a library, a movie theater, an ice cream parlor, a beauty parlor, an arts and crafts studio, and a health club, ensuring seniors have more opportunities to enjoy every moment of their golden years.

Quality ratings

Measured by Centers for Medicare & Medicaid Services (CMS)

Overall rating Info The Overall CMS Rating combines results from health inspections, staffing levels and quality measures. Health inspections carry the most weight. Staffing and quality scores can increase or decrease the final rating based on performance compared to state and national standards.
▼ 4.8% Below IL avg. ▼ 4.8% Below IL avg.Click the badge to see the full State ranking.Click here to see the full State ranking.
Health Inspection Info Based on the results of the facility's three most recent standard inspections and any complaint investigations. CMS reviews the number, scope, and severity of deficiencies, with more recent findings weighted more heavily.
▲ 31.6% Above IL avg. ▲ 31.6% Above IL avg.Click the badge to see the full State ranking.Click here to see the full State ranking.
Staffing Info Measures average nursing staff hours per resident per day, including Registered Nurses (RNs) and total nursing staff. Ratings are adjusted based on the level of care residents require and are compared to state and national benchmarks.
▼ 70.0% Below IL avg. ▼ 70.0% Below IL avg.Click the badge to see the full State ranking.Click here to see the full State ranking.
Quality Measures Info Based on clinical and physical health indicators reported to CMS, such as hospital readmissions, falls, pressure ulcers, and improvements in mobility. These measures reflect how well residents' health needs are being managed.
▼ 6.0% Below IL avg. ▼ 6.0% Below IL avg.Click the badge to see the full State ranking.Click here to see the full State ranking.

Staffing hours breakdown

Info Daily nursing hours per resident by staff type, reported to CMS. Higher is generally better — compare this facility to state and national averages to see where staffing stands.

Hours per resident per day — compared to Illinois state averages

Total nursing care / resident Info This home is ranked 110th out of 167 homes in Illinois for nurse hours. Total adjusted nursing hours per resident per day, combining RN, LPN, and aide time. CMS adjusts this for case-mix so facilities can be fairly compared.
2h 35m per day
Rank #110 / 167Nurse hours — State benchmarkedThis home is ranked 110th out of 167 homes in Illinois. Shows adjusted nurse hours per resident per day benchmarked to the Illinois average, with a ranking across 167 Illinois facilities. More hours mean more direct care. The national average is about 3.5 hrs; below 3.0 is a red flag.Click the rank badge to see the full State ranking.Click here to see the full State ranking.
This facility Illinois avg (3h 57m per day)
vs Illinois avg
-35%

5 of 6 metrics below state avg

Standout metric Physical Therapist is +13% above state avg
Staff typeHours / Day / Residentvs state avg
Registered Nurse (RN) Info RNs hold the highest nursing license and can assess residents, interpret test results, and direct care plans. More RN hours per day often signals stronger clinical oversight and faster response to health changes. 37m per day ▼ 17% State avg: 44m per day · National avg: 41m per day
LPN / LVN Info Licensed Practical Nurses (LPNs) or Licensed Vocational Nurses (LVNs) deliver routine hands-on care — medication administration, wound dressing, and monitoring vital signs. They work under RN supervision and make up a large share of daily bedside care. 21m per day ▼ 44% State avg: 38m per day · National avg: 52m per day
Nurse Aide Info Certified Nurse Aides (CNAs) provide the most direct day-to-day assistance: bathing, dressing, feeding, and mobility. Nurse aide hours are typically the largest staffing category and directly affect residents' quality of life. 1h 46m per day ▼ 17% State avg: 2h 8m per day · National avg: 2h 21m per day
Weekend Total Nursing Info Combined nursing hours (RN + LPN + Nurse Aide) per resident per day on weekends. Staffing often drops on weekends — this figure reveals whether the facility maintains adequate coverage outside of weekday hours. 2h 35m per day ▼ 16% State avg: 3h 5m per day · National avg: 3h 26m per day
Physical Therapist Info Hours per resident per day provided by licensed Physical Therapists (PTs) or PT Assistants. PT services help residents recover mobility after injury or illness and are especially important for post-acute (short-stay) rehabilitation. 3m per day ▲ 13% State avg: 3m per day · National avg: 4m per day
Weekend RN Info Registered nurse hours specifically on weekends. Facilities sometimes reduce RN presence on Saturdays and Sundays — a low weekend RN figure compared to weekday hours can indicate reduced clinical oversight when most administrative staff are absent. 26m per day ▼ 25% State avg: 34m per day · National avg: 29m per day

Capacity and availability

This home usually has availability

Lower occupancy than the Illinois average: 69.3%
Occupancy rate
35.1% Rank #184 / 199Occupancy rate — State benchmarkedThis home is ranked 184th out of 199 homes in Illinois. Shows this facility's occupancy rate versus the Illinois average, with its Statewide rank out of 199. Higher occupancy signals strong local demand and financial stability.Click the rank badge to see the full State ranking.Click here to see the full State ranking.
Avg. Length of Stay
212 days
Years in operation
42 years in operation Rank #12 / 145Years in operation — State benchmarkedThis home is ranked 12th out of 145 homes in Illinois. Shows how long this facility has been in operation compared to other Illinois facilities. Longer operating histories may benefit residents, families, and staff.Click the rank badge to see the full State ranking.Click here to see the full State ranking.
A longer operating history, which may indicate experience navigating regulations and delivering ongoing care.
Walk Score
Walk Score: 83 / 100 Rank #88 / 648Walk Score — State benchmarkedThis home is ranked 88th out of 648 homes in Illinois. Shows how walkable this facility's neighborhood is compared to the average Walk Score across Illinois facilities. Higher scores benefit residents, families, and staff.Click the rank badge to see the full State ranking.Click here to see the full State ranking.
Very walkable. Most errands can be accomplished on foot, and many essentials are within a short walk.

About this community

License Details

AccreditationsBest Nursing Homes in America by U.S. NEWS & WORLD REPORT

Ownership & Operating Entity

Profit StatusFor-Profit

Staffing

Key information about the people who lead and staff this community.

Leadership

ContactMr. Eric Stern, Administrator

Therapy & Rehabilitation

1 service
Rehabilitation Services

Staffing & Medical

1 service
24-Hour Staffing

Memory & Specialized Care

1 service
No Alzheimer's certification

Additional Services

3 services
Assisted Living Plus
Rehabilitation & Transitional Care
Parkinson’s Care

Amenities & Lifestyle

24/7 Care & Supervision
Nutritious Meals And Snacks
Relaxing Environment
Housekeeping

Dining & Nutrition

Food DescriptionNutritious Meals and Snacks

Contact Buckingham Pavilion Nursing and Rehabilitation

Inspection History

In Illinois, the Department of Public Health, Office of Health Care Regulation conducts annual unannounced surveys to assess compliance with state and federal healthcare facility standards.

Since 2023 · 3 years of data 28 deficiencies 3 inspections

Inspection Scorecard Info This scorecard compares key inspection, citation, and complaint metrics at this facility against the Illinois state average. Metrics rated ≥15% worse than average are highlighted in red; those ≥15% better are highlighted in green.

Since 2023 vs. Illinois state average
Overall vs. IL average 3 Worse Metrics worse than Illinois average:
• Total deficiencies (300% above)
• Deficiencies per year (304% above)
• Deficiencies per inspection (933% above)
1 Better Metrics better than Illinois average:
• Total inspections (63% below)
Latest Inspection November 15, 2024 Routine

Deficiencies Info Deficiencies are formal regulatory issues recorded during state inspections.

This FacilityIL Averagevs. IL Avg
Total deficiencies Info Formal regulatory issues recorded by inspectors across all inspection types. 287 This facility has 300% more total deficiencies than a typical Illinois nursing home (28 vs. IL avg 7).↑ 300% worse
Deficiencies per year Info Average deficiencies per year since 2023. 9.32.3 This facility has 304% more deficiencies per year than a typical Illinois nursing home (9.3 vs. IL avg 2.3).↑ 304% worse
Deficiencies per inspection Info Average deficiencies per inspection. 9.30.9 This facility has 933% more deficiencies per inspection than a typical Illinois nursing home (9.3 vs. IL avg 0.9).↑ 933% worse

Inspections Info State inspections evaluate whether the facility meets health and safety standards.

This FacilityIL Averagevs. IL Avg
Total inspections Info Combined count of all routine and focused inspections. Excludes complaint investigations. 38 This facility has 63% fewer total inspections than a typical Illinois nursing home (3 vs. IL avg 8).↓ 63% better

Health Inspection History

Inspections since 2023
Total health inspections 3

Illinois average 10.4


Last Health inspection on Nov 2024

Total health citations
29 Rank #73 / 167Health citations — State benchmarkedThis home is ranked 73rd out of 167 homes in Illinois. Shows this facility's total health deficiency citations benchmarked to the Illinois State average, with a ranking across all 167 IL facilities. Lower citation counts earn a better rank.Click the rank badge to see the full State ranking.Click here to see the full State ranking.

Illinois average 36.8

Citations per inspection
9.67 Rank #167 / 167Citations per inspection — State benchmarkedThis home is ranked 167th out of 167 homes in Illinois. Shows average deficiency citations per CMS inspection for this facility versus the Illinois mean across 167 facilities with citation data. Lower is better.Click the rank badge to see the full State ranking.Click here to see the full State ranking.

Illinois average 3.68


Health citations are formal notices following inspections when they fail to comply with safety and care standards.

All 29 citations resulted from standard inspections.

Breakdown of citation severity (last 3 years)
Critical health citations
0
100% better than Illinois average

Illinois average: 0.7


Serious health citations
0
100% better than Illinois average

Illinois average: 3.6

0 critical citations Illinois average: 0.7

0 serious citations Illinois average: 3.6

28 moderate citations Illinois average: 32

1 minor citation Illinois average: 0.5
Citations history (last 3 years)
Infection Control moderate citation Nov 15, 2024
Corrected

Quality of Care moderate citation Nov 15, 2024
Corrected

Quality of Care moderate citation Nov 15, 2024
Corrected

Quality of Care moderate citation Nov 15, 2024
Corrected

Staffing Data

Reporting period: October 1 – December 31, 2025 (Q4 2025). Source: CMS Payroll-Based Journal report.

Total staff 132
Employees 125
Contractors 7
Staff to resident ratio 1.29 : 1
28% fewer staff per resident than Illinois average
Illinois average ratio: 1.80 : 1 Illinois average ratio: 1.80 : 1See full Illinois ranking
Avg staff/day 59
Average shift 7.1 hours
7% worse than Illinois average
Illinois average: 7.6 hours Illinois average shift: 7.6 hoursSee full Illinois ranking
Total staff hours (quarter) 38,793

Nursing staff breakdown

Q4 2025 · Oct 1 – Dec 31 More info This data comes from the CMS Payroll-Based Journal report covering October 1 – December 31, 2025.
Registered Nurse

Manages medical care and health needs.

RN Staff Info 20 total: 19 full-time employees and 1 contractor. 20
Average shift length Info Average shift length. Calculated as total hours divided by days worked and average staff per day. 7.3 hours
Licensed Practical Nurse

Assists with medical care and medications.

LPN Staff Info 18 total: 14 full-time employees and 4 contractors. 18
Average shift length Info Average shift length. Calculated as total hours divided by days worked and average staff per day. 7.6 hours
Certified Nursing Assistant

Helps with daily care and mobility.

CNA Staff Info All 66 CNA Staff are full-time employees. No contractors work on this role. 66
Average shift length Info Average shift length. Calculated as total hours divided by days worked and average staff per day. 7.1 hours

Contractor staffing

Q4 2025 · Oct 1 – Dec 31 More info This data comes from the CMS Payroll-Based Journal report covering October 1 – December 31, 2025.

Total hours from contractors

4.6%

1,797 contractor hours this quarter

Licensed Practical Nurse: 4 Registered Nurse: 1 Respiratory Therapy Technician: 1 Speech Language Pathologist: 1

Staff by category

Q4 2025 · Oct 1 – Dec 31 More info This data comes from the CMS Payroll-Based Journal report covering October 1 – December 31, 2025.
Certified Nursing Assistant6606618,77392100%7.1
Registered Nurse191205,78792100%7.3
Physical Therapist100105,31792100%7.8
Licensed Practical Nurse144183,75192100%7.6
Administrator2021,1867986%7.5
Speech Language Pathologist0116388592%7.5
Respiratory Therapy Technician0116037076%8.6
Other Dietary Services Staff3035777177%5.8
Physical Therapy Assistant4045517885%4.6
Nurse Practitioner1015117683%6.7
Mental Health Service Worker1014996267%8
Occupational Therapy Aide1012515964%4.3
Clinical Nurse Specialist2021976773%2.6
Physical Therapy Aide1011031314%7.9
Qualified Social Worker101502628%1.9
66 Certified Nursing Assistant
% of Days 100%
20 Registered Nurse
% of Days 100%
10 Physical Therapist
% of Days 100%
18 Licensed Practical Nurse
% of Days 100%
2 Administrator
% of Days 86%
1 Speech Language Pathologist
% of Days 92%
1 Respiratory Therapy Technician
% of Days 76%
3 Other Dietary Services Staff
% of Days 77%
4 Physical Therapy Assistant
% of Days 85%
1 Nurse Practitioner
% of Days 83%
1 Mental Health Service Worker
% of Days 67%
1 Occupational Therapy Aide
% of Days 64%
2 Clinical Nurse Specialist
% of Days 73%
1 Physical Therapy Aide
% of Days 14%
1 Qualified Social Worker
% of Days 28%

Penalties and fines

Federal penalties imposed by CMS for regulatory violations, including civil money penalties (fines) and denials of payment for new Medicare/Medicaid admissions.

Source: CMS Penalties Database (Data as of Jan 2026)

Total fines amount $10K Rank #70 / 168Federal fines — State benchmarkedThis home is ranked 70th out of 168 homes in Illinois. Shows this facility's cumulative CMS federal fine dollars versus the Illinois average among facilities with fines, and where it ranks among 168 facilities in the pool. Lower total dollars mean a better rank.Click the rank badge to see the full State ranking.Click here to see the full State ranking.
93% lower than Illinois average

Illinois average: $143K

Number of fines 1
66% fewer fines than Illinois average

Illinois average: 3.0

Payment Denials Info Serious action where Medicare and/or Medicaid temporarily stops payments for new residents until issues are fixed. 0
100% fewer payment denials than Illinois average

Illinois average: 1.1

Fines amount comparison
This facility $10K
Illinois average $143K

No penalties in the past 3 years

No civil money penalties or payment denials were reported in the last 3 years.

Quality of care over time

These measures show how residents usually do over time at this home, based on health outcomes and preventive care.

High-risk clinical events score Info A composite score based on pressure ulcers, falls with injury, weight loss, walking ability decline, and activities of daily living decline. 9.4
In line with Illinois average

Illinois average: 9.7

Functional decline score Info A composite score based on activities of daily living decline, walking ability decline, and incontinence. 16.9
9% better than Illinois average

Illinois average: 18.6

Long-stay resident measures
Above average Info CMS star rating based on long-stay quality measure performance. 5 stars = significantly above average, 1 star = significantly below average.
Need for Help with Daily Activities Increased Info Percent of long-stay residents whose need for help with daily activities has increased 19.5%
26% worse than Illinois average

Illinois average: 15.5%

Walking Ability Worsened Info Percent of long-stay residents whose ability to move independently worsened 18.5%
In line with Illinois average

Illinois average: 18.4%

Low Risk Residents with Bowel/Bladder Incontinence Info Percent of low risk long-stay residents who lose control of their bowels or bladder 12.6%
42% better than Illinois average

Illinois average: 21.6%

Falls with Major Injury Info Percent of long-stay residents experiencing one or more falls with major injury 0.3%
92% better than Illinois average

Illinois average: 3.4%

High Risk Residents with Pressure Ulcers Info Percent of long-stay high risk residents with pressure ulcers 6.3%
20% worse than Illinois average

Illinois average: 5.3%

Urinary Tract Infection Info Percent of long-stay residents with a urinary tract infection 0.0%
100% better than Illinois average

Illinois average: 1.8%

Lost Too Much Weight Info Percent of long-stay residents who lose too much weight 2.1%
67% better than Illinois average

Illinois average: 6.5%

Depressive Symptoms Info Percent of long-stay residents who have depressive symptoms 48.6%
In line with Illinois average

Illinois average: 48.1%

Antipsychotic Use Info Percent of long-stay residents who received an antipsychotic medication 15.3%
24% better than Illinois average

Illinois average: 20.2%

Pneumococcal Vaccine Info Percent of long-stay residents assessed and appropriately given the pneumococcal vaccine 83.0%
7% worse than Illinois average

Illinois average: 89.2%

Influenza Vaccine Info Percent of long-stay residents assessed and appropriately given the seasonal influenza vaccine 91.8%
In line with Illinois average

Illinois average: 91.6%

Hospitalizations per 1,000 days Info Number of hospitalizations per 1,000 long-stay resident days. 2.64
29% worse than Illinois average

Illinois average: 2.05

ED visits per 1,000 days Info Number of outpatient emergency department visits per 1,000 long-stay resident days. 1.61
28% better than Illinois average

Illinois average: 2.25

Short-stay resident measures
Below average Info CMS star rating based on short-stay quality measure performance. 5 stars = much above average, 1 star = much below average.
Pneumococcal Vaccine Info Percent of short-stay residents assessed and appropriately given the pneumococcal vaccine 32.4%
53% worse than Illinois average

Illinois average: 68.3%

Antipsychotic medication increase Info Percent of short-stay residents who newly received an antipsychotic medication 1.8%
22% better than Illinois average

Illinois average: 2.3%

Influenza Vaccine Info Percent of short-stay residents assessed and appropriately given the seasonal influenza vaccine 50.7%
20% worse than Illinois average

Illinois average: 63.0%

Re-hospitalized after SNF stay Info Percentage of short-stay residents who were re-hospitalized after their nursing home admission. 21.8%
17% better than Illinois average

Illinois average: 26.2%

Emergency department visits Info Percentage of short-stay residents who had an outpatient emergency department visit. 9.2%
34% better than Illinois average

Illinois average: 14.0%

Falls with major injury Info Percentage of SNF residents who experience falls with major injury during their stay. 0.0%
100% better than Illinois average

Illinois average: 0.8%

Ability to care for self at discharge Info Percentage of residents at or above expected ability to care for themselves at discharge. 48.3%
10% worse than Illinois average

Illinois average: 53.7%

Successful return to home or community Info Rate of successful return to home or community from a skilled nursing facility. 43.9%
13% worse than Illinois average

Illinois average: 50.6%

Breakdown by payment type

Medicare

72% of new residents, usually for short-term rehab.

Typical stay 1 - 2 months

Private pay

17% of new residents, often for short stays.

Typical stay 3 - 4 years

Medicaid

11% of new residents, often for long-term daily care.

Typical stay 1 years

Facility Characteristics

Source: CMS Long-Term Care Facility Characteristics (Data as of Jan 2026)

Total residents 102
Medicare
12
11.8% of residents
Medicaid
65
63.7% of residents
Private pay or other
25
24.5% of residents
Programs & Services
Residents Group

Residents meet regularly to discuss policies, care quality, and activities

Active Resident Council

Organized group of residents that meets regularly to discuss facility policies, quality of life, and activities.

Finances and operations

Voluntary non-profit community
Operated by a church.
Home revenue
$10.9M
Operating deficit
-$115.6K
Voluntary non-profit community Operated by a church.
Home revenue
$10.9M Rank #120 / 166Revenue — State benchmarkedThis home is ranked 120th out of 166 homes in Illinois. Shows this facility's annual revenue compared to the Illinois average. Higher revenue generally means more resources for staffing and capital — read alongside Payroll %.Click the rank badge to see the full State ranking.Click here to see the full State ranking.
Operating deficit
-$115.6K
Payroll costs Info The portion of the home's budget spent on staff, including nurses, caregivers, and other employees who support care and operations. Rank #102 / 166Payroll — State benchmarkedThis home is ranked 102nd out of 166 homes in Illinois. Shows total annual staff payroll benchmarked to the Illinois average. Higher payroll investment relative to peers often signals better staffing and less reliance on cheaper contract labor.Click the rank badge to see the full State ranking.Click here to see the full State ranking.
$6.2M
56.6% of revenue Rank #46 / 166Payroll % — State benchmarkedThis home is ranked 46th out of 166 homes in Illinois. Shows payroll as a percentage of revenue versus the Illinois average. Well-run Illinois facilities typically land around 54–67% — the top third Statewide. Below 25% may signal understaffing or heavy agency use — read with Staffing ratings.Click the rank badge to see the full State ranking.Click here to see the full State ranking.
Other operating costs Info All remaining costs needed to run the home, such as food, utilities, building maintenance, supplies and administrative expenses.
$4.8M
Total costs $11.0M

What does this home offer?

Building type icon
Building type icon

Building Type: Mid-rise

Who this home usually serves

TYPE OF STAY

Mostly short-term rehab stays

Most residents typically stay for a few weeks or months before returning home or moving on.

Places of interest near Buckingham Pavilion Nursing and Rehabilitation

Address 15.4 miles from city center Info Estimated distance in miles from Chicago's city center to Buckingham Pavilion Nursing and Rehabilitation's address, calculated via Google Maps. — 6.17 miles to nearest hospital (Ascension Saint Joseph - Chicago)

Calculate Travel Distance to Buckingham Pavilion Nursing and Rehabilitation

Add your location

Address

Financial Assistance for
Nursing Home in Illinois

Buckingham Pavilion Nursing and Rehabilitation is located in Chicago, Illinois.
Here are the financial assistance programs available to residents in Illinois.

Get Financial aid guidance

Community Care Program

Illinois CCP

Age 60+
General Illinois resident, at risk of nursing home placement.
Income Limits (2025) ~$1,215/month individual
Asset Limits $17,500 individual, excludes home, car
IL

High demand in urban areas; waitlists possible.

Benefits
In-home care (3-5 hours/day) Adult day services ($65/day) Emergency home response systems ($30/month)

Illinois Respite Program

IL Respite (via NFCSP)

Age Caregiver of someone 60+ (or with dementia)
General Illinois resident.
Income Limits No strict limit; prioritizes low-income.
Asset Limits Not applicable.
IL

Limited slots; urban/rural balance.

Benefits
In-home respite (4-6 hours/day) Adult day care (~$65/day) Short-term facility care (up to 5 days)

Supportive Living Program (SLP)

Illinois Medicaid Supportive Living Program

Age 65+ or 22-64 with disability
General Illinois resident, Medicaid-eligible, needs moderate assistance (not nursing home-level).
Income Limits (2025) ~$2,829/month (300% FBR, individual); QIT allowed.
Asset Limits $2,000 (individual), $3,000 (couple) (excludes home, car).
IL

~200 SLP sites statewide; room/board not covered.

Benefits
Personal care (5-7 hours/day, e.g., bathing, mobility) Meals Housekeeping Medication management Respite (~240 hours/year)

Persons Who Are Elderly Waiver

Illinois Medicaid Elderly Waiver

Age 65+
General Illinois resident, Medicaid-eligible, nursing home-level care need.
Income Limits (2025) ~$2,829/month 300% FBR, individual
Asset Limits $2,000 (individual), $3,000 (couple).
IL

Part of HealthChoice Illinois; consumer-directed options available.

Benefits
Personal care (5-7 hours/day, e.g., dressing, eating) Homemaker Adult day care (~$60/day) Respite (240 hours/year) Home mods ($1,000 avg.)

Medicare Savings Program (MSP)

Illinois Medicare Savings Program

Age 65+ or disabled
General Illinois resident, Medicare Part A/B.
Income Limits (2025) ~$2,510/month (QMB), ~$3,380/month (SLMB), ~$3,598/month (QI)—individual.
Asset Limits $9,430 (individual), $14,130 (couple).
IL

Three tiers; no waitlist.

Benefits
Covers Part B premiums ($174.70/month) Deductibles ($240/year) Copays (~20%)

Optional State Supplementation (OSS)

Illinois Optional State Supplementation

Age 65+ or disabled
General Illinois resident, in approved facility, SSI recipient or low-income.
Income Limits (2025) ~$1,004/month including SSI
Asset Limits $2,000 (individual), $3,000 (couple).
IL

~$50-$500/month based on facility type.

Benefits
Cash (~$50-$500/month) for room/board in personal care homes or SLFs

VA Aid and Attendance (A&A) and Housebound Benefits

Illinois VA Aid and Attendance/Housebound

Age 65+ or disabled veteran/spouse
General Illinois resident, wartime service, need for ADL help (A&A) or homebound.
Income Limits (2025) Net income < ~$1,984/month (veteran with dependent, A&A); pension offsets income.
Asset Limits ~$155,356 net worth limit
IL

High veteran demand in urban/rural areas.

Benefits
Cash (~$1,433-$2,642/month veteran, ~$951-$1,318 spouse) for care costs (e.g., in-home, assisted living)

Compare Nursing Home around Chicago

The information below is reported by the Illinois Department of Public Health, Office of Health Care Regulation.

5 facilities compared · CMS & IL Dept. of Health data

The Clare
NH

Nursing Home Licensed facility providing 24/7 skilled nursing care for residents with complex, ongoing medical needs. Staffed by RNs, LPNs, and CNAs. Inspected and star-rated annually by CMS. Accepts Medicare (short-term rehab) and Medicaid (long-term care).

AL

Assisted Living A licensed, long-term care setting for seniors or individuals with disabilities who need help with daily activities — like bathing, dressing, and medication management — but not 24-hour skilled nursing. Offers housing, meals, and around-the-clock support while aiming to maximize resident independence.

IL

Independent Living Lifestyle-focused communities for older adults offering dining, activities, and transportation with minimal personal care. Best for active, independent seniors who want community without medical support.

MC

Memory Care Secured, specialized care for people living with Alzheimer's or dementia. Staff trained in cognitive impairment, with higher staff-to-resident ratios and an environment designed to reduce confusion and wandering risk.

Chicago (Rush & Division)
49
Facility 49
IL AVG 86
Rank #301 / 426
91.7%
Facility 91.7%
IL AVG 69.3%
Rank #62 / 199
+32%
3.69
Facility 3.69
IL AVG 3.10
Rank #51 / 167
+61%+19%
$0
Facility $0
IL AVG $151.3k
Rank #1 / 168
13
Facility 13
IL AVG 36.8
Rank #20 / 167
2.6
Facility 2.6
IL AVG 3.7
Rank #28 / 167
144A+
100
Facility 100
IL AVG 51
Rank #1 / 648
County Of Fulton
$5.2M
Facility $5.2M
IL AVG $12.2M
Rank #158 / 166
$3.6M
Facility $3.6M
IL AVG $4.8M
Rank #153 / 166
68.5%
Facility 68.5%
IL AVG 44.3%
Rank #14 / 166
146151
Encore Village of Schaumburg
NH

Nursing Home Licensed facility providing 24/7 skilled nursing care for residents with complex, ongoing medical needs. Staffed by RNs, LPNs, and CNAs. Inspected and star-rated annually by CMS. Accepts Medicare (short-term rehab) and Medicaid (long-term care).

AL

Assisted Living A licensed, long-term care setting for seniors or individuals with disabilities who need help with daily activities — like bathing, dressing, and medication management — but not 24-hour skilled nursing. Offers housing, meals, and around-the-clock support while aiming to maximize resident independence.

IL

Independent Living Lifestyle-focused communities for older adults offering dining, activities, and transportation with minimal personal care. Best for active, independent seniors who want community without medical support.

MC

Memory Care Secured, specialized care for people living with Alzheimer's or dementia. Staff trained in cognitive impairment, with higher staff-to-resident ratios and an environment designed to reduce confusion and wandering risk.

Schaumburg
109
Facility 109
IL AVG 86
Rank #108 / 426
--
3.46
Facility 3.46
IL AVG 3.10
Rank #55 / 167
+8%+12%
$25.5k
Facility $25.5k
IL AVG $151.3k
Rank #84 / 168
28
Facility 28
IL AVG 36.8
Rank #69 / 167
2.6
Facility 2.6
IL AVG 3.7
Rank #28 / 167
2105A+
58
Facility 58
IL AVG 51
Rank #253 / 648
Il Ccrc, LLC
$96.9M
Facility $96.9M
IL AVG $12.2M
Rank #1 / 166
$18.2M
Facility $18.2M
IL AVG $4.8M
Rank #4 / 166
18.8%
Facility 18.8%
IL AVG 44.3%
Rank #166 / 166
145341
Buckingham Pavilion Nursing and Rehabilitation
NH

Nursing Home Licensed facility providing 24/7 skilled nursing care for residents with complex, ongoing medical needs. Staffed by RNs, LPNs, and CNAs. Inspected and star-rated annually by CMS. Accepts Medicare (short-term rehab) and Medicaid (long-term care).

AL

Assisted Living A licensed, long-term care setting for seniors or individuals with disabilities who need help with daily activities — like bathing, dressing, and medication management — but not 24-hour skilled nursing. Offers housing, meals, and around-the-clock support while aiming to maximize resident independence.

IL

Independent Living Lifestyle-focused communities for older adults offering dining, activities, and transportation with minimal personal care. Best for active, independent seniors who want community without medical support.

MC

Memory Care Secured, specialized care for people living with Alzheimer's or dementia. Staff trained in cognitive impairment, with higher staff-to-resident ratios and an environment designed to reduce confusion and wandering risk.

Chicago (West Ridge)
235
Facility 235
IL AVG 86
Rank #15 / 426
--
2.58
Facility 2.58
IL AVG 3.10
Rank #110 / 167
+7%-17%
$0
Facility $0
IL AVG $151.3k
Rank #70 / 168
29
Facility 29
IL AVG 36.8
Rank #73 / 167
9.7
Facility 9.7
IL AVG 3.7
Rank #167 / 167
-116-
83
Facility 83
IL AVG 51
Rank #88 / 648
Leah Kazlow
$10.9M
Facility $10.9M
IL AVG $12.2M
Rank #120 / 166
$6.2M
Facility $6.2M
IL AVG $4.8M
Rank #102 / 166
56.6%
Facility 56.6%
IL AVG 44.3%
Rank #46 / 166
145285
Admiral at the Lake
NH

Nursing Home Licensed facility providing 24/7 skilled nursing care for residents with complex, ongoing medical needs. Staffed by RNs, LPNs, and CNAs. Inspected and star-rated annually by CMS. Accepts Medicare (short-term rehab) and Medicaid (long-term care).

AL

Assisted Living A licensed, long-term care setting for seniors or individuals with disabilities who need help with daily activities — like bathing, dressing, and medication management — but not 24-hour skilled nursing. Offers housing, meals, and around-the-clock support while aiming to maximize resident independence.

IL

Independent Living Lifestyle-focused communities for older adults offering dining, activities, and transportation with minimal personal care. Best for active, independent seniors who want community without medical support.

MC

Memory Care Secured, specialized care for people living with Alzheimer's or dementia. Staff trained in cognitive impairment, with higher staff-to-resident ratios and an environment designed to reduce confusion and wandering risk.

Chicago (Uptown)
56
Facility 56
IL AVG 86
Rank #278 / 426
88.6%
Facility 88.6%
IL AVG 69.3%
Rank #40 / 199
+28%
4.93
Facility 4.93
IL AVG 3.10
Rank #19 / 167
-22%+59%
$0
Facility $0
IL AVG $151.3k
Rank #1 / 168
26
Facility 26
IL AVG 36.8
Rank #62 / 167
5.2
Facility 5.2
IL AVG 3.7
Rank #146 / 167
131A+
90
Facility 90
IL AVG 51
Rank #40 / 648
Nadia Geigler
$25.6M
Facility $25.6M
IL AVG $12.2M
Rank #39 / 166
$11.0M
Facility $11.0M
IL AVG $4.8M
Rank #35 / 166
42.8%
Facility 42.8%
IL AVG 44.3%
Rank #110 / 166
146165
Montgomery Place
NH

Nursing Home Licensed facility providing 24/7 skilled nursing care for residents with complex, ongoing medical needs. Staffed by RNs, LPNs, and CNAs. Inspected and star-rated annually by CMS. Accepts Medicare (short-term rehab) and Medicaid (long-term care).

AL

Assisted Living A licensed, long-term care setting for seniors or individuals with disabilities who need help with daily activities — like bathing, dressing, and medication management — but not 24-hour skilled nursing. Offers housing, meals, and around-the-clock support while aiming to maximize resident independence.

HC

Home Care Professional care delivered in the person's own home — from companionship and errands to skilled nursing and therapy. Allows seniors to age in place. Medicare covers skilled home health when medically necessary.

IL

Independent Living Lifestyle-focused communities for older adults offering dining, activities, and transportation with minimal personal care. Best for active, independent seniors who want community without medical support.

MC

Memory Care Secured, specialized care for people living with Alzheimer's or dementia. Staff trained in cognitive impairment, with higher staff-to-resident ratios and an environment designed to reduce confusion and wandering risk.

Chicago (East Hyde Park)
40
Facility 40
IL AVG 86
Rank #350 / 426
35.0%
Facility 35.0%
IL AVG 69.3%
Rank #185 / 199
-49%
4.00
Facility 4.00
IL AVG 3.10
Rank #43 / 167
+31%+29%
$51.6k
Facility $51.6k
IL AVG $151.3k
Rank #102 / 168
30
Facility 30
IL AVG 36.8
Rank #79 / 167
4.3
Facility 4.3
IL AVG 3.7
Rank #128 / 167
114A+
82
Facility 82
IL AVG 51
Rank #98 / 648
Margo Brooks Pugh
$17.4M
Facility $17.4M
IL AVG $12.2M
Rank #70 / 166
$8.3M
Facility $8.3M
IL AVG $4.8M
Rank #68 / 166
47.7%
Facility 47.7%
IL AVG 44.3%
Rank #83 / 166
145748

Frequently Asked Questions about Buckingham Pavilion Nursing and Rehabilitation

What neighborhood is Buckingham Pavilion Nursing and Rehabilitation in?

Buckingham Pavilion Nursing and Rehabilitation is in the West Ridge neighborhood of Chicago.

Is Buckingham Pavilion Nursing and Rehabilitation in a walkable area?

Buckingham Pavilion Nursing and Rehabilitation has a walk score of 83. Very walkable. Most errands can be accomplished on foot, and many essentials are within a short walk.

Does Buckingham Pavilion Nursing and Rehabilitation operate as a for-profit or non-profit?

Buckingham Pavilion Nursing and Rehabilitation is registered as a for-profit in IL.

Are there photos of Buckingham Pavilion Nursing and Rehabilitation?

Yes — there are 4 photos of Buckingham Pavilion Nursing and Rehabilitation in the photo gallery on this page.

What is the address of Buckingham Pavilion Nursing and Rehabilitation?

Buckingham Pavilion Nursing and Rehabilitation is located at 2625 W Touhy Ave, Chicago, IL 60645, United States.

What is the phone number of Buckingham Pavilion Nursing and Rehabilitation?

(773) 973-5333 will put you in contact with the team at Buckingham Pavilion Nursing and Rehabilitation.

Is Buckingham Pavilion Nursing and Rehabilitation Medicare or Medicaid certified?

Yes — Buckingham Pavilion Nursing and Rehabilitation is a CMS-certified provider of Medicare and Medicaid.

Guides for Better Senior Living

Care Cost Calculator: See Prices in Your Area

Nursing Home Data Explorer

Don’t Wait Too Long: 7 Red Flag Signs Your Parent Needs Assisted Living Now

The True Cost of Assisted Living in 2025 – And How Families Are Paying For It

Understanding Senior Living Costs: Pricing Models, Discounts & Financial Assistance

Explore Open Rooms
1 Contact details
2 What type of senior care service are you looking for?
3 What budget do you have in mind for senior care?
4 How soon do you need to find care?
5 Additional details

Thank you for your interest!

Our team will be in touch shortly to help with next steps.