


Total health inspections
19
Illinois average 10.4
Last Health inspection on Sep 2025
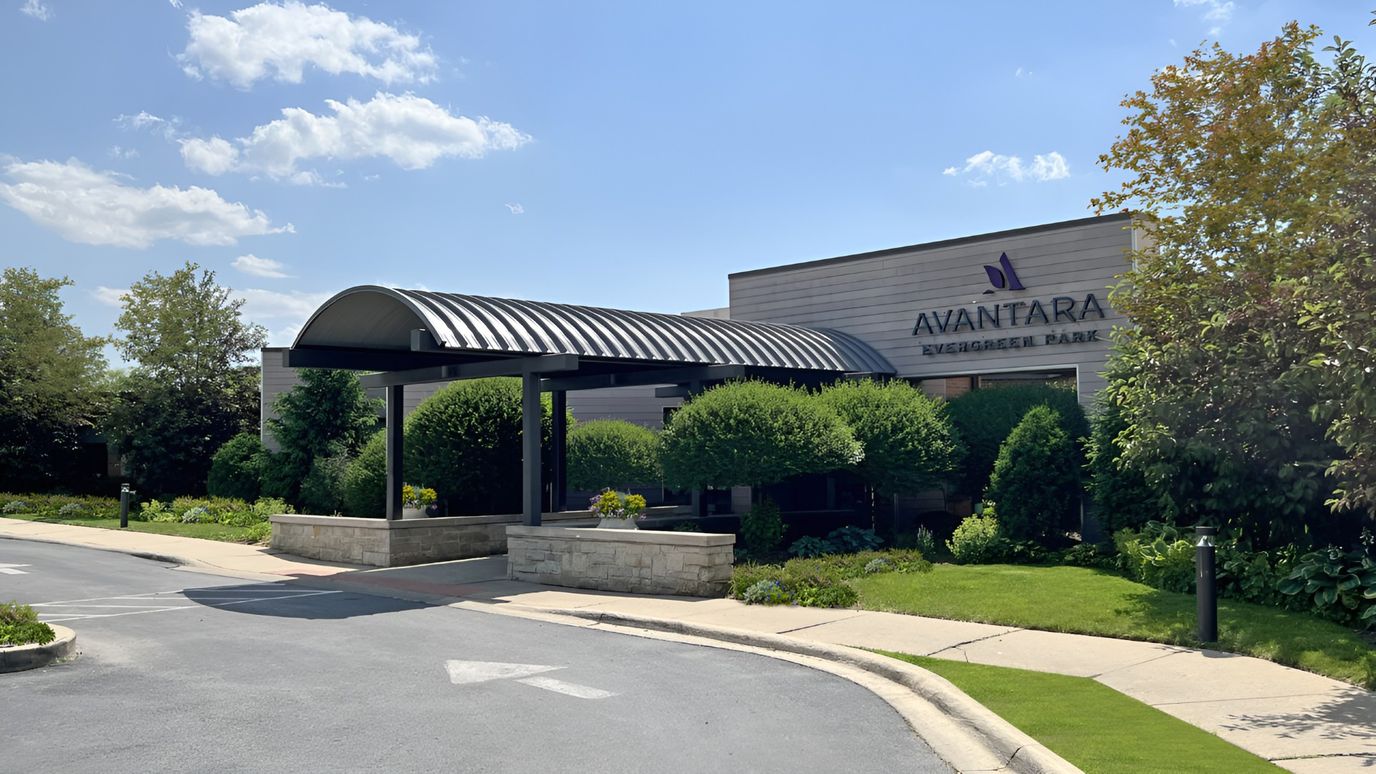


Avantara Evergreen Park, a 242-bed skilled nursing facility in Evergreen Park’s South Kedzie Avenue neighborhood, serves primarily short-stay rehabilitation residents across a private-pay-weighted population (66 percent), with an average stay of 48 days. Menachem Berger owns the facility; Chaim Rajchenbach serves as administrator. The Joint Commission awarded Avantara Evergreen Park a Gold Seal of Approval.
Situated in Cook County, 1.03 miles from OSF Little Company of Mary Medical Center.
The facility’s compliance record shows severe strain. State inspectors conducted 19 health inspections since 2023, documenting 71 deficiencies; that’s nearly ten times the Illinois statewide average and at a rate of 23.7 per year. The September 2025 inspection found the facility failed to promptly recognize and transfer a resident with sepsis symptoms, resulting in delayed hospitalization, septic shock, and pneumonia. Earlier investigations substantiated failures across resident transfers, fall prevention protocols, pressure ulcer management, and supervision.
The facility faces 13 serious citations (typical Illinois facilities average 3.6) and has paid federal penalties totaling $353,000 in five separate enforcement actions since August 2023.
An arrest of a staff member for resident theft and financial abuse occurred in 2024.
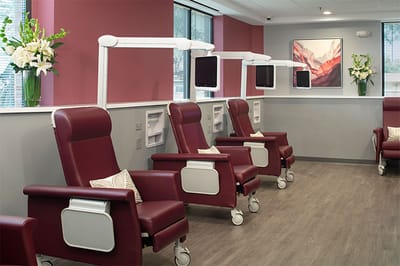
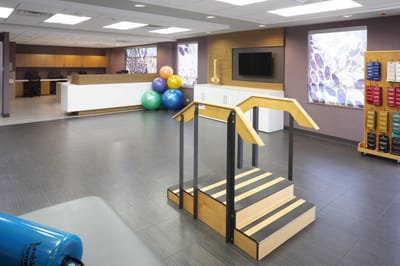
Nursing staffing averages 2 hours 40 minutes per resident daily; which is 32 percent below Illinois benchmarks and ranked 99th among 167 state facilities. Despite these pressures, the facility offers on-site dialysis, cardiac rehabilitation, orthopedic services, and transitional rehabilitation.
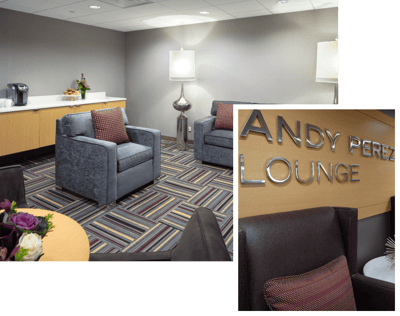
Accommodations include private and semi-private suites, community gathering spaces, on-site salon services, and facility-wide high-speed Wi-Fi.
Quality measures and clinical outcomes trail state standards across most domains.
Avantara Evergreen Park is structured for short-term rehabilitation placements, with a 48-day average length of stay and a resident population dominated by private-pay and Medicare admissions.
Staffing hours
![]() Daily nursing hours per resident by staff type, reported to CMS. Higher is generally better — compare this facility to state and national averages to see where staffing stands.
Daily nursing hours per resident by staff type, reported to CMS. Higher is generally better — compare this facility to state and national averages to see where staffing stands.
Hours per resident per day vs Illinois averages
Total nursing care
![]() This home is ranked 98th out of 155 homes in Illinois for nurse hours. Total adjusted nursing hours per resident per day, combining RN, LPN, and aide time. CMS adjusts this for case-mix so facilities can be fairly compared.
This home is ranked 98th out of 155 homes in Illinois for nurse hours. Total adjusted nursing hours per resident per day, combining RN, LPN, and aide time. CMS adjusts this for case-mix so facilities can be fairly compared.
2h 40m
14% below state avg2 of 6 metrics below state avg
In Illinois, the Department of Public Health, Office of Health Care Regulation conducts annual unannounced surveys to assess compliance with state and federal healthcare facility standards.
Deficiencies
| This Facility | IL Average | vs. IL Avg |
|---|---|---|---|
|
Total deficiencies
| 71 | 7 | This facility has 914% more total deficiencies than a typical Illinois nursing home (71 vs. IL avg 7).↑ 914% worse |
|
Deficiencies per inspection
| 3.7 | 0.8 | This facility has 363% more deficiencies per inspection than a typical Illinois nursing home (3.7 vs. IL avg 0.8).↑ 363% worse |
Inspections
| This Facility | IL Average | vs. IL Avg |
|---|---|---|---|
|
Total inspections
| 19 | 9 | This facility has had 111% more total inspections than the Illinois average (19 vs. IL avg 9). More inspections can mean more regulatory scrutiny rather than worse care.↑ 111% more |
Illinois average 10.4
Last Health inspection on Sep 2025
Illinois average 36.8
Illinois average 3.68
Health citations are formal notices following inspections when they fail to comply with safety and care standards.
30 of 65 citations resulted from standard inspections; 33 of 65 resulted from complaint investigations; and 2 of 65 came from combined inspections (standard and complaint).
Illinois average: 0.7
Illinois average: 3.6
Reporting period: October 1 – December 31, 2025 (Q4 2025). Source: CMS Payroll-Based Journal report.
Manages medical care and health needs.
Assists with medical care and medications.
Helps with daily care and mobility.
Total hours from contractors
11,231 contractor hours this quarter
| Certified Nursing Assistant | 94 | 10 | 104 | 29,843 | 92 | 100% | 7.3 |
| Licensed Practical Nurse | 34 | 77 | 111 | 10,660 | 92 | 100% | 7.4 |
| Registered Nurse | 28 | 78 | 106 | 10,152 | 92 | 100% | 7.9 |
| Clinical Nurse Specialist | 8 | 0 | 8 | 2,789 | 91 | 99% | 5.5 |
| RN Director of Nursing | 7 | 0 | 7 | 2,743 | 90 | 98% | 5.9 |
| Speech Language Pathologist | 0 | 9 | 9 | 1,934 | 81 | 88% | 7.2 |
| Physical Therapy Aide | 0 | 8 | 8 | 1,804 | 74 | 80% | 7.6 |
| Other Dietary Services Staff | 8 | 0 | 8 | 1,776 | 92 | 100% | 7.3 |
| Dental Services Staff | 2 | 0 | 2 | 1,015 | 90 | 98% | 5.6 |
| Physical Therapy Assistant | 0 | 3 | 3 | 964 | 78 | 85% | 7.1 |
| Respiratory Therapy Technician | 0 | 3 | 3 | 727 | 86 | 93% | 6.7 |
| Qualified Social Worker | 0 | 7 | 7 | 704 | 87 | 95% | 6.2 |
| Administrator | 1 | 0 | 1 | 516 | 90 | 98% | 5.7 |
| Nurse Practitioner | 1 | 0 | 1 | 508 | 90 | 98% | 5.6 |
| Dietitian | 1 | 0 | 1 | 508 | 90 | 98% | 5.6 |
| Mental Health Service Worker | 1 | 0 | 1 | 500 | 89 | 97% | 5.6 |
Includes penalties issued in 2023-2024
Federal penalties imposed by CMS for regulatory violations, including civil money penalties (fines) and denials of payment for new Medicare/Medicaid admissions.
Source: CMS Penalties Database (Data as of Jan 2026)
Illinois average: $143K
Illinois average: 3.0
Illinois average: 1.1
Penalties are imposed by CMS for violations of federal nursing home regulations.
5 penalties in the past 3 years
Multiple penalties were reported in the last 3 years.
Last updated: Jan 2026
These measures show how residents usually do over time at this home, based on health outcomes and preventive care.
Illinois average: 9.7
Illinois average: 18.6
Illinois average: 15.5%
Illinois average: 18.4%
Illinois average: 21.6%
Illinois average: 3.4%
Illinois average: 5.3%
Illinois average: 1.8%
Illinois average: 6.5%
Illinois average: 48.1%
Illinois average: 20.2%
Illinois average: 89.2%
Illinois average: 91.6%
Illinois average: 2.05
Illinois average: 2.25
Illinois average: 68.3%
Illinois average: 2.3%
Illinois average: 63.0%
Illinois average: 26.2%
Illinois average: 14.0%
Illinois average: 0.8%
Illinois average: 53.7%
Illinois average: 50.6%
Quality measures are calculated from Minimum Data Set (MDS) assessments. For most measures, lower percentages indicate better care quality.
25% of new residents, usually for short-term rehab.
66% of new residents, often for short stays.
9% of new residents, often for long-term daily care.
Source: CMS Long-Term Care Facility Characteristics (Data as of Jan 2026)
Residents meet regularly to discuss policies, care quality, and activities
Organized group of residents that meets regularly to discuss facility policies, quality of life, and activities.
Data sourced from CMS Long-Term Care Facility Characteristics quarterly report. Payer mix reflects the current resident census by primary payment source.
Historical financial and operational data for Avantara Evergreen Park from 2011–2023, based on CMS SNF Cost Reports.
Key figures below are for fiscal year ending in 12/2023.
Based on CMS SNF Cost Report for fiscal year ending in 12/2023.
Residents typically stay for brief periods, with frequent admissions and discharges throughout the year.
Most new residents arrive under private pay (66% of admissions), and a typical private pay stay runs around 1 - 2 months.
Coverage residents most often arrive under.
Coverage residents most often leave under.
![]() 0.8 miles from city center
0.8 miles from city center
![]() Estimated distance in miles from Evergreen Park's city center to Avantara Evergreen Park's address, calculated via Google Maps.
— 1.03 miles to nearest hospital (OSF Little Company of Mary Medical Center)
Estimated distance in miles from Evergreen Park's city center to Avantara Evergreen Park's address, calculated via Google Maps.
— 1.03 miles to nearest hospital (OSF Little Company of Mary Medical Center)
Add your location
Info below is compiled from CMS reports & the IL Dept. of Public Health (IDPH), senior community websites & trusted data sources such as Walk Score & BBB.
Communities are listed from highest to lowest based on our ranking methodology.
| Mercy Circle Senior Living | NH AL IL MC SNF | Chicago (Mount Greenwood) | 43
Facility
43
IL AVG
85
Rank
#330 / 419 | - | - | 4.57
Facility
4.57
IL AVG
3.10
Rank
#24 / 155 | -8% | +47% | $0
Facility
$0
IL AVG
$151.3k
Rank
#1 / 155 | 16
Facility
16
IL AVG
36.8
Rank
#24 / 155 | 4.0
Facility
4.0
IL AVG
3.7
Rank
#105 / 155 | - | 22 | - |
44
Facility
44
IL AVG
51
Rank
#392 / 648 | Sisters Of Mercy Of The Americas West Midwest Community Inc | $10.3MFiscal year ending 06/2024
Facility
$10.3MFiscal year ending 06/2024
IL AVG
$12.2M
Rank
#95 / 154 | $5.1MFiscal year ending 06/2024
Facility
$5.1MFiscal year ending 06/2024
IL AVG
$4.8M
Rank
#112 / 154 | 49.8%Fiscal year ending 06/2024
Facility
49.8%Fiscal year ending 06/2024
IL AVG
44.3%
Rank
#105 / 154 | 146174 | ||||
| The Selfhelp Home Senior Living Community | NH AL IL RC SNF | Chicago (Uptown) | 72
Facility
72
IL AVG
85
Rank
#204 / 419 |
81.9%
Facility
81.9%
IL AVG
73
Rank
#63 / 157 | +12% | 5.56
Facility
5.56
IL AVG
3.10
Rank
#8 / 155 | +44% | +79% | $0
Facility
$0
IL AVG
$151.3k
Rank
#1 / 155 | 21
Facility
21
IL AVG
36.8
Rank
#41 / 155 | 5.3
Facility
5.3
IL AVG
3.7
Rank
#138 / 155 | 1 | 59 | A+ |
92
Facility
92
IL AVG
51
Rank
#28 / 648 | Marvin Rubin | $9.3MFiscal year ending 09/2023
Facility
$9.3MFiscal year ending 09/2023
IL AVG
$12.2M
Rank
#76 / 154 | $7.0MFiscal year ending 09/2023
Facility
$7.0MFiscal year ending 09/2023
IL AVG
$4.8M
Rank
#72 / 154 | 75.3%Fiscal year ending 09/2023
Facility
75.3%Fiscal year ending 09/2023
IL AVG
44.3%
Rank
#59 / 154 | 146009 | ||||
| The Clare | NH AL IL MC SNF | Chicago (Rush & Division) | 49
Facility
49
IL AVG
85
Rank
#294 / 419 |
92.2%
Facility
92.2%
IL AVG
73
Rank
#23 / 157 | +26% | 3.69
Facility
3.69
IL AVG
3.10
Rank
#48 / 155 | +61% | +19% | $0
Facility
$0
IL AVG
$151.3k
Rank
#1 / 155 | 13
Facility
13
IL AVG
36.8
Rank
#19 / 155 | 2.6
Facility
2.6
IL AVG
3.7
Rank
#25 / 155 | 1 | 45 | A+ |
100
Facility
100
IL AVG
51
Rank
#1 / 648 | County Of Fulton | $4.4MFiscal year ending 11/2023
Facility
$4.4MFiscal year ending 11/2023
IL AVG
$12.2M
Rank
#147 / 154 | $3.6MFiscal year ending 11/2023
Facility
$3.6MFiscal year ending 11/2023
IL AVG
$4.8M
Rank
#146 / 154 | 81.8%Fiscal year ending 11/2023
Facility
81.8%Fiscal year ending 11/2023
IL AVG
44.3%
Rank
#14 / 154 | 146151 | ||||
| Asbury Gardens | NH HOS MC PC SNF | North Aurora (Airport Road) | 75
Facility
75
IL AVG
85
Rank
#193 / 419 |
76.5%
Facility
76.5%
IL AVG
73
Rank
#78 / 157 | +5% | 4.00
Facility
4.00
IL AVG
3.10
Rank
#41 / 155 | +6% | +29% | $6.4k
Facility
$6.4k
IL AVG
$151.3k
Rank
#66 / 155 | 21
Facility
21
IL AVG
36.8
Rank
#41 / 155 | 3.5
Facility
3.5
IL AVG
3.7
Rank
#72 / 155 | - | 57 | A+ |
38
Facility
38
IL AVG
51
Rank
#434 / 648 | Abraham Diamond | $6.7MFiscal year ending 12/2023
Facility
$6.7MFiscal year ending 12/2023
IL AVG
$12.2M
Rank
#137 / 154 | $3.8MFiscal year ending 12/2023
Facility
$3.8MFiscal year ending 12/2023
IL AVG
$4.8M
Rank
#128 / 154 | 56.5%Fiscal year ending 12/2023
Facility
56.5%Fiscal year ending 12/2023
IL AVG
44.3%
Rank
#28 / 154 | 146170 | ||||
| Avantara Evergreen Park | NH MC PC SNF | Evergreen Park (South Kedzie Avenue) | 242
Facility
242
IL AVG
85
Rank
#13 / 419 |
57.4%
Facility
57.4%
IL AVG
73
Rank
#133 / 157 | -21% | 2.67
Facility
2.67
IL AVG
3.10
Rank
#98 / 155 | +97% | -14% | $237.4k
Facility
$237.4k
IL AVG
$151.3k
Rank
#142 / 155 | 65
Facility
65
IL AVG
36.8
Rank
#137 / 155 | 3.4
Facility
3.4
IL AVG
3.7
Rank
#67 / 155 | 13 | 139 | A+ |
67
Facility
67
IL AVG
51
Rank
#177 / 648 | Menachem Berger | $21.3MFiscal year ending 12/2023
Facility
$21.3MFiscal year ending 12/2023
IL AVG
$12.2M
Rank
#13 / 154 | $7.1MFiscal year ending 12/2023
Facility
$7.1MFiscal year ending 12/2023
IL AVG
$4.8M
Rank
#38 / 154 | 33.5%Fiscal year ending 12/2023
Facility
33.5%Fiscal year ending 12/2023
IL AVG
44.3%
Rank
#145 / 154 | 145734 |
Avantara Evergreen Park is located in Evergreen Park, Illinois.
Here are the financial assistance programs available to residents in Illinois.
Avantara Evergreen Park is in the South Kedzie Avenue neighborhood of Evergreen Park.
Avantara Evergreen Park has a walk score of 67. Moderately walkable. Some errands can be accomplished on foot, with a mix of nearby amenities.
Avantara Evergreen Park's occupancy is 61.6%.
Avantara Evergreen Park has been operating for approximately 13 years, based on available licensing and registration records.
No, Avantara Evergreen Park has a no-pet policy.
Avantara Evergreen Park is registered as a for-profit in IL.
Avantara Evergreen Park has had 71 reported deficiencies since 2023 according to records from Illinois Department of Public Health (IDPH).
Care Cost Calculator: See Prices in Your Area
Nursing Home Data Explorer
Don’t Wait Too Long: 7 Red Flag Signs Your Parent Needs Assisted Living Now
The True Cost of Assisted Living in 2025 – And How Families Are Paying For It
Understanding Senior Living Costs: Pricing Models, Discounts & Financial Assistance


