Total health inspections
8
Illinois average 10.4
Last Health inspection on Jan 2025

We arrange tours, appointments, and even moving support so you don’t have to
Thank you for your interest!
Our team will be in touch shortly to help with next steps.

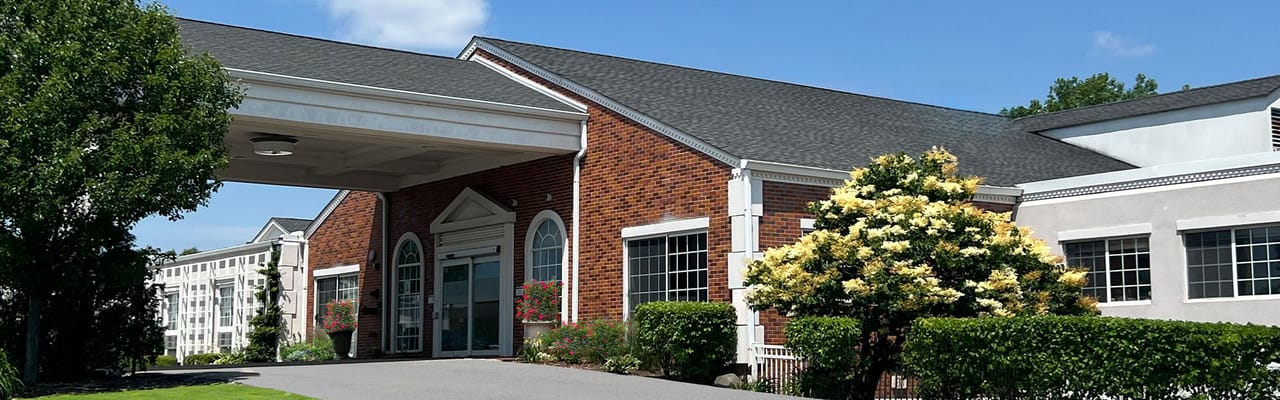

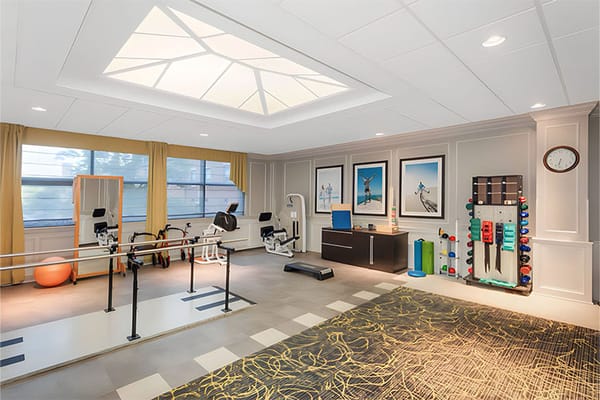
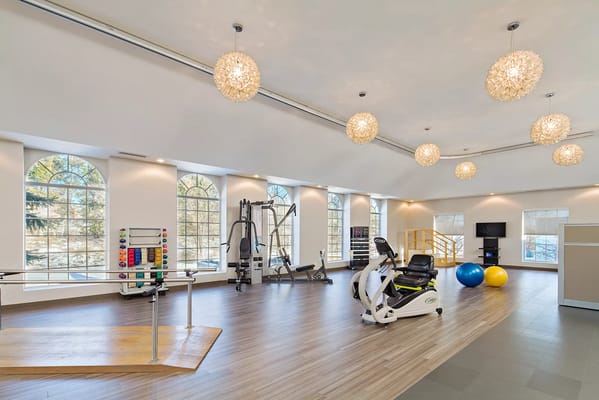


Avantara Long Grove is a place where the beauty of nature meets exceptional care. They provide top-notch post-hospital services in Lake County, along with luxurious amenities that offer residents an unmatched level of comfort. Their advanced rehabilitation services are equipped with state-of-the-art equipment and facilities, full-time therapists, and highly skilled caregivers, ensuring that residents receive the best care possible. In addition to their specialized care, they offer oncology services, wound care, post-surgical rehabilitation, and more.
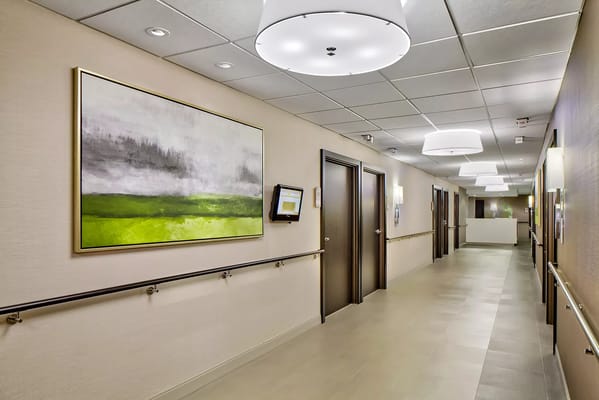
Residents can enjoy an active or laid-back lifestyle, with sound-proofed homes that reduce outside noise and promote quality rest. On-site salon services are available for pampering and helping residents to look and feel their best, while high-speed Wi-Fi and private and semi-private suites add to the exceptional experience. The food at Avantara Long Grove is not only nourishing but also inspiring, with fresh ingredients prepared throughout the day. It’s a place where residents can appreciate the attention to detail and genuine care that goes into everything they do.
Offers a balance of services and community atmosphere.
Lower occupancy suggests more openings may be available.
Most residents typically stay for a few weeks or months before returning home or moving on.
46% of new residents, usually for short-term rehab.
36% of new residents, often for short stays.
19% of new residents, often for long-term daily care.
Key information about the people who lead and staff this community.
In Illinois, the Department of Public Health, Office of Health Care Regulation conducts annual unannounced surveys to assess compliance with state and federal healthcare facility standards.
4 visits/inspections triggered by complaints
2 routine inspections
8 with issues
1 without issues
Deficiencies indicate regulatory issues. A higher number implies the facility had several areas requiring improvement.
Illinois average: 7 deficiencies
Illinois average 10.4
Last Health inspection on Jan 2025
Illinois average 36.8
Illinois average 3.68
Health citations are formal notices following inspections when they fail to comply with safety and care standards.
21 of 27 citations resulted from standard inspections; and 6 of 27 resulted from complaint investigations.
Illinois average: 0.7
Illinois average: 3.6
Data sourced from CMS Health Deficiencies reports. Citation severity codes range from A (least serious) to L (most serious). Immediate Jeopardy (J-L) citations indicate situations where the facility's noncompliance has placed residents at risk of death or serious harm.
Nursing Home Licensed facility providing 24/7 skilled nursing care for residents with complex, ongoing medical needs. Staffed by RNs, LPNs, and CNAs. Inspected and star-rated annually by CMS. Accepts Medicare (short-term rehab) and Medicaid (long-term care).
Assisted Living A licensed, long-term care setting for seniors or individuals with disabilities who need help with daily activities — like bathing, dressing, and medication management — but not 24-hour skilled nursing. Offers housing, meals, and around-the-clock support while aiming to maximize resident independence.
![]() 1.3 miles from city center — 6.48 miles to nearest hospital (Endeavor Health Northwest Community Hospital)
1.3 miles from city center — 6.48 miles to nearest hospital (Endeavor Health Northwest Community Hospital)
Add your location
This data corresponds to Q2 2025 and is based on CMS Payroll-Based Journal.
Illinois average ratio: 1.90:1
Illinois average: 7.6 hours
Manages medical care and health needs.
This role is partially covered by contractors.
Assists with medical care and medications.
This role is partially covered by contractors.
Helps with daily care and mobility.
This role is partially covered by contractors.
Total hours from contractors
14,777 contractor hours this quarter
| Certified Nursing Assistant | 51 | 197 | 248 | 27,218 | 91 | 100% | 7.9 |
| Licensed Practical Nurse | 21 | 24 | 45 | 8,871 | 91 | 100% | 7.8 |
| Registered Nurse | 19 | 57 | 76 | 7,769 | 91 | 100% | 8 |
| Clinical Nurse Specialist | 5 | 0 | 5 | 3,010 | 91 | 100% | 8.1 |
| Other Dietary Services Staff | 7 | 0 | 7 | 2,320 | 91 | 100% | 7.5 |
| Speech Language Pathologist | 0 | 4 | 4 | 1,709 | 85 | 93% | 7 |
| Physical Therapy Aide | 0 | 3 | 3 | 1,066 | 75 | 82% | 7.7 |
| Physical Therapy Assistant | 0 | 3 | 3 | 931 | 76 | 84% | 7.5 |
| Respiratory Therapy Technician | 0 | 5 | 5 | 928 | 82 | 90% | 6.2 |
| RN Director of Nursing | 3 | 0 | 3 | 902 | 89 | 98% | 6.8 |
| Dental Services Staff | 2 | 0 | 2 | 809 | 89 | 98% | 5.6 |
| Dietitian | 1 | 0 | 1 | 511 | 63 | 69% | 8.1 |
| Administrator | 1 | 0 | 1 | 504 | 89 | 98% | 5.7 |
| Nurse Practitioner | 2 | 0 | 2 | 494 | 89 | 98% | 5.5 |
| Mental Health Service Worker | 1 | 0 | 1 | 488 | 87 | 96% | 5.6 |
| Qualified Social Worker | 0 | 2 | 2 | 396 | 55 | 60% | 7.2 |
Source: CMS Long-Term Care Facility Characteristics (Data as of Jan 2026)
Residents meet regularly to discuss policies, care quality, and activities
Family members meet regularly to discuss policies, care quality, and activities
Organized group of family members that meets regularly to discuss facility policies, resident care, and activities.
Organized group of residents that meets regularly to discuss facility policies, quality of life, and activities.
Data sourced from CMS Long-Term Care Facility Characteristics quarterly report. Payer mix reflects the current resident census by primary payment source.
These measures show how residents usually do over time at this home, based on health outcomes and preventive care.
Illinois average: 9.7
Illinois average: 18.6
Illinois average: 15.5%
Illinois average: 18.4%
Illinois average: 21.6%
Illinois average: 3.4%
Illinois average: 5.3%
Illinois average: 1.8%
Illinois average: 6.5%
Illinois average: 48.1%
Illinois average: 20.2%
Illinois average: 89.2%
Illinois average: 91.6%
Illinois average: 2.05
Illinois average: 2.25
Illinois average: 68.3%
Illinois average: 2.3%
Illinois average: 63.0%
Illinois average: 26.2%
Illinois average: 14.0%
Illinois average: 0.8%
Illinois average: 53.7%
Illinois average: 50.6%
Quality measures are calculated from Minimum Data Set (MDS) assessments. For most measures, lower percentages indicate better care quality.
Historical financial and operational data for Avantara Long Grove based on CMS SNF Cost Reports.
Loading trend charts...
Care Cost Calculator: See Prices in Your Area
Nursing Home Data Explorer
Don’t Wait Too Long: 7 Red Flag Signs Your Parent Needs Assisted Living Now
The True Cost of Assisted Living in 2025 – And How Families Are Paying For It
Understanding Senior Living Costs: Pricing Models, Discounts & Financial Assistance

Touring a community? Use this expert-backed checklist to stay organized, ask the right questions, and find the perfect fit.
We'll send you a PDF version of the touring checklist.