Avantara Mountain View
CMS overall rating Info CMS (the Centers for Medicare & Medicaid Services) is the federal agency that rates nursing home quality. Its Overall Rating runs from 1 to 5 stars, combining health inspections, staffing, and quality measures, with inspections weighted most heavily.

Avantara Mountain View

CMS overall rating Info CMS (the Centers for Medicare & Medicaid Services) is the federal agency that rates nursing home quality. Its Overall Rating runs from 1 to 5 stars, combining health inspections, staffing, and quality measures, with inspections weighted most heavily.
Calculator: See prices in your area
Avantara Mountain View accepts Medicare, Medicaid, and private pay.

Overview of Avantara Mountain View

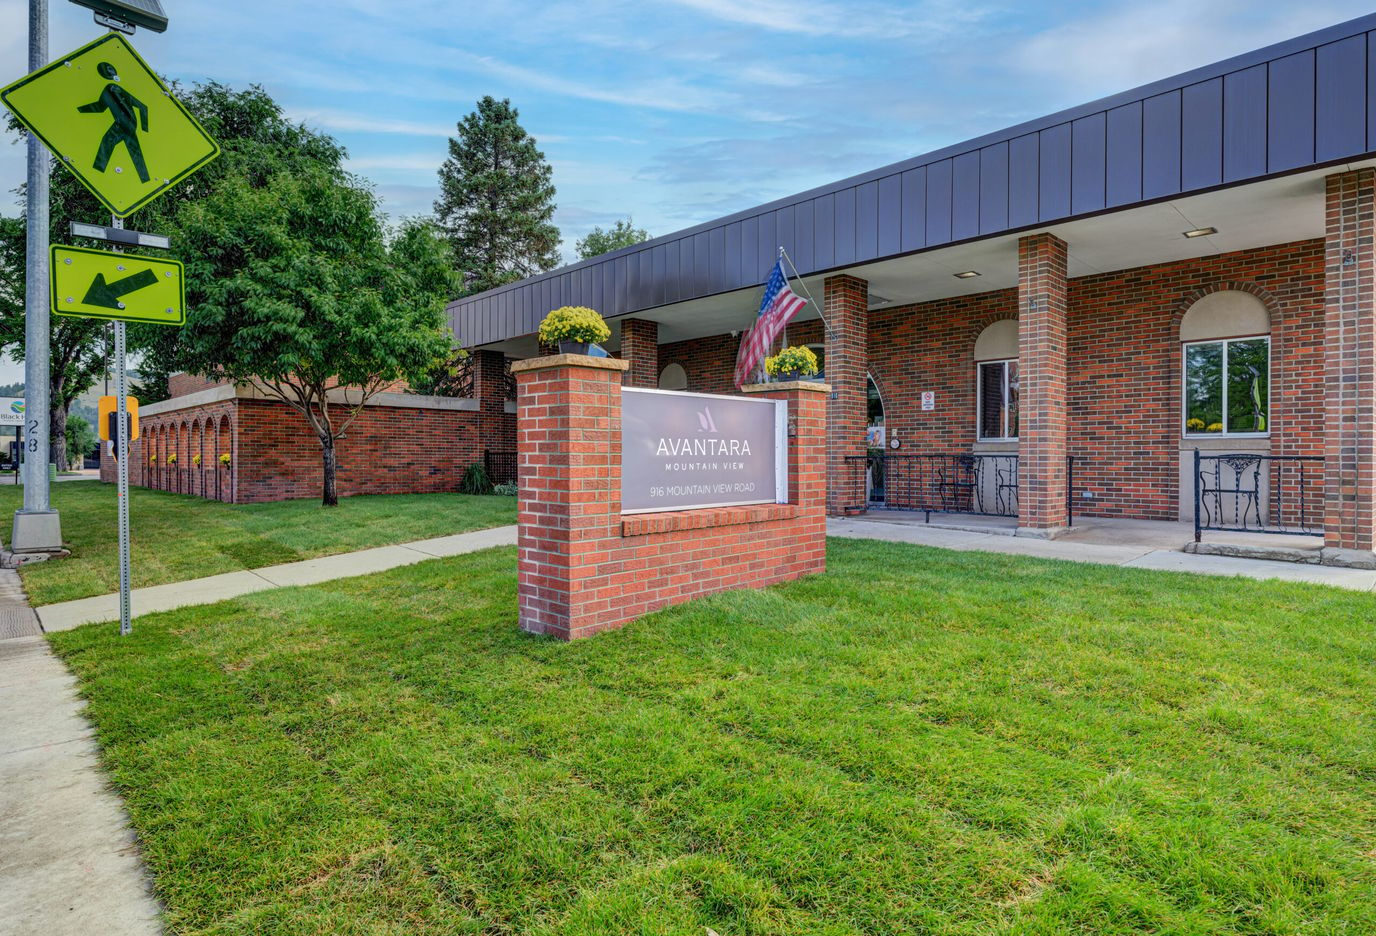
Avantara Mountain View is a nursing home in Rapid City, South Dakota, offering skilled nursing and post-acute rehabilitation. Privately operated by Mountain View SD Skilled Nursing Facility, LLC, this 95-bed community is currently operating at 81% occupancy rate, which is similar to the state average and reflects local demand.

Operating under federal CMS guidelines and South Dakota state licensure, the community features a robust multi-disciplinary care framework. The clinical support specializes in high-acuity post-surgical care, stroke and neurological recovery, cardiac rehabilitation, and orthopedic stabilization. A defining structural strength of the community is its physical therapy staffing ratio, which tracks 33% above the South Dakota state average. While average nursing hours sit slightly below state benchmarks at 3 hours and 25 minutes per resident daily, the overall care matrix successfully minimizes long-stay risks, achieving a major injury fall rate that is 66% lower than the state average and maintaining exceptionally low indicators for resident depressive symptoms.

The community consistently maintains an above-average performance track, with a 3-star overall CMS rating, where quality measures and health inspection scores outperform the state average. In its past inspection cycles, a localized cluster of moderate citations tied to routine pharmacy services and infection control protocols has been identified, which resulted in a single minor federal fine in mid-2024 that is 77% below regional averages. However, all findings were systematically resolved under approved plans of correction.

Positioned in a well-established neighborhood pocket, the community achieves a walk score of 83, ranking eighth highest among similar communities statewide, giving visiting families and ambulatory residents excellent pedestrian access to local pharmacies, retail centers, and restaurants.

Avantara Mountain View’s unique combination of high physical therapy concentration, strong short-term rehabilitation metrics, and an exceptionally walkable urban location makes it a practical option for post-hospitalization care in Rapid City and the broader Black Hills.

(605) 343-8577

Quality ratings

Measured by Centers for Medicare & Medicaid Services (CMS)

Overall rating Info The Overall CMS Rating combines results from health inspections, staffing levels and quality measures. Health inspections carry the most weight. Staffing and quality scores can increase or decrease the final rating based on performance compared to state and national standards.
▲ 10.5% Above SD avg. ▲ 10.5% Above SD avg.SD average: 2.7Click the badge to see the full State ranking.Click here to see the full State ranking.
Health Inspection Info Based on the results of the facility's three most recent standard inspections and any complaint investigations. CMS reviews the number, scope, and severity of deficiencies, with more recent findings weighted more heavily.
▲ 10.9% Above SD avg. ▲ 10.9% Above SD avg.SD average: 2.7Click the badge to see the full State ranking.Click here to see the full State ranking.
Staffing Info Measures average nursing staff hours per resident per day, including Registered Nurses (RNs) and total nursing staff. Ratings are adjusted based on the level of care residents require and are compared to state and national benchmarks.
▲ 20.6% Above SD avg. ▲ 20.6% Above SD avg.SD average: 3.3Click the badge to see the full State ranking.Click here to see the full State ranking.
Quality Measures Info Based on clinical and physical health indicators reported to CMS, such as hospital readmissions, falls, pressure ulcers, and improvements in mobility. These measures reflect how well residents' health needs are being managed.
▲ 10.0% Above SD avg. ▲ 10.0% Above SD avg.SD average: 2.7Click the badge to see the full State ranking.Click here to see the full State ranking.

Staffing hours breakdown

Info Daily nursing hours per resident by staff type, reported to CMS. Higher is generally better — compare this facility to state and national averages to see where staffing stands.

Hours per resident per day — compared to South Dakota state averages

Total nursing care / resident Info This home is ranked 44th out of 65 homes in South Dakota for nurse hours. Total adjusted nursing hours per resident per day, combining RN, LPN, and aide time. CMS adjusts this for case-mix so facilities can be fairly compared.
3h 25m per day
Rank #44 / 65Nurse hours — State benchmarkedThis home is ranked 44th out of 65 homes in South Dakota. Shows adjusted nurse hours per resident per day benchmarked to the South Dakota average, with a ranking across 65 South Dakota facilities. More hours mean more direct care. The national average is about 3.5 hrs; below 3.0 is a red flag.Ranking totals vary by category as each rank only includes facilities that report data for that metric. Homes missing that data point aren't included in the ranking.Click the rank badge to see the full State ranking.Click here to see the full State ranking.
This facility South Dakota avg (4h 20m per day)
vs South Dakota avg
-21%

2 of 6 metrics below state avg

Standout metric Physical Therapist is +17% above state avg
Staff typeHours / Day / Residentvs state avg
Registered Nurse (RN) Info RNs hold the highest nursing license and can assess residents, interpret test results, and direct care plans. More RN hours per day often signals stronger clinical oversight and faster response to health changes. 48m per day ■ Avg State avg: 48m per day · National avg: 41m per day
LPN / LVN Info Licensed Practical Nurses (LPNs) or Licensed Vocational Nurses (LVNs) deliver routine hands-on care — medication administration, wound dressing, and monitoring vital signs. They work under RN supervision and make up a large share of daily bedside care. 31m per day ▲ 8% State avg: 29m per day · National avg: 52m per day
Nurse Aide Info Certified Nurse Aides (CNAs) provide the most direct day-to-day assistance: bathing, dressing, feeding, and mobility. Nurse aide hours are typically the largest staffing category and directly affect residents' quality of life. 2h 32m per day ▼ 3% State avg: 2h 37m per day · National avg: 2h 20m per day
Weekend Total Nursing Info Combined nursing hours (RN + LPN + Nurse Aide) per resident per day on weekends. Staffing often drops on weekends — this figure reveals whether the facility maintains adequate coverage outside of weekday hours. 3h 21m per day ■ Avg State avg: 3h 19m per day · National avg: 3h 26m per day
Physical Therapist Info Hours per resident per day provided by licensed Physical Therapists (PTs) or PT Assistants. PT services help residents recover mobility after injury or illness and are especially important for post-acute (short-stay) rehabilitation. 4m per day ▲ 17% State avg: 3m per day · National avg: 4m per day
Weekend RN Info Registered nurse hours specifically on weekends. Facilities sometimes reduce RN presence on Saturdays and Sundays — a low weekend RN figure compared to weekday hours can indicate reduced clinical oversight when most administrative staff are absent. 28m per day ▼ 8% State avg: 31m per day · National avg: 28m per day

Capacity and availability

Avg. Length of Stay
129 days
Bed community size
95-bed community Rank #25 / 117Bed count — State benchmarkedThis home is ranked 25th out of 117 homes in South Dakota. Shows this facility's certified or reported bed count compared to other South Dakota facilities. Larger communities may offer more amenities, programs, and on-site services for residents and families.Ranking totals vary by category as each rank only includes facilities that report data for that metric. Homes missing that data point aren't included in the ranking.Click the rank badge to see the full State ranking.Click here to see the full State ranking.
A larger shared setting that may offer more common spaces and organized community services.
Walk Score
Walk Score: 83 / 100 Rank #8 / 159Walk Score — State benchmarkedThis home is ranked 8th out of 159 homes in South Dakota. Shows how walkable this facility's neighborhood is compared to the average Walk Score across South Dakota facilities. Higher scores benefit residents, families, and staff.Ranking totals vary by category as each rank only includes facilities that report data for that metric. Homes missing that data point aren't included in the ranking.Click the rank badge to see the full State ranking.Click here to see the full State ranking.
Very walkable. Most errands can be accomplished on foot, and many essentials are within a short walk.

About this community

Occupancy

Occupancy rate
81%
Rank #34 / 62Occupancy rate — State benchmarkedThis home is ranked 34th out of 62 homes in South Dakota. Shows this facility's occupancy rate versus the South Dakota average, with its Statewide rank out of 62. Higher occupancy signals strong local demand and financial stability.Ranking totals vary by category as each rank only includes facilities that report data for that metric. Homes missing that data point aren't included in the ranking.Click the rank badge to see the full State ranking.Click here to see the full State ranking.
Similar to the South Dakota average: 79.9%
Occupied beds
77 / 95
Average occupied beds in South Dakota homes 51 beds

License Details

Facility TypeNursing Home
StatusActive
IssuanceJuly 1, 2025
ExpirationJune 30, 2026
CountyPennington
License Number10669
CMS Certification Number435040

Ownership & Operating Entity

Avantara Mountain View is administrated by Laura Karlson.

Therapy & Rehabilitation

2 services
Rehabilitation Services
Short-Term Rehab

Amenities & Lifestyle

Specific ProgramsPost-Surgical Care, Stroke & Other Neurological Conditions, Cardiac Care, Oncology Recovery Care, Orthopedic Rehabilitation, Pulmonary Care

Contact Avantara Mountain View

Inspection History

In South Dakota, the Department of Health, Office of Health Care Facilities Licensure is the state agency responsible for conducting unannounced surveys and monitoring facility quality.

Since 2022 · 4 years of data 16 deficiencies 4 inspections

Inspection Scorecard Info This scorecard compares key inspection, citation, and complaint metrics at this facility against the South Dakota state average. Metrics rated ≥15% worse than average are highlighted in red; those ≥15% better are highlighted in green.

Since 2022 vs. South Dakota state average
Overall vs. SD average 1 Worse Metrics worse than South Dakota average:
• Deficiencies per inspection (25% above)
3 Better Metrics better than South Dakota average:
• Total deficiencies (16% below)
• Deficiencies per year (17% below)
• Total inspections (33% below)
Latest Inspection December 12, 2024 Routine

Deficiencies Info Deficiencies are formal regulatory issues recorded during state inspections.

This FacilitySD Averagevs. SD Avg
Total deficiencies Info Formal regulatory issues recorded by inspectors across all inspection types. 1619 This facility has 16% fewer total deficiencies than a typical South Dakota nursing home (16 vs. SD avg 19).↓ 16% better
Deficiencies per year Info Average deficiencies per year since 2022. 44.8 This facility has 17% fewer deficiencies per year than a typical South Dakota nursing home (4 vs. SD avg 4.8).↓ 17% better
Deficiencies per inspection Info Average deficiencies per inspection. 43.2 This facility has 25% more deficiencies per inspection than a typical South Dakota nursing home (4 vs. SD avg 3.2).↑ 25% worse

Inspections Info State inspections evaluate whether the facility meets health and safety standards.

This FacilitySD Averagevs. SD Avg
Total inspections Info Combined count of all routine and focused inspections. Excludes complaint investigations. 46 This facility has 33% fewer total inspections than a typical South Dakota nursing home (4 vs. SD avg 6).↓ 33% better

Health Inspection History

Inspections since 2022
Total health inspections 4

South Dakota average 4.5


Last Health inspection on Dec 2024

Total health citations
16 Rank #32 / 67Health citations — State benchmarkedThis home is ranked 32nd out of 67 homes in South Dakota. Shows this facility's total health deficiency citations benchmarked to the South Dakota State average, with a ranking across all 67 SD facilities. Lower citation counts earn a better rank.Ranking totals vary by category as each rank only includes facilities that report data for that metric. Homes missing that data point aren't included in the ranking.Click the rank badge to see the full State ranking.Click here to see the full State ranking.

South Dakota average 14.8

Citations per inspection
4 Rank #45 / 67Citations per inspection — State benchmarkedThis home is ranked 45th out of 67 homes in South Dakota. Shows average deficiency citations per CMS inspection for this facility versus the South Dakota mean across 67 facilities with citation data. Lower is better.Ranking totals vary by category as each rank only includes facilities that report data for that metric. Homes missing that data point aren't included in the ranking.Click the rank badge to see the full State ranking.Click here to see the full State ranking.

South Dakota average 3.34


Health citations are formal notices following inspections when they fail to comply with safety and care standards.

14 of 16 citations resulted from standard inspections; and 2 of 16 resulted from complaint investigations.

Breakdown of citation severity (last 4 years)
Critical health citations
0
100% better than South Dakota average

South Dakota average: 0.3


Serious health citations
2
11% worse than South Dakota average

South Dakota average: 1.8

0 critical citations South Dakota average: 0.3

2 serious citations South Dakota average: 1.8

14 moderate citations South Dakota average: 12.6

0 minor citations South Dakota average: 0
Citations history (last 4 years)
Infection Control moderate citation Dec 12, 2024
Corrected

Infection Control moderate citation Dec 12, 2024
Corrected

Pharmacy moderate citation Dec 12, 2024
Corrected

Pharmacy moderate citation Dec 12, 2024
Corrected

Staffing Data

Reporting period: October 1 – December 31, 2025 (Q4 2025). Source: CMS Payroll-Based Journal report.

Total staff 137
Employees 124
Contractors 13
Staff to resident ratio 1.67 : 1
13% fewer staff per resident than South Dakota average
South Dakota average ratio: 1.93 : 1 South Dakota average ratio: 1.93 : 1See full South Dakota ranking
Avg staff/day 50
Average shift 7.8 hours
0% compared with South Dakota average
South Dakota average: 7.7 hours South Dakota average shift: 7.7 hoursSee full South Dakota ranking
Total staff hours (quarter) 35,810

Nursing staff breakdown

Q4 2025 · Oct 1 – Dec 31 More info This data comes from the CMS Payroll-Based Journal report covering October 1 – December 31, 2025.
Registered Nurse

Manages medical care and health needs.

RN Staff Info All 13 RN Staff are full-time employees. No contractors work on this role. 13
Average shift length Info Average shift length. Calculated as total hours divided by days worked and average staff per day. 9.2 hours
Licensed Practical Nurse

Assists with medical care and medications.

LPN Staff Info All 10 LPN Staff are full-time employees. No contractors work on this role. 10
Average shift length Info Average shift length. Calculated as total hours divided by days worked and average staff per day. 9.6 hours
Certified Nursing Assistant

Helps with daily care and mobility.

CNA Staff Info All 72 CNA Staff are full-time employees. No contractors work on this role. 72
Average shift length Info Average shift length. Calculated as total hours divided by days worked and average staff per day. 7.3 hours

Contractor staffing

Q4 2025 · Oct 1 – Dec 31 More info This data comes from the CMS Payroll-Based Journal report covering October 1 – December 31, 2025.

Total hours from contractors

5.5%

1,957 contractor hours this quarter

Physical Therapy Aide: 5 Physical Therapy Assistant: 3 Qualified Social Worker: 3 Respiratory Therapy Technician: 1 Speech Language Pathologist: 1

Staff by category

Q4 2025 · Oct 1 – Dec 31 More info This data comes from the CMS Payroll-Based Journal report covering October 1 – December 31, 2025.
Certified Nursing Assistant7207217,19892100%7.3
Registered Nurse130134,66892100%9.2
Licensed Practical Nurse100103,64792100%9.6
Medication Aide/Technician110113,06692100%7.8
Clinical Nurse Specialist7071,2556470%7.7
Other Dietary Services Staff3031,0328087%7.7
RN Director of Nursing2025486065%7.9
Administrator1015126470%8
Dietitian1014976368%7.9
Mental Health Service Worker1014936267%8
Speech Language Pathologist0114756672%7.2
Dental Services Staff1014726065%7.9
Respiratory Therapy Technician0114695964%8
Nurse Practitioner2024656166%7.6
Physical Therapy Assistant0334155661%7.4
Physical Therapy Aide0553235661%5
Qualified Social Worker0332756368%4.1
72 Certified Nursing Assistant
% of Days 100%
13 Registered Nurse
% of Days 100%
10 Licensed Practical Nurse
% of Days 100%
11 Medication Aide/Technician
% of Days 100%
7 Clinical Nurse Specialist
% of Days 70%
3 Other Dietary Services Staff
% of Days 87%
2 RN Director of Nursing
% of Days 65%
1 Administrator
% of Days 70%
1 Dietitian
% of Days 68%
1 Mental Health Service Worker
% of Days 67%
1 Speech Language Pathologist
% of Days 72%
1 Dental Services Staff
% of Days 65%
1 Respiratory Therapy Technician
% of Days 64%
2 Nurse Practitioner
% of Days 66%
3 Physical Therapy Assistant
% of Days 61%
5 Physical Therapy Aide
% of Days 61%
3 Qualified Social Worker
% of Days 68%

Penalties and fines

Includes penalties issued in 2024

Federal penalties imposed by CMS for regulatory violations, including civil money penalties (fines) and denials of payment for new Medicare/Medicaid admissions.

Source: CMS Penalties Database (Data as of Jan 2026)

Total fines amount $9K Rank #20 / 67Federal fines — State benchmarkedThis home is ranked 20th out of 67 homes in South Dakota. Shows this facility's cumulative CMS federal fine dollars versus the South Dakota average among facilities with fines, and where it ranks among 67 facilities in the pool. Lower total dollars mean a better rank.Ranking totals vary by category as each rank only includes facilities that report data for that metric. Homes missing that data point aren't included in the ranking.Click the rank badge to see the full State ranking.Click here to see the full State ranking.
77% lower than South Dakota average

South Dakota average: $40K

Number of fines 1
51% fewer fines than South Dakota average

South Dakota average: 2.0

Payment Denials Info Serious action where Medicare and/or Medicaid temporarily stops payments for new residents until issues are fixed. 0
In line with South Dakota average

South Dakota average: 0.0

Fines amount comparison
This facility $9K
South Dakota average $40K
Penalty History

Penalties are imposed by CMS for violations of federal nursing home regulations.

1 penalty in the past 3 years

May 15, 2024 · $9K

Civil Money Penalty Info Fines imposed for noncompliance, which can be assessed per day or per instance of violation. May 15, 2024
$9K

Last updated: Jan 2026

Quality of care over time

These measures show how residents usually do over time at this home, based on health outcomes and preventive care.

High-risk clinical events score Info A composite score based on pressure ulcers, falls with injury, weight loss, walking ability decline, and activities of daily living decline. 8.3
31% better than South Dakota average

South Dakota average: 12.0

Functional decline score Info A composite score based on activities of daily living decline, walking ability decline, and incontinence. 20.1
16% better than South Dakota average

South Dakota average: 23.9

Long-stay resident measures
Average South Dakota avg: 2.6 Info CMS star rating based on long-stay quality measure performance. 5 stars = significantly above average, 1 star = significantly below average.
Need for Help with Daily Activities Increased Info Percent of long-stay residents whose need for help with daily activities has increased 16.6%
26% better than South Dakota average

South Dakota average: 22.3%

Walking Ability Worsened Info Percent of long-stay residents whose ability to move independently worsened 17.6%
23% better than South Dakota average

South Dakota average: 22.8%

Low Risk Residents with Bowel/Bladder Incontinence Info Percent of low risk long-stay residents who lose control of their bowels or bladder 26.0%
In line with South Dakota average

South Dakota average: 26.7%

Falls with Major Injury Info Percent of long-stay residents experiencing one or more falls with major injury 1.7%
66% better than South Dakota average

South Dakota average: 5.0%

High Risk Residents with Pressure Ulcers Info Percent of long-stay high risk residents with pressure ulcers 3.4%
25% better than South Dakota average

South Dakota average: 4.5%

Urinary Tract Infection Info Percent of long-stay residents with a urinary tract infection 8.8%
154% worse than South Dakota average

South Dakota average: 3.5%

Lost Too Much Weight Info Percent of long-stay residents who lose too much weight 2.4%
56% better than South Dakota average

South Dakota average: 5.5%

Depressive Symptoms Info Percent of long-stay residents who have depressive symptoms 1.1%
73% better than South Dakota average

South Dakota average: 4.1%

Antipsychotic Use Info Percent of long-stay residents who received an antipsychotic medication 24.1%
In line with South Dakota average

South Dakota average: 24.4%

Pneumococcal Vaccine Info Percent of long-stay residents assessed and appropriately given the pneumococcal vaccine 71.9%
25% worse than South Dakota average

South Dakota average: 95.7%

Influenza Vaccine Info Percent of long-stay residents assessed and appropriately given the seasonal influenza vaccine 97.5%
In line with South Dakota average

South Dakota average: 96.9%

Hospitalizations per 1,000 days Info Number of hospitalizations per 1,000 long-stay resident days. 1.76
17% worse than South Dakota average

South Dakota average: 1.51

ED visits per 1,000 days Info Number of outpatient emergency department visits per 1,000 long-stay resident days. 1.08
42% better than South Dakota average

South Dakota average: 1.85

Short-stay resident measures
Average South Dakota avg: 2.6 Info CMS star rating based on short-stay quality measure performance. 5 stars = much above average, 1 star = much below average.
Pneumococcal Vaccine Info Percent of short-stay residents assessed and appropriately given the pneumococcal vaccine 40.5%
52% worse than South Dakota average

South Dakota average: 84.4%

Antipsychotic medication increase Info Percent of short-stay residents who newly received an antipsychotic medication 2.1%
17% worse than South Dakota average

South Dakota average: 1.8%

Influenza Vaccine Info Percent of short-stay residents assessed and appropriately given the seasonal influenza vaccine 14.9%
81% worse than South Dakota average

South Dakota average: 78.2%

Re-hospitalized after SNF stay Info Percentage of short-stay residents who were re-hospitalized after their nursing home admission. 20.5%
5% better than South Dakota average

South Dakota average: 21.5%

Emergency department visits Info Percentage of short-stay residents who had an outpatient emergency department visit. 11.1%
5% better than South Dakota average

South Dakota average: 11.7%

Falls with major injury Info Percentage of SNF residents who experience falls with major injury during their stay. 1.0%
25% worse than South Dakota average

South Dakota average: 0.8%

Ability to care for self at discharge Info Percentage of residents at or above expected ability to care for themselves at discharge. 50.7%
6% worse than South Dakota average

South Dakota average: 53.7%

Successful return to home or community Info Rate of successful return to home or community from a skilled nursing facility. 54.0%
7% better than South Dakota average

South Dakota average: 50.6%

Breakdown by payment type

Medicare

59% of new residents, usually for short-term rehab.

Typical stay 1 - 2 months

Private pay

25% of new residents, often for short stays.

Typical stay 4 - 5 months

Medicaid

17% of new residents, often for long-term daily care.

Typical stay 1 years

Facility Characteristics

Source: CMS Long-Term Care Facility Characteristics (Data as of Jan 2026)

Total residents 82
Medicare
11
13.4% of residents
Medicaid
51
62.2% of residents
Private pay or other
20
24.4% of residents
Programs & Services
Residents Group

Residents meet regularly to discuss policies, care quality, and activities

Family Member Group

Family members meet regularly to discuss policies, care quality, and activities

Nurse Aide Training

State-approved Nurse Aide Training and Competency Evaluation Program on-site

Active Family Council

Organized group of family members that meets regularly to discuss facility policies, resident care, and activities.

Active Resident Council

Organized group of residents that meets regularly to discuss facility policies, quality of life, and activities.

Finances and operations

Based on CMS SNF Cost Report for fiscal year ending in 12/2023.

Privately-owned community
Operated by a single business entity.
Net patient revenue Info Net patient revenue — what the home actually collects for resident care, after contractual allowances, bad debt and discounts are subtracted from its gross charges (CMS cost report, Worksheet G-3). It covers resident care only; money the home earns from other sources is shown separately as "Other income."
$9.5M
Net patient income Info Net patient income: net patient revenue minus the home's total operating expenses. A positive figure means it earns more from resident care than it spends to deliver it; a negative figure means the opposite. It excludes non-operating "other income."
$178.9K
Privately-owned community Operated by a single business entity.
Net patient revenue Info Net patient revenue — what the home actually collects for resident care, after contractual allowances, bad debt and discounts are subtracted from its gross charges (CMS cost report, Worksheet G-3). It covers resident care only; money the home earns from other sources is shown separately as "Other income."
$9.5M Rank #11 / 63Revenue — State benchmarkedThis home is ranked 11th out of 63 homes in South Dakota. Shows this facility's annual revenue compared to the South Dakota average. Higher revenue generally means more resources for staffing and capital — read alongside Payroll %.Ranking totals vary by category as each rank only includes facilities that report data for that metric. Homes missing that data point aren't included in the ranking.Click the rank badge to see the full State ranking.Click here to see the full State ranking.
Net patient income Info Net patient income: net patient revenue minus the home's total operating expenses. A positive figure means it earns more from resident care than it spends to deliver it; a negative figure means the opposite. It excludes non-operating "other income."
$178.9K
Other income Info Money the home earns outside of resident care — such as investments, grants, rentals and other non-operating sources (CMS cost report, Worksheet G-3). It is tracked separately from net patient revenue: it is not part of that figure, and it is not included in net patient income.
$890
Payroll costs Info Staff salaries plus wage-related costs — benefits such as payroll taxes, health insurance and retirement — from the home's own accounting records (CMS cost report, Worksheet A). Contract or agency labor is counted separately, under other operating costs. Rank #14 / 63Payroll — State benchmarkedThis home is ranked 14th out of 63 homes in South Dakota. Shows total annual staff payroll benchmarked to the South Dakota average. Higher payroll investment relative to peers often signals better staffing and less reliance on cheaper contract labor.Ranking totals vary by category as each rank only includes facilities that report data for that metric. Homes missing that data point aren't included in the ranking.Click the rank badge to see the full State ranking.Click here to see the full State ranking.
$5.2M 54.7% of net patient revenue Info Payroll as a share of revenue: staff salaries and wage-related benefits divided by net patient revenue. A higher figure means more of each revenue dollar goes to staff pay. Rank #50 / 63Payroll % — State benchmarkedThis home is ranked 50th out of 63 homes in South Dakota. Shows payroll as a percentage of revenue versus the South Dakota average. Well-run South Dakota facilities typically land around 64–73% — the top third Statewide. Below 25% may signal understaffing or heavy agency use — read with Staffing ratings.Ranking totals vary by category as each rank only includes facilities that report data for that metric. Homes missing that data point aren't included in the ranking.Click the rank badge to see the full State ranking.Click here to see the full State ranking.
Other operating costs Info Everything it costs to run the home apart from payroll — food, utilities, supplies, maintenance, contract labor and administration. Calculated as total operating expense minus payroll (staff salaries and wage-related benefits).
$4.1M
Total costs Info The home's total operating expense for the year — all the costs of running it, salaries included (CMS cost report, Worksheet G-3).
$9.3M

Who this home usually serves

TYPE OF STAY

Mostly short-term rehab stays

Most residents typically stay for a few weeks or months before returning home or moving on.

Most new residents arrive under Medicare (59% of admissions), and a typical Medicare stay runs around 1 - 2 months.

Admissions
218 total

Coverage residents most often arrive under.

Medicare 59%
Private pay 25%
Medicaid 17%
Discharges
231 total

Coverage residents most often leave under.

Medicare 35%
Private pay 28%
Medicaid 38%

Places of interest near Avantara Mountain View

Address 1085.9 miles from city center Info Estimated distance in miles from Rapid City's city center to Avantara Mountain View's address, calculated via Google Maps.

Calculate Travel Distance to Avantara Mountain View

Add your location

Address

Compare Nursing Home around Rapid City

The information below is reported by the South Dakota Department of Health, Office of Health Care Facilities Licensure.

5 facilities compared · CMS & SD Dept. of Health data

Westhills Village
NH
AL
HC
IL
NC
PC
Rapid City (Texas Street)
44
Facility 44
SD AVG 69
Rank #90 / 117
100.0%
Facility 100.0%
SD AVG 79.9%
Rank #1 / 62
+25%
4.59
Facility 4.59
SD AVG 4.34
Rank #14 / 65
+31%+6%
$13.5k
Facility $13.5k
SD AVG $38.5k
Rank #28 / 67
9
Facility 9
SD AVG 14.8
Rank #17 / 67
3.0
Facility 3.0
SD AVG 3.3
Rank #28 / 67
141-
21
Facility 21
SD AVG 39
Rank #111 / 159
Bradley Archer
$6.7M
Facility $6.7M
SD AVG $6.7M
Rank #2 / 63
$8.6M
Facility $8.6M
SD AVG $2.6M
Rank #6 / 63
128.7%
Facility 128.7%
SD AVG 40.8%
Rank #62 / 63
435033
Avantara Mountain View
NH
Rapid City
95
Facility 95
SD AVG 69
Rank #25 / 117
80.9%
Facility 80.9%
SD AVG 79.9%
Rank #34 / 62
+1%
3.41
Facility 3.41
SD AVG 4.34
Rank #44 / 65
-15%-21%
$9.3k
Facility $9.3k
SD AVG $38.5k
Rank #20 / 67
16
Facility 16
SD AVG 14.8
Rank #32 / 67
4.0
Facility 4.0
SD AVG 3.3
Rank #45 / 67
287-
83
Facility 83
SD AVG 39
Rank #8 / 159
-
$9.5M
Facility $9.5M
SD AVG $6.7M
Rank #11 / 63
$5.2M
Facility $5.2M
SD AVG $2.6M
Rank #14 / 63
54.7%
Facility 54.7%
SD AVG 40.8%
Rank #50 / 63
435040
Fountain Springs Healthcare Center
NH
AL
IL
Rapid City
10
Facility 10
SD AVG 69
Rank #116 / 117
87.3%
Facility 87.3%
SD AVG 79.9%
Rank #24 / 62
+9%
3.82
Facility 3.82
SD AVG 4.34
Rank #33 / 65
-2%-12%
$22.5k
Facility $22.5k
SD AVG $38.5k
Rank #40 / 67
11
Facility 11
SD AVG 14.8
Rank #21 / 67
1.6
Facility 1.6
SD AVG 3.3
Rank #12 / 67
282-
16
Facility 16
SD AVG 39
Rank #120 / 159
-
$6.8M
Facility $6.8M
SD AVG $6.7M
Rank #26 / 63
$3.1M
Facility $3.1M
SD AVG $2.6M
Rank #27 / 63
45.6%
Facility 45.6%
SD AVG 40.8%
Rank #31 / 63
435110
Avantara North
NH
HC
MC
Rapid City (North 7Th Street)
68
Facility 68
SD AVG 69
Rank #45 / 117
87.3%
Facility 87.3%
SD AVG 79.9%
Rank #24 / 62
+9%
3.12
Facility 3.12
SD AVG 4.34
Rank #56 / 65
+43%-28%
$33.8k
Facility $33.8k
SD AVG $38.5k
Rank #45 / 67
20
Facility 20
SD AVG 14.8
Rank #41 / 67
4.0
Facility 4.0
SD AVG 3.3
Rank #45 / 67
267-
39
Facility 39
SD AVG 39
Rank #77 / 159
-
$7.1M
Facility $7.1M
SD AVG $6.7M
Rank #20 / 63
$3.8M
Facility $3.8M
SD AVG $2.6M
Rank #25 / 63
53.3%
Facility 53.3%
SD AVG 40.8%
Rank #48 / 63
435064
Avantara Arrowhead
NH
HC
Rapid City (Broadmoor Subdivision)
68
Facility 68
SD AVG 69
Rank #45 / 117
75.2%
Facility 75.2%
SD AVG 79.9%
Rank #42 / 62
-6%
2.80
Facility 2.80
SD AVG 4.34
Rank #61 / 65
+68%-36%
$105.9k
Facility $105.9k
SD AVG $38.5k
Rank #62 / 67
34
Facility 34
SD AVG 14.8
Rank #61 / 67
3.8
Facility 3.8
SD AVG 3.3
Rank #43 / 67
961-
12
Facility 12
SD AVG 39
Rank #127 / 159
Philip Preston
$6.6M
Facility $6.6M
SD AVG $6.7M
Rank #25 / 63
$3.4M
Facility $3.4M
SD AVG $2.6M
Rank #24 / 63
52.6%
Facility 52.6%
SD AVG 40.8%
Rank #41 / 63
435051

Financial Assistance for
Nursing Home in South Dakota

Avantara Mountain View is located in Rapid City, South Dakota.
Here are the financial assistance programs available to residents in South Dakota.

Get Financial aid guidance

Home and Community Based Services Waiver

SD Medicaid HCBS Waiver

Age 65+ or disabled
General South Dakota resident, Medicaid-eligible, nursing home-level care need.
Income Limits (2025) ~$2,829/month 300% FBR, individual
Asset Limits $2,000 (individual), $3,000 (couple).
SD

Sparse population aids rural access; limited providers.

Benefits
Personal care (5-7 hours/day) Respite (240 hours/year) Adult day care (~$60/day) Home aides

South Dakota Elderly Services Program

SD ESP

Age 60+
General South Dakota resident, at risk of decline.
Income Limits ~$1,732/month individual, varies
Asset Limits $5,000 individual
SD

Limited funding; rural focus.

Benefits
In-home care (2-4 hours/week) Respite (up to 5 days/year) Transportation (~5 trips/month)

Medicare Savings Program (MSP)

South Dakota Medicare Savings Program

Age 65+ or disabled
General SD resident, Medicare Part A/B.
Income Limits (2025) ~$2,510/month (QMB), ~$3,380/month (SLMB), ~$3,598/month (QI)—individual.
Asset Limits $9,430 (individual), $14,130 (couple).
SD

Three tiers; includes Extra Help for Part D; no waitlist.

Benefits
Covers Part B premiums ($174.70/month) Deductibles ($240/year) Copays (~20%)

Low-Income Home Energy Assistance Program (LIEAP)

South Dakota LIEAP

Age 60+ prioritized
General SD resident, low-income household.
Income Limits (2025) ~$3,970/month individual, 185% FPL
Asset Limits Not assessed; income-focused.
SD

Covers gas, electric, propane; weatherization add-on available.

Benefits
Heating/cooling aid ($300-$1,000/season) Emergency aid ($500 max)

Family Caregiver Support Program (FCSP)

South Dakota Family Caregiver Support Program

Age
General Caregivers of 60+ needing care or 55+ caregivers of others; SD resident; functional needs (2+ ADLs).
Income Limits (2025) No strict cap; prioritizes low-income ~$24,980/year
Asset Limits Not assessed; need-based.
SD

Rural emphasis; includes grandparent caregivers.

Benefits
Respite (4-6 hours/week or 5 days/year) Adult day care ($60/day) Training Supplies (~$500/year)

VA Aid and Attendance (A&A) and Housebound Benefits

South Dakota VA Aid and Attendance/Housebound

Age 65+ or disabled veteran/spouse
General SD resident, wartime service, need for ADL help (A&A) or homebound.
Income Limits (2025) Net income < ~$1,984/month (veteran with dependent, A&A); pension offsets income.
Asset Limits ~$155,356 net worth limit
SD

Supports rural veterans; high demand near Sioux Falls VA.

Benefits
Cash (~$1,433-$2,642/month veteran, ~$951-$1,318 spouse) for care costs (e.g., in-home, assisted living)

Property Tax Reduction Program

South Dakota Property Tax Reduction from Municipal Taxes

Age 65+ (or disabled) by Jan 1
General SD resident entire prior year, homeowner/renter.
Income Limits (2025) ~$20,192/year (single), ~$24,679/year (multiple-member household).
Asset Limits Not assessed; income-focused.
SD

Refunds up to $575; ~10,000 seniors benefit annually.

Benefits
Tax refund (~$250-$575/year based on income)

Senior Farmers’ Market Nutrition Program (SFMNP)

South Dakota SFMNP

Age 60+
General SD resident, low-income.
Income Limits (2025) ~$2,322/month individual, 185% FPL
Asset Limits Not assessed.
SD

Vouchers (~$50/season); serves ~5,000 annually via 6 AAAs.

Benefits
Vouchers (~$50/season) for fresh produce at approved markets

Freeze on Assessments for Dwellings of Disabled and Senior Citizens

South Dakota Property Tax Freeze

Age 65+ (or disabled)
General SD resident 200+ days prior year, homeowner.
Income Limits (2025) ~$35,000/year (single), ~$45,000/year (multiple-member household).
Asset Limits Property value < $250,000 (single), $300,000 (multiple).
SD

Saves ~$300-$600/year avg.; applies to primary residence.

Benefits
Assessment freeze (~$300-$600/year savings)

Older Americans Act (OAA) Services

South Dakota OAA Services

Age 60+
General SD resident (or spouse of any age); no income/asset limits.
Income Limits (2025) None; donations encouraged for some services.
Asset Limits Not assessed.
SD

6 AAAs; rural focus due to sparse population.

Benefits
Meals (home-delivered or congregate, ~$5-$7/meal value) Transportation Homemaker services (~4 hours/week) Respite (~5 days/year) Legal aid

Frequently Asked Questions about Avantara Mountain View

Is Avantara Mountain View in a walkable area?

Avantara Mountain View has a walk score of 83. Very walkable. Most errands can be accomplished on foot, and many essentials are within a short walk.

What is the license number of Avantara Mountain View?

According to SD state health department records, Avantara Mountain View's license number is 10669.

When does Avantara Mountain View's license expire?

According to SD state health department records, Avantara Mountain View's license expires on June 30, 2026.

What is the occupancy rate at Avantara Mountain View?

Avantara Mountain View's occupancy is 81%.

Who is the administrator of Avantara Mountain View?

Laura Karlson is the administrator of Avantara Mountain View.

How many beds does Avantara Mountain View have?

Avantara Mountain View has 95 beds.

Are there photos of Avantara Mountain View?

Yes — there are 6 photos of Avantara Mountain View in the photo gallery on this page.

Guides for Better Senior Living

Care Cost Calculator: See Prices in Your Area

Nursing Home Data Explorer

Don’t Wait Too Long: 7 Red Flag Signs Your Parent Needs Assisted Living Now

The True Cost of Assisted Living in 2025 – And How Families Are Paying For It

Understanding Senior Living Costs: Pricing Models, Discounts & Financial Assistance