AVIVA Granbury
Nursing Home · Fort Worth, TX
CMS overall rating Info The Overall CMS Rating is scored from 1 to 5 stars and combines results from health inspections, staffing levels, and quality measures. Health inspections carry the most weight. Staffing and quality scores can increase or decrease the final rating based on performance compared to state and national standards.

AVIVA Granbury

Nursing Home · Fort Worth, TX
CMS overall rating Info The Overall CMS Rating is scored from 1 to 5 stars and combines results from health inspections, staffing levels, and quality measures. Health inspections carry the most weight. Staffing and quality scores can increase or decrease the final rating based on performance compared to state and national standards.
Calculator: See prices in your area
AVIVA Granbury accepts Medicare, Medicaid, and private pay.

Overview of Aviva Granbury

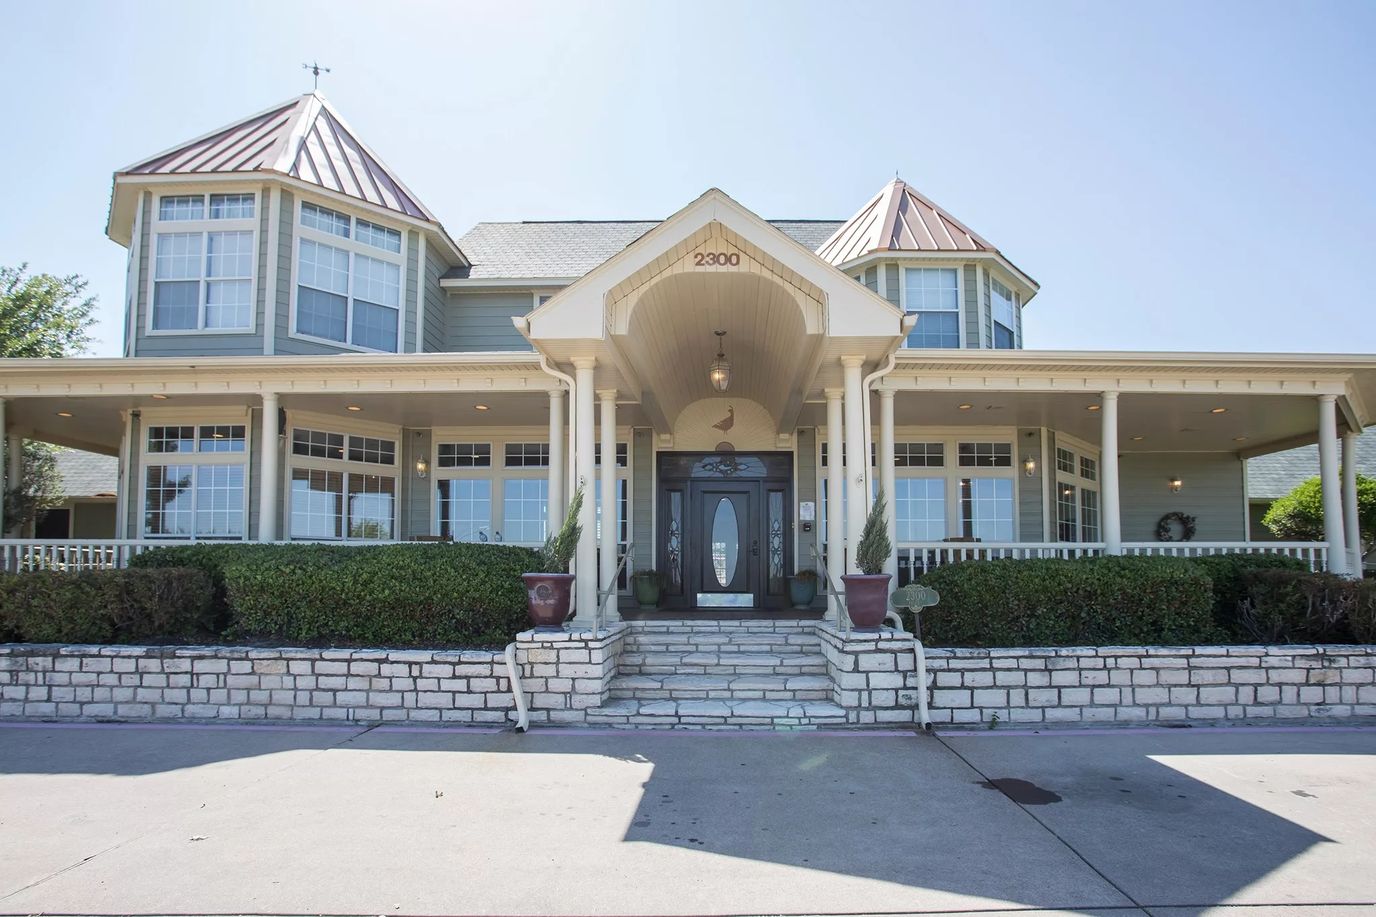
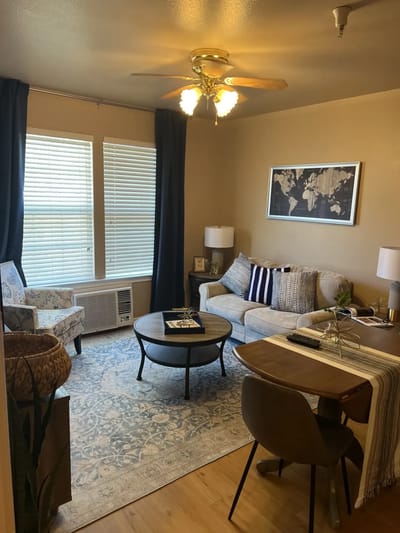
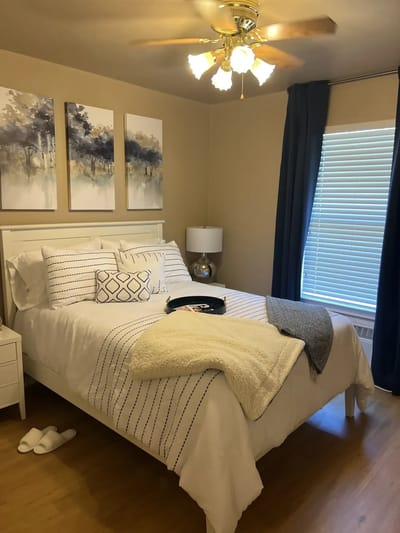
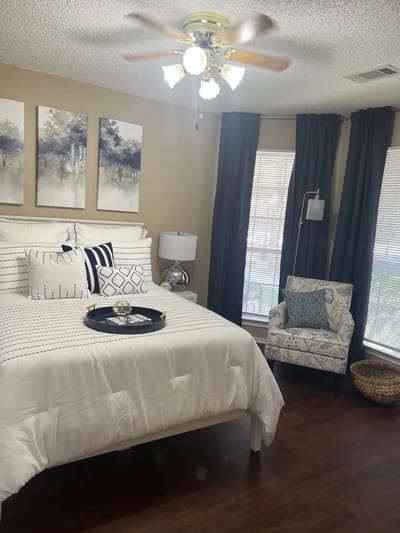
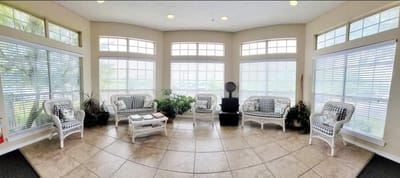
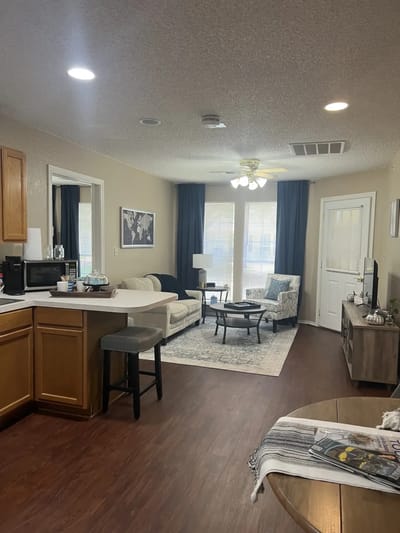
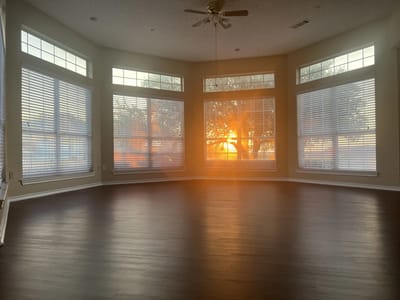
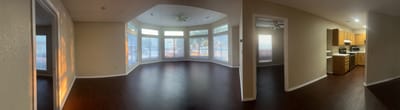
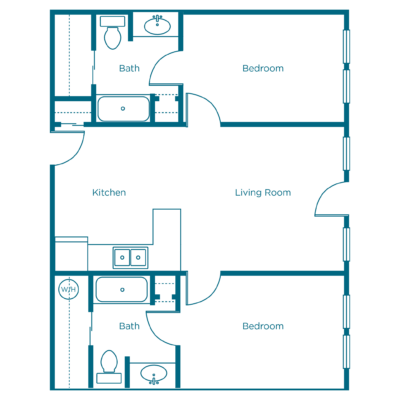
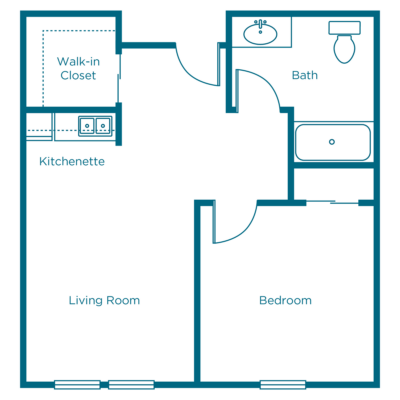
Aviva Granbury is a community enveloped in character. Offering independent living, assisted living, memory care, and respite care, this home proves itself to be at the forefront of senior care in Granbury, Texas. The vibrant atmosphere is fostered by highly trained and friendly staff who serve with the perfect balance of professionalism and compassion. Featuring top-notch apartments with vibrant interiors and senior-friendly design, seniors are sure to spend every day with ease. Not to mention the enriching experiences that the home offers, such as happy hours, fitness classes, nature-filled grounds for unwinding, gathering spaces, and much more. The home also serves freshly cooked meals that are sure to further elevate the mundane. In this community, seniors are certain to create new, meaningful memories for their golden years.

(817) 279-9259

Quality ratings

Measured by Centers for Medicare & Medicaid Services (CMS)

Overall rating Info The Overall CMS Rating combines results from health inspections, staffing levels and quality measures. Health inspections carry the most weight. Staffing and quality scores can increase or decrease the final rating based on performance compared to state and national standards.
▲ 66.1% Above TX avg. ▲ 66.1% Above TX avg.Click the badge to see the full State ranking.Click here to see the full State ranking.
Health Inspection Info Based on the results of the facility's three most recent standard inspections and any complaint investigations. CMS reviews the number, scope, and severity of deficiencies, with more recent findings weighted more heavily.
▲ 38.4% Above TX avg. ▲ 38.4% Above TX avg.Click the badge to see the full State ranking.Click here to see the full State ranking.
Staffing Info Measures average nursing staff hours per resident per day, including Registered Nurses (RNs) and total nursing staff. Ratings are adjusted based on the level of care residents require and are compared to state and national benchmarks.
▲ 25.0% Above TX avg. ▲ 25.0% Above TX avg.Click the badge to see the full State ranking.Click here to see the full State ranking.
Quality Measures Info Based on clinical and physical health indicators reported to CMS, such as hospital readmissions, falls, pressure ulcers, and improvements in mobility. These measures reflect how well residents' health needs are being managed.
▲ 26.6% Above TX avg. ▲ 26.6% Above TX avg.Click the badge to see the full State ranking.Click here to see the full State ranking.

Staffing hours breakdown

Info Daily nursing hours per resident by staff type, reported to CMS. Higher is generally better — compare this facility to state and national averages to see where staffing stands.

Hours per resident per day — compared to Texas state averages

Total nursing care / resident Info This home is ranked 184th out of 289 homes in Texas. Total adjusted nursing hours per resident per day, combining RN, LPN, and aide time. CMS adjusts this for case-mix so facilities can be fairly compared.
3h 19m per day
Rank #184 / 289Nurse hours — State benchmarkedThis home is ranked 184th out of 289 homes in Texas. Shows adjusted nurse hours per resident per day benchmarked to the Texas average, with a ranking across 289 Texas SNFs. More hours mean more direct care. The national average is about 3.5 hrs; below 3.0 is a red flag.Click the rank badge to see the full State ranking.Click here to see the full State ranking.
This facility Texas avg (3h 47m per day)
vs Texas avg
-12%

1 of 1 metrics below state avg

Staff typeHours / Day / Residentvs state avg
Weekend Total Nursing Info Combined nursing hours (RN + LPN + Nurse Aide) per resident per day on weekends. Staffing often drops on weekends — this figure reveals whether the facility maintains adequate coverage outside of weekday hours. 2h 44m per day ▼ 8% State avg: 2h 58m per day · National avg: 3h 25m per day

Capacity and availability

This home usually has availability

Higher occupancy than the Texas average: 63.5%
Occupancy rate
83% Rank #45 / 297Occupancy rate — State benchmarkedThis home is ranked 45th out of 297 homes in Texas. Shows this facility's occupancy rate versus the Texas average, with its Statewide rank out of 297. Higher occupancy signals strong local demand and financial stability.Click the rank badge to see the full State ranking.Click here to see the full State ranking.
Avg. Length of Stay
117 days
Bed community size
16-bed community Rank #807 / 987Bed count — State benchmarkedThis home is ranked 807th out of 987 homes in Texas. Shows this facility's certified or reported bed count compared to other Texas SNFs. Larger communities may offer more amenities, programs, and on-site services for residents and families.Click the rank badge to see the full State ranking.Click here to see the full State ranking.
A smaller, more intimate setting that may offer a quieter environment and closer staff-resident interactions.
Years in operation
11 years in operation Rank #385 / 581Years in operation — State benchmarkedThis home is ranked 385th out of 581 homes in Texas. Shows how long this facility has been in operation compared to other Texas SNFs. Longer operating histories may benefit residents, families, and staff.Click the rank badge to see the full State ranking.Click here to see the full State ranking.
A community with a solid operating history and experience delivering ongoing care.
Walk Score
Walk Score: 1 / 100 Rank #1346 / 1392Walk Score — State benchmarkedThis home is ranked 1346th out of 1392 homes in Texas. Shows how walkable this facility's neighborhood is compared to the average Walk Score across Texas SNFs. Higher scores benefit residents, families, and staff.Click the rank badge to see the full State ranking.Click here to see the full State ranking.
Car-dependent. Most errands require a car, with limited nearby walkable options.

About this community

License Details

Facility TypeAssisted Living
ExpirationNovember 17, 2025
CountyHood
License Number308748
Year Opened10/15/2014

Ownership & Operating Entity

AVIVA Granbury is administrated by Cheri Rose.

Management CompanyLJ GRANBURY MANAGEMENT LLC
OwnerGRANBURY 2300 OPCO LLC
Ownership TypeLimited Liability Company (LLC)

Safety & Compliance

Secured Perimeter
Emergency SystemsKeyless entry and wearable emergency response technology.

Staffing

Key information about the people who lead and staff this community.

Leadership

Administrator Email[email protected]

Therapy & Rehabilitation

2 services
Rehabilitation Services
Respite Care

Staffing & Medical

1 service
24-Hour Staffing

Additional Policies & Features

Pets Allowed
HousekeepingYes
Linen ServiceYes
Utilities IncludedYes

Amenities & Lifestyle

Fitness Center
Library
Salon
Game Room
Activities Room
Enclosed Courtyards
Keyless Entry
Emergency Response Technology
Specific ProgramsShort-Term Stay

Pricing & Financial Information

IL$2,925 per month
AL$4,709 per month
MC$4,995 per month

Dining & Nutrition

Food DescriptionChef-prepared meals served daily.

Contact AVIVA Granbury

Health Inspection History

Inspections since 2023
Total health inspections 3

Texas average 7.4


Last Health inspection on Sep 2025

Total health citations
17 Rank #89 / 292Health citations — State benchmarkedThis home is ranked 89th out of 292 homes in Texas. Shows this facility's total health deficiency citations benchmarked to the Texas State average, with a ranking across all 292 TX SNFs. Lower citation counts earn a better rank.Click the rank badge to see the full State ranking.Click here to see the full State ranking.

Texas average 25.9

Citations per inspection
5.67 Rank #277 / 292Citations per inspection — State benchmarkedThis home is ranked 277th out of 292 homes in Texas. Shows average deficiency citations per CMS inspection for this facility versus the Texas mean across 292 SNFs with citation data. Lower is better.Click the rank badge to see the full State ranking.Click here to see the full State ranking.

Texas average 3.67


Health citations are formal notices following inspections when they fail to comply with safety and care standards.

14 of 17 citations resulted from standard inspections; and 3 of 17 came from combined inspections (standard and complaint).

Breakdown of citation severity (last 3 years)
Critical health citations
0
100% better than Texas average

Texas average: 2


Serious health citations
0
100% better than Texas average

Texas average: 0.4

0 critical citations Texas average: 2

0 serious citations Texas average: 0.4

17 moderate citations Texas average: 23

0 minor citations Texas average: 0.4
Citations history (last 3 years)
Abuse/Neglect moderate citation Sep 18, 2025

Infection Control moderate citation Sep 18, 2025

Nutrition moderate citation Sep 18, 2025

Nutrition moderate citation Sep 18, 2025

Staffing Data

Reporting period: October 1 – December 31, 2025 (Q4 2025). Source: CMS Payroll-Based Journal report.

Total staff 89
Employees 84
Contractors 5
Staff to resident ratio 1.13:1
24% worse than Texas average
Texas average ratio: 1.48:1 Texas average ratio: 1.48:1See full Texas ranking
Avg staff/day 38
Average shift 7.9 hours
0% compared with Texas average
Texas average: 8.1 hours Texas average shift: 8.1 hoursSee full Texas ranking
Total staff hours (quarter) 27,578

Nursing staff breakdown

Q4 2025 · Oct 1 – Dec 31 More info This data comes from the CMS Payroll-Based Journal report covering October 1 – December 31, 2025.
Registered Nurse

Manages medical care and health needs.

RN Staff 9
Average shift length Info Average shift length. Calculated as total hours divided by days worked and average staff per day. 8 hours

No contractors work on this role.

Licensed Practical Nurse

Assists with medical care and medications.

LPN Staff 17
Average shift length Info Average shift length. Calculated as total hours divided by days worked and average staff per day. 8.5 hours

No contractors work on this role.

Certified Nursing Assistant

Helps with daily care and mobility.

CNA Staff 27
Average shift length Info Average shift length. Calculated as total hours divided by days worked and average staff per day. 8.3 hours

No contractors work on this role.

Contractor staffing

Q4 2025 · Oct 1 – Dec 31 More info This data comes from the CMS Payroll-Based Journal report covering October 1 – December 31, 2025.

Total hours from contractors

0.3%

83 contractor hours this quarter

Diagnostic X-ray Services Staff: 3 Medical Director: 2

Staff by category

Q4 2025 · Oct 1 – Dec 31 More info This data comes from the CMS Payroll-Based Journal report covering October 1 – December 31, 2025.
Certified Nursing Assistant2702710,56392100%8.3
Licensed Practical Nurse170175,09792100%8.5
Registered Nurse9093,7799199%8
Nurse Aide in Training130131,6677582%7.3
Physical Therapy Assistant3039517683%6.7
Speech Language Pathologist4048897278%6.1
RN Director of Nursing2028567582%7.1
Other Dietary Services Staff1015166773%7.7
Clinical Nurse Specialist2025046470%7.9
Mental Health Service Worker1014656166%7.6
Administrator1014645863%8
Nurse Practitioner1014645863%8
Qualified Social Worker1014536166%7.4
Respiratory Therapy Technician1014215358%7.9
Physical Therapy Aide1014075863%7
Medical Director02272910%8
Diagnostic X-ray Services Staff0331167%1.6
27 Certified Nursing Assistant
% of Days 100%
17 Licensed Practical Nurse
% of Days 100%
9 Registered Nurse
% of Days 99%
13 Nurse Aide in Training
% of Days 82%
3 Physical Therapy Assistant
% of Days 83%
4 Speech Language Pathologist
% of Days 78%
2 RN Director of Nursing
% of Days 82%
1 Other Dietary Services Staff
% of Days 73%
2 Clinical Nurse Specialist
% of Days 70%
1 Mental Health Service Worker
% of Days 66%
1 Administrator
% of Days 63%
1 Nurse Practitioner
% of Days 63%
1 Qualified Social Worker
% of Days 66%
1 Respiratory Therapy Technician
% of Days 58%
1 Physical Therapy Aide
% of Days 63%
2 Medical Director
% of Days 10%
3 Diagnostic X-ray Services Staff
% of Days 7%

Penalties and fines

Federal penalties imposed by CMS for regulatory violations, including civil money penalties (fines) and denials of payment for new Medicare/Medicaid admissions.

Source: CMS Penalties Database

No penalties in the past 3 years

No civil money penalties or payment denials were reported in the last 3 years.

Quality of care over time

These measures show how residents usually do over time at this home, based on health outcomes and preventive care.

High-risk clinical events score Info A composite score based on pressure ulcers, falls with injury, weight loss, walking ability decline, and activities of daily living decline. 2.2
74% better than Texas average

Texas average: 8.6

Functional decline score Info A composite score based on activities of daily living decline, walking ability decline, and incontinence. 8.5
47% better than Texas average

Texas average: 16.0

Long-stay resident measures
Need for Help with Daily Activities Increased Info Percent of long-stay residents whose need for help with daily activities has increased 6.1%
62% better than Texas average

Texas average: 16.2%

Walking Ability Worsened Info Percent of long-stay residents whose ability to move independently worsened 1.9%
88% better than Texas average

Texas average: 16.2%

Low Risk Residents with Bowel/Bladder Incontinence Info Percent of low risk long-stay residents who lose control of their bowels or bladder 17.4%
11% worse than Texas average

Texas average: 15.7%

Falls with Major Injury Info Percent of long-stay residents experiencing one or more falls with major injury 0.0%
100% better than Texas average

Texas average: 3.2%

High Risk Residents with Pressure Ulcers Info Percent of long-stay high risk residents with pressure ulcers 1.3%
70% better than Texas average

Texas average: 4.4%

Urinary Tract Infection Info Percent of long-stay residents with a urinary tract infection 0.0%
100% better than Texas average

Texas average: 0.8%

Lost Too Much Weight Info Percent of long-stay residents who lose too much weight 1.8%
49% better than Texas average

Texas average: 3.5%

Depressive Symptoms Info Percent of long-stay residents who have depressive symptoms 8.7%
202% worse than Texas average

Texas average: 2.9%

Antipsychotic Use Info Percent of long-stay residents who received an antipsychotic medication 3.2%
59% better than Texas average

Texas average: 7.9%

Pneumococcal Vaccine Info Percent of long-stay residents assessed and appropriately given the pneumococcal vaccine 100.0%
In line with Texas average

Texas average: 97.3%

Influenza Vaccine Info Percent of long-stay residents assessed and appropriately given the seasonal influenza vaccine 100.0%
In line with Texas average

Texas average: 97.9%

Short-stay resident measures
Pneumococcal Vaccine Info Percent of short-stay residents assessed and appropriately given the pneumococcal vaccine 100.0%
11% better than Texas average

Texas average: 90.4%

Antipsychotic medication increase Info Percent of short-stay residents who newly received an antipsychotic medication 0.0%
100% better than Texas average

Texas average: 1.4%

Influenza Vaccine Info Percent of short-stay residents assessed and appropriately given the seasonal influenza vaccine 100.0%
14% better than Texas average

Texas average: 88.0%

Breakdown by payment type

Medicare

33% of new residents, usually for short-term rehab.

Typical stay 30 days

Private pay

55% of new residents, often for short stays.

Typical stay 1 - 2 months

Medicaid

11% of new residents, often for long-term daily care.

Typical stay 1 - 2 years

Facility Characteristics

Source: CMS Long-Term Care Facility Characteristics (Data as of Jan 2026)

Total residents 79
Medicare
11
13.9% of residents
Medicaid
52
65.8% of residents
Private pay or other
16
20.3% of residents
Programs & Services
Residents Group

Residents meet regularly to discuss policies, care quality, and activities

Nurse Aide Training

State-approved Nurse Aide Training and Competency Evaluation Program on-site

Active Resident Council

Organized group of residents that meets regularly to discuss facility policies, quality of life, and activities.

Finances and operations

Privately-owned community
Operated by a business corporation.
Home revenue
$11.2M
Profit
$198.5K
Privately-owned community Operated by a business corporation.
Home revenue
$11.2M Rank #142 / 297Revenue — State benchmarkedThis home is ranked 142nd out of 297 homes in Texas. Shows this facility's annual revenue compared to the Texas SNF average. Higher revenue generally means more resources for staffing and capital — read alongside Payroll %.Click the rank badge to see the full State ranking.Click here to see the full State ranking.
Profit
$198.5K
Payroll costs Info The portion of the home's budget spent on staff, including nurses, caregivers, and other employees who support care and operations. Rank #258 / 297Payroll — State benchmarkedThis home is ranked 258th out of 297 homes in Texas. Shows total annual staff payroll benchmarked to the Texas average. Higher payroll investment relative to peers often signals better staffing and less reliance on cheaper contract labor.Click the rank badge to see the full State ranking.Click here to see the full State ranking.
$3.1M
28% of revenue Rank #290 / 297Payroll % — State benchmarkedThis home is ranked 290th out of 297 homes in Texas. Shows payroll as a percentage of revenue versus the Texas average. Well-run Texas SNFs typically land around 51–63% — the top third Statewide. Below 25% may signal understaffing or heavy agency use — read with Staffing ratings.Click the rank badge to see the full State ranking.Click here to see the full State ranking.
Other operating costs Info All remaining costs needed to run the home, such as food, utilities, building maintenance, supplies and administrative expenses.
$7.9M
Total costs $11.0M

Who this home usually serves

TYPE OF STAY

Mix of rehab and long-term care

This home supports both short-term rehab and long-term care, with residents staying for a wide range of durations.

Places of interest near AVIVA Granbury

Address 40.0 miles from city center Info Estimated distance in miles from Granbury's city center to AVIVA Granbury's address, calculated via Google Maps. — 1.15 miles to nearest hospital (Texas Oncology-Granbury)

Calculate Travel Distance to AVIVA Granbury

Add your location

Address

Financial Assistance for
Nursing Home in Texas

AVIVA Granbury is located in Granbury, Texas.
Here are the financial assistance programs available to residents in Texas.

Get Financial aid guidance

Community Care for the Aged and Disabled (CCAD)

TX Medicaid CCAD

Age 65+ or disabled
General Texas resident, Medicaid-eligible, care need (not always nursing home level).
Income Limits (2025) ~$2,829/month 300% FBR, individual
Asset Limits $2,000 (individual), $3,000 (couple).
TX

Large state; rural access challenges.

Benefits
Personal care (5-7 hours/day) Respite (240 hours/year) Adult day care (~$60/day) Home aides

Texas Community Care Services

TX CCS

Age 60+
General Texas resident, at risk of decline.
Income Limits ~$2,000/month individual, varies
Asset Limits $5,000 individual
TX

Limited funding; high demand in urban areas.

Benefits
In-home care (3-5 hours/week) Respite (up to 10 days/year) Transportation (~5 trips/month)

Area Agency on Aging (AAA) Services

Texas AAA Services

Age 60+
General TX resident; no income/asset limits.
Income Limits (2025) None; donations encouraged.
Asset Limits Not assessed.
TX

28 AAAs; includes Meals on Wheels in some areas.

Benefits
Meals (~$5-$7/meal) Transportation Homemaker services (~4 hours/week) Respite (~5 days/year) Legal aid

Medicare Savings Program (MSP)

Texas Medicare Savings Program

Age 65+ or disabled
General TX resident, Medicare Part A/B.
Income Limits (2025) ~$2,510/month (QMB), ~$3,380/month (SLMB), ~$3,598/month (QI)—individual.
Asset Limits $9,430 (individual), $14,130 (couple).
TX

Includes Extra Help for Part D; no waitlist.

Benefits
Covers Part B premiums ($174.70/month) Deductibles ($240/year) Copays (~20%)

Family Caregiver Support Program (FCSP)

Texas Family Caregiver Support Program

Age
General Caregivers of 60+ needing care or 55+ caregivers of others; TX resident; 2+ ADLs.
Income Limits (2025) No strict cap; prioritizes low-income ~$24,980/year
Asset Limits Not assessed.
TX

High rural demand; includes grandparent caregivers.

Benefits
Respite (4-6 hours/week or 5 days/year) Adult day care ($60/day) Training Supplies (~$500/year)

VA Aid and Attendance (A&A) and Housebound Benefits

Texas VA Aid and Attendance/Housebound

Age 65+ or disabled veteran/spouse
General TX resident, wartime service, ADL help (A&A) or homebound.
Income Limits (2025) Net income < ~$1,984/month (veteran with dependent, A&A); pension offsets income.
Asset Limits ~$155,356 net worth
TX

High veteran population; supports rural/urban needs.

Benefits
Cash (~$1,433-$2,642/month veteran, ~$951-$1,318 spouse) for care costs

Property Tax Exemption for Seniors

Texas Senior Property Tax Exemption

Age 65+
General TX resident, homeowner (homestead).
Income Limits (2025) None; tax-based eligibility.
Asset Limits Not assessed.
TX

$25,000+ exemption; optional freeze in some counties; saves ~$500-$1,000/year.

Benefits
Tax exemption or freeze (~$500-$1,000/year savings)

Senior Farmers’ Market Nutrition Program (SFMNP)

Texas SFMNP

Age 60+
General TX resident, low-income.
Income Limits (2025) ~$2,322/month 185% FPL
Asset Limits Not assessed.
TX

Vouchers (~$50/season); serves ~20,000 via 28 AAAs.

Benefits
Vouchers (~$50/season) for produce at farmers’ markets

Compare Nursing Home around Fort Worth

The information below is reported by the Texas Health and Human Services Commission.

2 facilities compared · CMS & TX Dept. of Health data

Filter by care type
AVIVA Granbury
NH

Nursing Home Licensed facility providing 24/7 skilled nursing care for residents with complex, ongoing medical needs. Staffed by RNs, LPNs, and CNAs. Inspected and star-rated annually by CMS. Accepts Medicare (short-term rehab) and Medicaid (long-term care).

AL

Assisted Living A licensed, long-term care setting for seniors or individuals with disabilities who need help with daily activities — like bathing, dressing, and medication management — but not 24-hour skilled nursing. Offers housing, meals, and around-the-clock support while aiming to maximize resident independence.

Granbury16 83.0% +31%3.32 +32%-8%$0175.7-84- 1 -$11.2M$3.1M28%455929
Sunrise of Fort Worth
NH

Nursing Home Licensed facility providing 24/7 skilled nursing care for residents with complex, ongoing medical needs. Staffed by RNs, LPNs, and CNAs. Inspected and star-rated annually by CMS. Accepts Medicare (short-term rehab) and Medicaid (long-term care).

AL

Assisted Living A licensed, long-term care setting for seniors or individuals with disabilities who need help with daily activities — like bathing, dressing, and medication management — but not 24-hour skilled nursing. Offers housing, meals, and around-the-clock support while aiming to maximize resident independence.

MC

Memory Care Secured, specialized care for people living with Alzheimer's or dementia. Staff trained in cognitive impairment, with higher staff-to-resident ratios and an environment designed to reduce confusion and wandering risk.

Fort Worth105 69.2% +9%3.34 -46%-8%$88.0k342.1392A- 53 Bryant Irvin Consulting LLC$12.3M$5.4M43.9%676067

Frequently Asked Questions about AVIVA Granbury

Who is the owner of AVIVA Granbury?

The legal owner and operator of AVIVA Granbury is Granbury 2300 Opco Llc.

Is AVIVA Granbury in a walkable area?

AVIVA Granbury has a walk score of 1. Car-dependent. Most errands require a car, with limited nearby walkable options.

What is the license number of AVIVA Granbury?

According to TX state health department records, AVIVA Granbury's license number is 308748.

When does AVIVA Granbury's license expire?

According to TX state health department records, AVIVA Granbury's license expires on November 17, 2025.

Who is the administrator of AVIVA Granbury?

Cheri Rose is the administrator of AVIVA Granbury.

How many beds does AVIVA Granbury have?

AVIVA Granbury has 16 beds.

Are there photos of AVIVA Granbury?

Yes — there are 15 photos of AVIVA Granbury in the photo gallery on this page.

Guides for Better Senior Living

Care Cost Calculator: See Prices in Your Area

Nursing Home Data Explorer

Don’t Wait Too Long: 7 Red Flag Signs Your Parent Needs Assisted Living Now

The True Cost of Assisted Living in 2025 – And How Families Are Paying For It

Understanding Senior Living Costs: Pricing Models, Discounts & Financial Assistance

Explore Open Rooms
1 Contact details
2 What type of senior care service are you looking for?
3 What budget do you have in mind for senior care?
4 How soon do you need to find care?
5 Additional details

Thank you for your interest!

Our team will be in touch shortly to help with next steps.