


Total health inspections
18
Texas average 7.4
Last Health inspection on Sep 2025
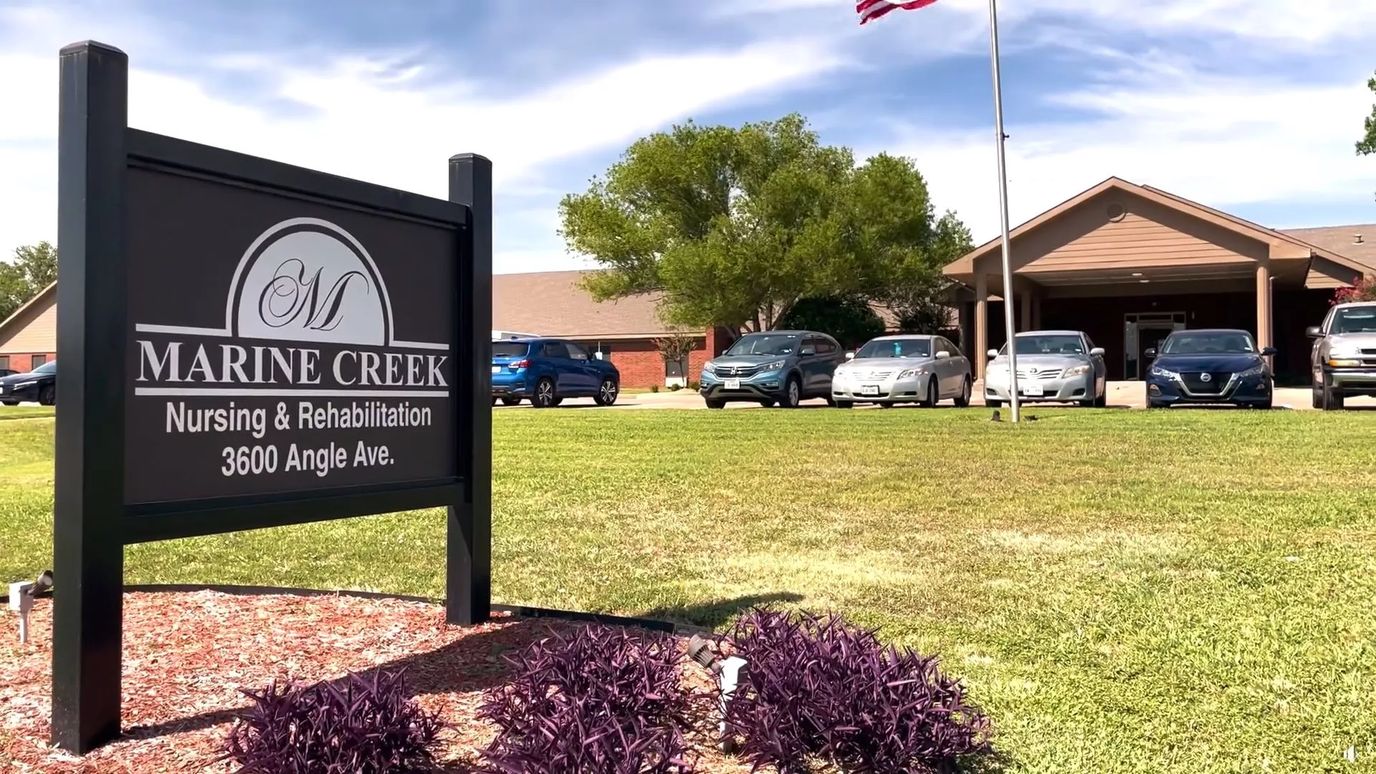
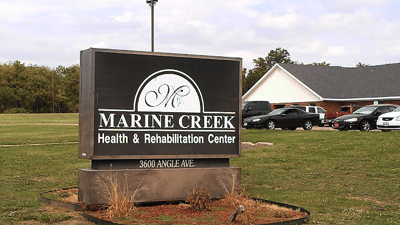

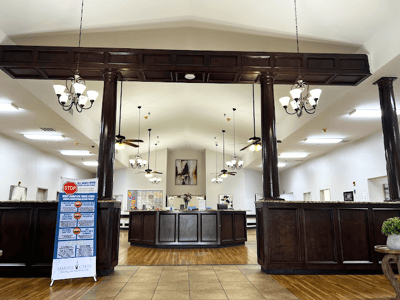

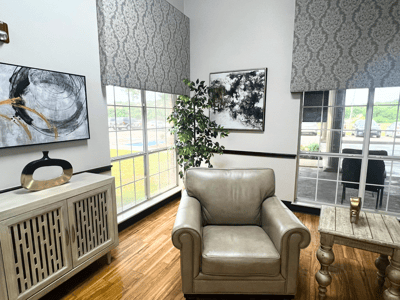

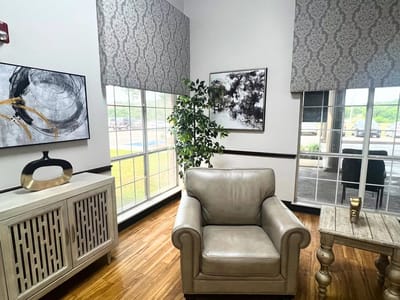
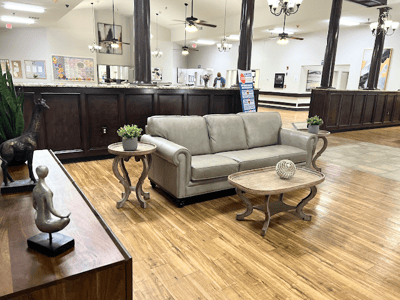
Marina Creek is one of the best nursing home facilities in Fort Worth that provides exceptional care. The community offers an inviting community with exemplary hospitality. With a focus on long-term care services, a team of dedicated staff who are compassionately ready to attend to any need one may have. Residents are encouraged and motivated to live fully in a nurturing, home-like setting.
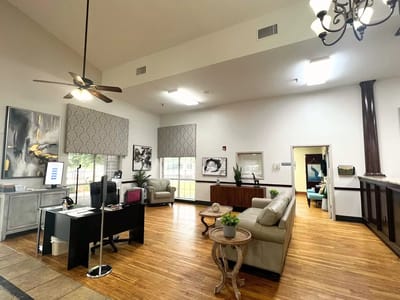
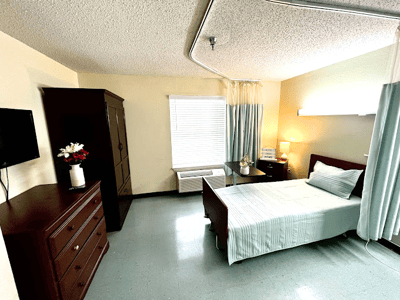
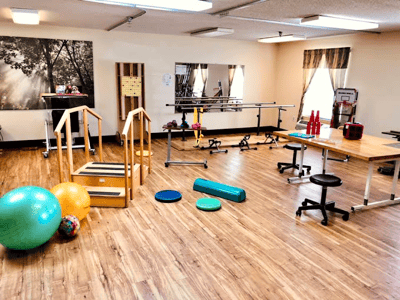
The residential lifestyle at Marine Creek is built on compassion and care. Residents are guaranteed to make the most of their day-to-day while receiving significant hospitality and attentive assistance. Community services include 24-hour nursing care, stimulating activities, engaging social activities and programs, therapy services (speech, occupational, physical), orthopedic recovery, surgery recovery, diabetes management, dentistry, Alzheimer’s care, and stroke recovery– are few of the many things provided at the nursing home.
| Staff type | Hours / Day / Resident | vs state avg |
|---|---|---|
|
Registered Nurse (RN)
| 35m per day | ▲ 34% State avg: 26m per day · National avg: 41m per day |
|
LPN / LVN
| 50m per day | ▼ 13% State avg: 57m per day · National avg: 52m per day |
|
Nurse Aide
| 2h 4m per day | ■ Avg State avg: 2h 1m per day · National avg: 2h 21m per day |
|
Weekend Total Nursing
| 2h 57m per day | ■ Avg State avg: 2h 59m per day · National avg: 3h 26m per day |
|
Physical Therapist
| 3m per day | ▼ 25% State avg: 4m per day · National avg: 4m per day |
|
Weekend RN
| 32m per day | ▲ 53% State avg: 21m per day · National avg: 29m per day |
Marine Creek Nursing and Rehabilitation is administered by Brenda Wright.
Key information about the people who lead and staff this community.
In Texas, the Health and Human Services Commission (HHSC) is the primary regulatory body that conducts unannounced inspections and publishes quality reports for all long-term care homes.
Citations
| This Facility | TX Average | vs. TX Avg |
|---|---|---|---|
|
Total citations
| 13 | 6 | This facility has 117% more total citations than a typical Texas nursing home (13 vs. TX avg 6).↑ 117% worse |
|
Health citations
| 9 | 2 | This facility has 350% more health citations than a typical Texas nursing home (9 vs. TX avg 2).↑ 350% worse |
|
Life safety citations
| 4 | 6 | This facility has 33% fewer life safety citations than a typical Texas nursing home (4 vs. TX avg 6).↓ 33% better |
Texas average 7.4
Last Health inspection on Sep 2025
Texas average 25.9
Texas average 3.67
Health citations are formal notices following inspections when they fail to comply with safety and care standards.
12 of 46 citations resulted from standard inspections; 33 of 46 resulted from complaint investigations; and 1 of 46 came from combined inspections (standard and complaint).
Texas average: 2
Texas average: 0.4
Reporting period: October 1 – December 31, 2025 (Q4 2025). Source: CMS Payroll-Based Journal report.
Manages medical care and health needs.
Assists with medical care and medications.
Helps with daily care and mobility.
| Certified Nursing Assistant | 51 | 0 | 51 | 20,682 | 92 | 100% | 7.6 |
| Licensed Practical Nurse | 19 | 0 | 19 | 7,105 | 92 | 100% | 8.2 |
| Registered Nurse | 14 | 0 | 14 | 6,361 | 92 | 100% | 8.6 |
| Qualified Activities Professional | 10 | 0 | 10 | 3,415 | 92 | 100% | 9.4 |
| Medication Aide/Technician | 8 | 0 | 8 | 3,105 | 92 | 100% | 9 |
| RN Director of Nursing | 9 | 0 | 9 | 2,676 | 87 | 95% | 9.4 |
| Qualified Social Worker | 3 | 0 | 3 | 920 | 75 | 82% | 5.2 |
| Respiratory Therapy Technician | 3 | 0 | 3 | 591 | 65 | 71% | 7 |
| Nurse Aide in Training | 3 | 0 | 3 | 567 | 62 | 67% | 8.1 |
| Physical Therapy Assistant | 2 | 0 | 2 | 529 | 56 | 61% | 7.6 |
| Nurse Practitioner | 1 | 0 | 1 | 520 | 65 | 71% | 8 |
| Dietitian | 1 | 0 | 1 | 505 | 61 | 66% | 8.3 |
| Physical Therapy Aide | 1 | 0 | 1 | 458 | 62 | 67% | 7.4 |
| Administrator | 1 | 0 | 1 | 448 | 56 | 61% | 8 |
| Other Dietary Services Staff | 3 | 0 | 3 | 442 | 60 | 65% | 7.2 |
| Therapeutic Recreation Specialist | 1 | 0 | 1 | 367 | 56 | 61% | 6.5 |
| Mental Health Service Worker | 2 | 0 | 2 | 361 | 46 | 50% | 7.9 |
| Speech Language Pathologist | 1 | 0 | 1 | 240 | 31 | 34% | 7.7 |
| Occupational Therapy Aide | 1 | 0 | 1 | 52 | 9 | 10% | 5.8 |
| Medical Director | 0 | 1 | 1 | 6 | 3 | 3% | 2 |
Includes penalties issued in 2023-2024
Federal penalties imposed by CMS for regulatory violations, including civil money penalties (fines) and denials of payment for new Medicare/Medicaid admissions.
Source: CMS Penalties Database (Data as of Jan 2026)
Texas average: $80K
Texas average: 2.5
Texas average: 0.2
Penalties are imposed by CMS for violations of federal nursing home regulations.
3 penalties in the past 3 years
Multiple penalties were reported in the last 3 years.
Last updated: Jan 2026
These measures show how residents usually do over time at this home, based on health outcomes and preventive care.
Texas average: 8.6
Texas average: 16.0
Texas average: 16.2%
Texas average: 16.2%
Texas average: 15.7%
Texas average: 3.2%
Texas average: 4.4%
Texas average: 0.8%
Texas average: 3.5%
Texas average: 2.9%
Texas average: 97.3%
Texas average: 97.9%
Texas average: 2.13
Texas average: 2.07
Texas average: 90.4%
Texas average: 1.4%
Texas average: 88.0%
Texas average: 25.9%
Texas average: 12.0%
Texas average: 0.8%
Texas average: 53.7%
Texas average: 50.6%
Quality measures are calculated from Minimum Data Set (MDS) assessments. For most measures, lower percentages indicate better care quality.
21% of new residents, usually for short-term rehab.
25% of new residents, often for short stays.
54% of new residents, often for long-term daily care.
Source: CMS Long-Term Care Facility Characteristics (Data as of Jan 2026)
Residents meet regularly to discuss policies, care quality, and activities
Organized group of residents that meets regularly to discuss facility policies, quality of life, and activities.
Data sourced from CMS Long-Term Care Facility Characteristics quarterly report. Payer mix reflects the current resident census by primary payment source.
Historical financial and operational data for Marine Creek Nursing and Rehabilitation from 2011–2024, based on CMS SNF Cost Reports.
Key figures below are for fiscal year ending in 03/2024.
Based on CMS SNF Cost Report for fiscal year ending in 03/2024.
Most residents stay for extended periods and receive ongoing daily care.
Most new residents arrive under Medicaid (54% of admissions), and a typical Medicaid stay runs around 6 - 7 months.
Coverage residents most often arrive under.
Coverage residents most often leave under.
![]() 4.3 miles from city center
4.3 miles from city center
![]() Estimated distance in miles from Fort Worth's city center to Marine Creek Nursing and Rehabilitation's address, calculated via Google Maps.
Estimated distance in miles from Fort Worth's city center to Marine Creek Nursing and Rehabilitation's address, calculated via Google Maps.
Add your location
Info below is compiled from CMS reports & the TX Health & Human Services Commission (HHSC), senior community websites & trusted data sources such as Walk Score & BBB.
Communities are listed from highest to lowest based on our ranking methodology.
| Stonegate Nursing and Rehabilitation | NH SNF | Fort Worth | 134
Facility
134
TX AVG
79
Rank
#115 / 972 |
66.7%
Facility
66.7%
TX AVG
67.3
Rank
#114 / 195 | -1% | 4.01
Facility
4.01
TX AVG
3.63
Rank
#68 / 273 | +78% | +10% | $16.8k
Facility
$16.8k
TX AVG
$81.8k
Rank
#119 / 278 | 28
Facility
28
TX AVG
25.9
Rank
#193 / 274 | 3.1
Facility
3.1
TX AVG
3.7
Rank
#124 / 274 | 3 | 89 | A+ |
35
Facility
35
TX AVG
41
Rank
#847 / 1389 | Hmg Park Manor Of Stonegate, LLC | $8.1MFiscal year ending 08/2024
Facility
$8.1MFiscal year ending 08/2024
TX AVG
$8.4M
Rank
#101 / 280 | $4.1MFiscal year ending 08/2024
Facility
$4.1MFiscal year ending 08/2024
TX AVG
$3.5M
Rank
#157 / 280 | 50.1%Fiscal year ending 08/2024
Facility
50.1%Fiscal year ending 08/2024
TX AVG
47%
Rank
#236 / 280 | 675759 | ||||
| Garden Terrace at Fort Worth | NH SNF | Fort Worth (Oakmont Boulevard) | 120
Facility
120
TX AVG
79
Rank
#204 / 972 |
30.8%
Facility
30.8%
TX AVG
67.3
Rank
#177 / 195 | -54% | 4.32
Facility
4.32
TX AVG
3.63
Rank
#54 / 273 | -56% | +19% | $34.4k
Facility
$34.4k
TX AVG
$81.8k
Rank
#172 / 278 | 21
Facility
21
TX AVG
25.9
Rank
#138 / 274 | 3.0
Facility
3.0
TX AVG
3.7
Rank
#112 / 274 | 3 | 37 | A+ |
51
Facility
51
TX AVG
41
Rank
#481 / 1389 | Jerry Weeter | $4.3MFiscal year ending 09/2023
Facility
$4.3MFiscal year ending 09/2023
TX AVG
$8.4M
Rank
#266 / 280 | $2.9MFiscal year ending 09/2023
Facility
$2.9MFiscal year ending 09/2023
TX AVG
$3.5M
Rank
#247 / 280 | 67.4%Fiscal year ending 09/2023
Facility
67.4%Fiscal year ending 09/2023
TX AVG
47%
Rank
#25 / 280 | 675650 | ||||
| Village Creek Wellness and Rehabilitation | NH PC SNF | Fort Worth | 100
Facility
100
TX AVG
79
Rank
#354 / 972 |
84.5%
Facility
84.5%
TX AVG
67.3
Rank
#49 / 195 | +26% | 2.80
Facility
2.80
TX AVG
3.63
Rank
#258 / 273 | +16% | -23% | $19.0k
Facility
$19.0k
TX AVG
$81.8k
Rank
#124 / 278 | 19
Facility
19
TX AVG
25.9
Rank
#116 / 274 | 3.8
Facility
3.8
TX AVG
3.7
Rank
#190 / 274 | 2 | 85 | - |
26
Facility
26
TX AVG
41
Rank
#1003 / 1389 | Village Creek Nursing & Rehabilitation LLC | $6.1M*Fiscal year ending 12/2022These figures are from this home's most recent complete cost report — an older period than most facilities report. Compare with that in mind.
Facility
$6.1M*Fiscal year ending 12/2022These figures are from this home's most recent complete cost report — an older period than most facilities report. Compare with that in mind.
TX AVG
$8.4M
Rank
#275 / 280 | $3.4M*Fiscal year ending 12/2022These figures are from this home's most recent complete cost report — an older period than most facilities report. Compare with that in mind.
Facility
$3.4M*Fiscal year ending 12/2022These figures are from this home's most recent complete cost report — an older period than most facilities report. Compare with that in mind.
TX AVG
$3.5M
Rank
#221 / 280 | 55.5%*Fiscal year ending 12/2022These figures are from this home's most recent complete cost report — an older period than most facilities report. Compare with that in mind.
Facility
55.5%*Fiscal year ending 12/2022These figures are from this home's most recent complete cost report — an older period than most facilities report. Compare with that in mind.
TX AVG
47%
Rank
#3 / 280 | 675977 | ||||
| Park View Care Center | NH AL HOS MC SNF | Fort Worth (West Meadowbrook) | 179
Facility
179
TX AVG
79
Rank
#28 / 972 |
71.0%
Facility
71.0%
TX AVG
67.3
Rank
#97 / 195 | +5% | 4.16
Facility
4.16
TX AVG
3.63
Rank
#59 / 273 | -5% | +15% | $299.0k
Facility
$299.0k
TX AVG
$81.8k
Rank
#274 / 278 | 46
Facility
46
TX AVG
25.9
Rank
#248 / 274 | 2.9
Facility
2.9
TX AVG
3.7
Rank
#103 / 274 | 6 | 127 | - |
28
Facility
28
TX AVG
41
Rank
#954 / 1389 | Mathew Bedard | $9.7MFiscal year ending 08/2024
Facility
$9.7MFiscal year ending 08/2024
TX AVG
$8.4M
Rank
#72 / 280 | $0.0kFiscal year ending 08/2024
Facility
$0.0kFiscal year ending 08/2024
TX AVG
$3.5M
Rank
#104 / 280 | 0%Fiscal year ending 08/2024
Facility
0%Fiscal year ending 08/2024
TX AVG
47%
Rank
#218 / 280 | 455606 | ||||
| Marine Creek Nursing and Rehabilitation | NH MC SNF | Fort Worth (Far Greater Northside Historical) | 164
Facility
164
TX AVG
79
Rank
#39 / 972 | - | - | 2.80
Facility
2.80
TX AVG
3.63
Rank
#258 / 273 | +36% | -23% | $23.6k
Facility
$23.6k
TX AVG
$81.8k
Rank
#145 / 278 | 46
Facility
46
TX AVG
25.9
Rank
#248 / 274 | 2.6
Facility
2.6
TX AVG
3.7
Rank
#68 / 274 | 6 | 31 | - |
7
Facility
7
TX AVG
41
Rank
#1272 / 1389 | Marine Creek I Enterprises LLC | $10.8MFiscal year ending 03/2024
Facility
$10.8MFiscal year ending 03/2024
TX AVG
$8.4M
Rank
#96 / 280 | $8.0MFiscal year ending 03/2024
Facility
$8.0MFiscal year ending 03/2024
TX AVG
$3.5M
Rank
#46 / 280 | 74.2%Fiscal year ending 03/2024
Facility
74.2%Fiscal year ending 03/2024
TX AVG
47%
Rank
#35 / 280 | 675779 |
Marine Creek Nursing and Rehabilitation is located in Fort Worth, Texas.
Here are the financial assistance programs available to residents in Texas.
Marine Creek Nursing and Rehabilitation is in the Far Greater Northside Historical neighborhood of Fort Worth.
Marine Creek Nursing and Rehabilitation is legally operated by West Wharton County Hospital District, and administered by Brenda Wright.
Marine Creek Nursing and Rehabilitation has a walk score of 7. Car-dependent. Most errands require a car, with limited nearby walkable options.
According to TX state health department records, Marine Creek Nursing and Rehabilitation's license number is 308592.
According to TX state health department records, Marine Creek Nursing and Rehabilitation's license expires on January 4, 2028.
Marine Creek Nursing and Rehabilitation's occupancy is 71.3%.
Marine Creek Nursing and Rehabilitation has been operating for approximately 27 years, based on available licensing and registration records.
Care Cost Calculator: See Prices in Your Area
Nursing Home Data Explorer
Don’t Wait Too Long: 7 Red Flag Signs Your Parent Needs Assisted Living Now
The True Cost of Assisted Living in 2025 – And How Families Are Paying For It
Understanding Senior Living Costs: Pricing Models, Discounts & Financial Assistance


