Avoca Lodge Assisted Living
Nursing Home & Assisted Living · Avoca, IA
CMS overall rating Info CMS (the Centers for Medicare & Medicaid Services) is the federal agency that rates nursing home quality. Its Overall Rating runs from 1 to 5 stars, combining health inspections, staffing, and quality measures, with inspections weighted most heavily.

Avoca Lodge Assisted Living

Nursing Home & Assisted Living · Avoca, IA
CMS overall rating Info CMS (the Centers for Medicare & Medicaid Services) is the federal agency that rates nursing home quality. Its Overall Rating runs from 1 to 5 stars, combining health inspections, staffing, and quality measures, with inspections weighted most heavily.
Calculator: See prices in your area
Avoca Lodge Assisted Living accepts Medicare, Medicaid, and private pay.

Overview of Avoca Lodge Assisted Living

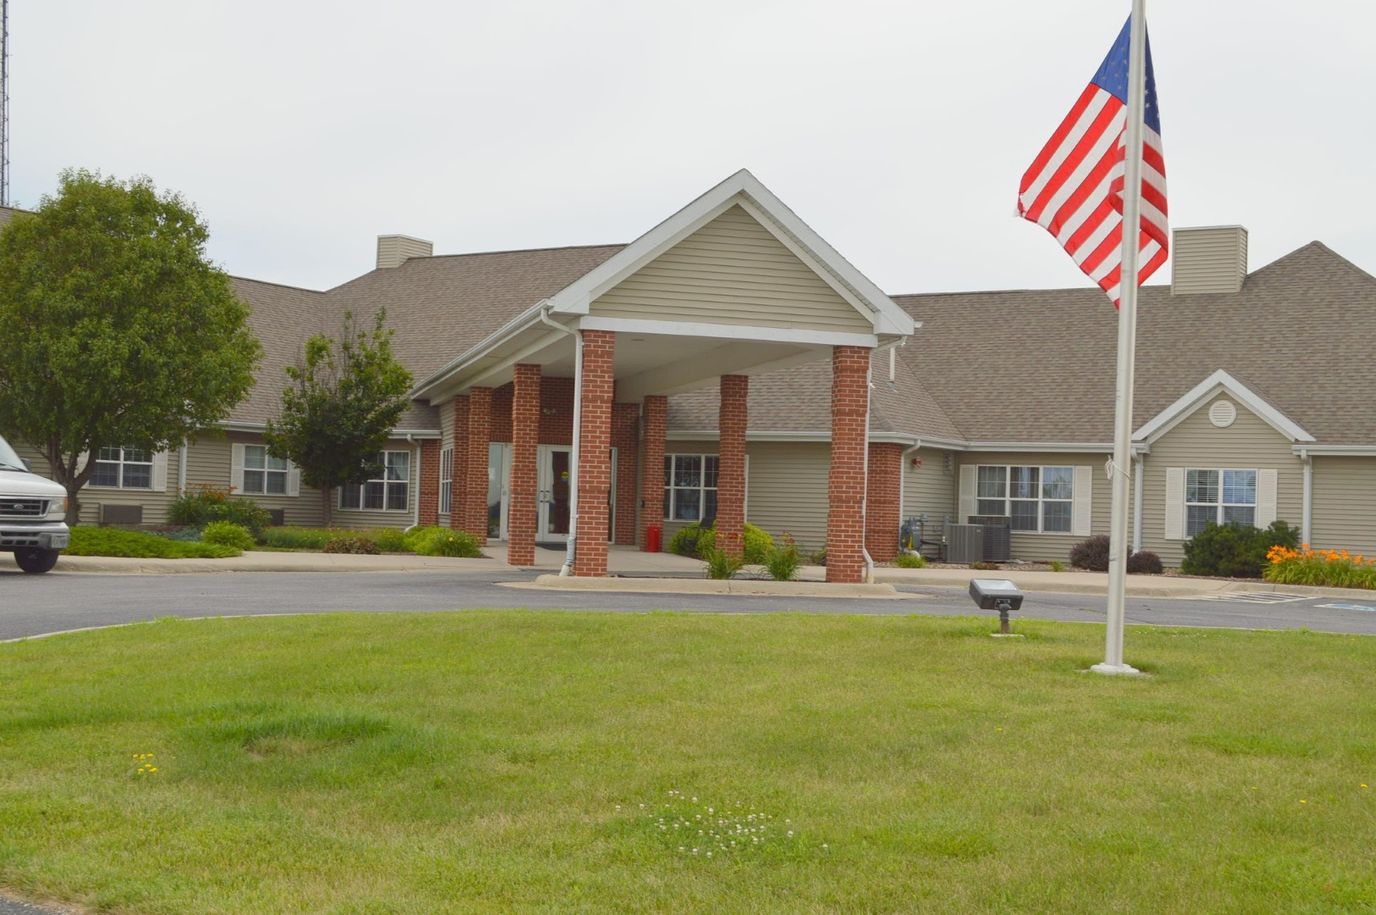
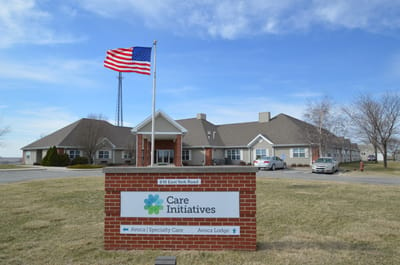
Peacefully nestled in the harmonious neighborhood of Avoca, IA, Avoca Lodge Assisted Living is a blissful haven that offers assisted living. A compassionate and well-trained team provides top-tier care tailored to residents’ daily living activities around the clock. Purposely built and secure accommodations are provided, ensuring residents are comfortable and safe.

Residents are encouraged to live actively and have fun with a well-thought-out calendar of engaging activities and fun recreational programs. Mealtimes promote social interactions and satisfy dietary needs with delicious and healthy dining options. For convenience and safety, medication management is provided. The community is a good option for those seeking exceptional assistance for the finest retirement experience.

Quality ratings

Measured by Centers for Medicare & Medicaid Services (CMS)

Overall rating Info The Overall CMS Rating combines results from health inspections, staffing levels and quality measures. Health inspections carry the most weight. Staffing and quality scores can increase or decrease the final rating based on performance compared to state and national standards.
Health Inspection Info Based on the results of the facility's three most recent standard inspections and any complaint investigations. CMS reviews the number, scope, and severity of deficiencies, with more recent findings weighted more heavily.
Staffing Info Measures average nursing staff hours per resident per day, including Registered Nurses (RNs) and total nursing staff. Ratings are adjusted based on the level of care residents require and are compared to state and national benchmarks.
Quality Measures Info Based on clinical and physical health indicators reported to CMS, such as hospital readmissions, falls, pressure ulcers, and improvements in mobility. These measures reflect how well residents' health needs are being managed.

Staffing hours breakdown

Info Daily nursing hours per resident by staff type, reported to CMS. Higher is generally better — compare this facility to state and national averages to see where staffing stands.

Hours per resident per day — compared to state averages

Total nursing care / resident Info Total adjusted nursing hours per resident per day, combining RN, LPN, and aide time. CMS adjusts this for case-mix so facilities can be fairly compared.
3h 15m per day
Rank #234 / 249Nurse hours — State benchmarkedThis home is ranked 234th out of 249 homes in Iowa. Shows adjusted nurse hours per resident per day benchmarked to the Iowa average, with a ranking across 249 Iowa facilities. More hours mean more direct care. The national average is about 3.5 hrs; below 3.0 is a red flag.Rankings are based only on facilities in Iowa that report data for that category. Facilities without available data are excluded from the ranking.Click the rank badge to see the full State ranking.Click here to see the full State ranking.
vs avg
Staff typeHours / Day / Residentvs state avg
Registered Nurse (RN) Info RNs hold the highest nursing license and can assess residents, interpret test results, and direct care plans. More RN hours per day often signals stronger clinical oversight and faster response to health changes. 49m per day
LPN / LVN Info Licensed Practical Nurses (LPNs) or Licensed Vocational Nurses (LVNs) deliver routine hands-on care — medication administration, wound dressing, and monitoring vital signs. They work under RN supervision and make up a large share of daily bedside care. 20m per day
Nurse Aide Info Certified Nurse Aides (CNAs) provide the most direct day-to-day assistance: bathing, dressing, feeding, and mobility. Nurse aide hours are typically the largest staffing category and directly affect residents' quality of life. 2h 8m per day
Weekend Total Nursing Info Combined nursing hours (RN + LPN + Nurse Aide) per resident per day on weekends. Staffing often drops on weekends — this figure reveals whether the facility maintains adequate coverage outside of weekday hours. 2h 56m per day
Physical Therapist Info Hours per resident per day provided by licensed Physical Therapists (PTs) or PT Assistants. PT services help residents recover mobility after injury or illness and are especially important for post-acute (short-stay) rehabilitation. 2m per day
Weekend RN Info Registered nurse hours specifically on weekends. Facilities sometimes reduce RN presence on Saturdays and Sundays — a low weekend RN figure compared to weekday hours can indicate reduced clinical oversight when most administrative staff are absent. 34m per day

Capacity and availability

Avg. Length of Stay
160 days
Bed community size
40-bed community Rank #325 / 407Bed count — State benchmarkedThis home is ranked 325th out of 407 homes in Iowa. Shows this facility's certified or reported bed count compared to other Iowa facilities. Larger communities may offer more amenities, programs, and on-site services for residents and families.Rankings are based only on facilities in Iowa that report data for that category. Facilities without available data are excluded from the ranking.Click the rank badge to see the full State ranking.Click here to see the full State ranking.
A moderately sized community that may balance personal attention with shared amenities and social activities.
Years in operation
24 years in operation Rank #98 / 282Years in operation — State benchmarkedThis home is ranked 98th out of 282 homes in Iowa. Shows how long this facility has been in operation compared to other Iowa facilities. Longer operating histories may benefit residents, families, and staff.Rankings are based only on facilities in Iowa that report data for that category. Facilities without available data are excluded from the ranking.Click the rank badge to see the full State ranking.Click here to see the full State ranking.
A longer operating history, which may indicate experience navigating regulations and delivering ongoing care.
Walk Score
Walk Score: 0 / 100 Rank #514 / 528Walk Score — State benchmarkedThis home is ranked 514th out of 528 homes in Iowa. Shows how walkable this facility's neighborhood is compared to the average Walk Score across Iowa facilities. Higher scores benefit residents, families, and staff.Rankings are based only on facilities in Iowa that report data for that category. Facilities without available data are excluded from the ranking.Click the rank badge to see the full State ranking.Click here to see the full State ranking.
Car-dependent. Most errands require a car, with limited nearby walkable options.

About this community

License Details

Facility TypeAssisted Living Programs
StatusActive
IssuanceFebruary 28, 2002
ExpirationFebruary 27, 2028
CountyPottawattamie
License NumberS0138
Year Opened02/28/2002

Ownership & Operating Entity

Avoca Lodge Assisted Living is administered by Marquita Monroe.

Therapy & Rehabilitation

1 service
Rehabilitation Services

Staffing & Medical

1 service
Licensed Nurses/CNAs

Additional Services

1 service
Skilled Nursing Care

Contact Information

Fax7123432501

Contact Avoca Lodge Assisted Living

Inspection History

In Iowa, the Department of Inspections, Appeals, and Licensing conducts unannounced health and safety surveys to monitor compliance and protect residents in long-term care settings.

Since 2004 · 22 years of data 8 deficiencies 11 inspections

Inspection Scorecard Info This scorecard compares key inspection, deficiency, and complaint metrics at this facility against the Iowa state average. Metrics rated ≥15% worse than average are highlighted in red; those ≥15% better are highlighted in green.

Since 2004 vs. Iowa state average
Overall vs. IA average 0 Worse No metrics in this bucket. 4 Better Metrics better than Iowa average:
• Total deficiencies (70% below)
• Deficiencies per year (67% below)
• Deficiencies per inspection (61% below)
• Total inspections (27% below)
Latest Inspection July 31, 2025

Deficiencies Info Deficiencies are formal regulatory issues recorded during state inspections.

This FacilityIA Averagevs. IA Avg
Total deficiencies Info Formal regulatory issues recorded by inspectors across all inspection types. 827 This facility has 70% fewer total deficiencies than a typical Iowa assisted living residence (8 vs. IA avg 27).↓ 70% better
Deficiencies per year Info Average deficiencies per year since 2004. 0.41.2 This facility has 67% fewer deficiencies per year than a typical Iowa assisted living residence (0.4 vs. IA avg 1.2).↓ 67% better
Deficiencies per inspection Info Average deficiencies per inspection. 0.71.8 This facility has 61% fewer deficiencies per inspection than a typical Iowa assisted living residence (0.7 vs. IA avg 1.8).↓ 61% better

Inspections Info State inspections evaluate whether the facility meets health and safety standards.

This FacilityIA Averagevs. IA Avg
Total inspections Info Combined count of all routine and focused inspections. Excludes complaint investigations. 1115 This facility has 27% fewer total inspections than a typical Iowa assisted living residence (11 vs. IA avg 15).↓ 27% better

Inspection Reports Summary Info An editor-reviewed summary of the themes and findings across this facility's recent inspection reports.

  • The July 31, 2025 recertification inspection found no regulatory insufficiencies or complaints.
  • The October 31, 2024 complaint investigation confirmed failure to provide required bathing services for one discharged tenant.
  • The April 27, 2023 renewal inspection cited three deficiencies involving tenant health evaluations, 90-day nursing assessments, and food safety training.

Health Inspection History

Inspections since 2023
Total health inspections 8

State average N/A


Last Health inspection on Oct 2025

Total health citations
66 Rank #236 / 250Health citations — State benchmarkedThis home is ranked 236th out of 250 homes in Iowa. Shows this facility's total health deficiency citations benchmarked to the Iowa State average, with a ranking across all 250 IA facilities. Lower citation counts earn a better rank.Rankings are based only on facilities in Iowa that report data for that category. Facilities without available data are excluded from the ranking.Click the rank badge to see the full State ranking.Click here to see the full State ranking.

State average N/A

Citations per inspection
8.25 Rank #236 / 250Citations per inspection — State benchmarkedThis home is ranked 236th out of 250 homes in Iowa. Shows average deficiency citations per CMS inspection for this facility versus the Iowa mean across 250 facilities with citation data. Lower is better.Rankings are based only on facilities in Iowa that report data for that category. Facilities without available data are excluded from the ranking.Click the rank badge to see the full State ranking.Click here to see the full State ranking.

State average N/A


Health citations are formal notices following inspections when they fail to comply with safety and care standards.

34 of 66 citations resulted from standard inspections; 28 of 66 resulted from complaint investigations; and 4 of 66 came from combined inspections (standard and complaint).

Breakdown of citation severity (last 3 years)
Critical health citations
0
In line with State average

State average: N/A


Serious health citations
1
In line with State average

State average: N/A

0 critical citations State average: N/A

1 serious citation State average: N/A

65 moderate citations State average: N/A

0 minor citations State average: N/A
Citations history (last 3 years)
Care Planning moderate citation Oct 07, 2025
Corrected

Quality of Care moderate citation Jun 16, 2025
Corrected

Abuse/Neglect moderate citation May 16, 2025
Corrected

Abuse/Neglect moderate citation May 16, 2025
Corrected

Staffing Data

Reporting period: October 1 – December 31, 2025 (Q4 2025). Source: CMS Payroll-Based Journal report.

Total staff 61
Employees 50
Contractors 11
Staff to resident ratio 1.61 : 1
0% compared with State average

State average ratio: 0 : 0

Avg staff/day 18
Average shift 6.6 hours
0% compared with State average

State average: 0 hours

Total staff hours (quarter) 10,995

Nursing staff breakdown

Q4 2025 · Oct 1 – Dec 31 More info This data comes from the CMS Payroll-Based Journal report covering October 1 – December 31, 2025.
Registered Nurse

Manages medical care and health needs.

RN Staff Info All 7 RN Staff are full-time employees. No contractors work on this role. 7
Average shift length Info Average shift length. Calculated as total hours divided by days worked and average staff per day. 7.6 hours
Licensed Practical Nurse

Assists with medical care and medications.

LPN Staff Info All 4 LPN Staff are full-time employees. No contractors work on this role. 4
Average shift length Info Average shift length. Calculated as total hours divided by days worked and average staff per day. 7.6 hours
Certified Nursing Assistant

Helps with daily care and mobility.

CNA Staff Info All 25 CNA Staff are full-time employees. No contractors work on this role. 25
Average shift length Info Average shift length. Calculated as total hours divided by days worked and average staff per day. 6.8 hours

Contractor staffing

Q4 2025 · Oct 1 – Dec 31 More info This data comes from the CMS Payroll-Based Journal report covering October 1 – December 31, 2025.

Total hours from contractors

6.6%

726 contractor hours this quarter

Physical Therapy Assistant: 3 Qualified Social Worker: 3 Speech Language Pathologist: 2 Respiratory Therapy Technician: 2 Medical Director: 1

Staff by category

Q4 2025 · Oct 1 – Dec 31 More info This data comes from the CMS Payroll-Based Journal report covering October 1 – December 31, 2025.
Certified Nursing Assistant250254,93492100%6.8
Registered Nurse7071,48592100%7.6
Medication Aide/Technician4041,0378491%7.1
Licensed Practical Nurse4049278289%7.6
Administrator2024886267%7.7
Nurse Practitioner2024165155%8
Dietitian1013856672%5.8
Clinical Nurse Specialist3033775155%6.5
Speech Language Pathologist0222826065%4.4
Physical Therapy Assistant0332176672%3
Mental Health Service Worker1011772628%6.8
Respiratory Therapy Technician0221073639%2.9
Qualified Social Worker033754043%1.8
Medical Director0114533%15
Other Dietary Services Staff1014378%6.2
25 Certified Nursing Assistant
% of Days 100%
7 Registered Nurse
% of Days 100%
4 Medication Aide/Technician
% of Days 91%
4 Licensed Practical Nurse
% of Days 89%
2 Administrator
% of Days 67%
2 Nurse Practitioner
% of Days 55%
1 Dietitian
% of Days 72%
3 Clinical Nurse Specialist
% of Days 55%
2 Speech Language Pathologist
% of Days 65%
3 Physical Therapy Assistant
% of Days 72%
1 Mental Health Service Worker
% of Days 28%
2 Respiratory Therapy Technician
% of Days 39%
3 Qualified Social Worker
% of Days 43%
1 Medical Director
% of Days 3%
1 Other Dietary Services Staff
% of Days 8%

Penalties and fines

Federal penalties imposed by CMS for regulatory violations, including civil money penalties (fines) and denials of payment for new Medicare/Medicaid admissions.

Source: CMS Penalties Database

No penalties in the past 3 years

No civil money penalties or payment denials were reported in the last 3 years.

Quality of care over time

These measures show how residents usually do over time at this home, based on health outcomes and preventive care.

High-risk clinical events score Info A composite score based on pressure ulcers, falls with injury, weight loss, walking ability decline, and activities of daily living decline. 11.7
14% worse than State average

State average: 10.2

Functional decline score Info A composite score based on activities of daily living decline, walking ability decline, and incontinence. 24.9
15% worse than State average

State average: 21.6

Long-stay resident measures
Need for Help with Daily Activities Increased Info Percent of long-stay residents whose need for help with daily activities has increased 19.1%
In line with State average

State average: 18.8%

Walking Ability Worsened Info Percent of long-stay residents whose ability to move independently worsened 29.9%
52% worse than State average

State average: 19.7%

Low Risk Residents with Bowel/Bladder Incontinence Info Percent of low risk long-stay residents who lose control of their bowels or bladder 25.7%
In line with State average

State average: 26.2%

Falls with Major Injury Info Percent of long-stay residents experiencing one or more falls with major injury 2.4%
32% better than State average

State average: 3.6%

High Risk Residents with Pressure Ulcers Info Percent of long-stay high risk residents with pressure ulcers 6.1%
39% worse than State average

State average: 4.4%

Urinary Tract Infection Info Percent of long-stay residents with a urinary tract infection 4.1%
64% worse than State average

State average: 2.5%

Lost Too Much Weight Info Percent of long-stay residents who lose too much weight 1.1%
79% better than State average

State average: 5.0%

Depressive Symptoms Info Percent of long-stay residents who have depressive symptoms 5.0%
30% worse than State average

State average: 3.9%

Antipsychotic Use Info Percent of long-stay residents who received an antipsychotic medication 16.4%
14% better than State average

State average: 19.0%

Pneumococcal Vaccine Info Percent of long-stay residents assessed and appropriately given the pneumococcal vaccine 91.9%
In line with State average

State average: 94.4%

Influenza Vaccine Info Percent of long-stay residents assessed and appropriately given the seasonal influenza vaccine 97.3%
In line with State average

State average: 95.3%

Short-stay resident measures
Pneumococcal Vaccine Info Percent of short-stay residents assessed and appropriately given the pneumococcal vaccine 85.8%
In line with State average

State average: 85.1%

Antipsychotic medication increase Info Percent of short-stay residents who newly received an antipsychotic medication 0.0%
100% better than State average

State average: 1.8%

Influenza Vaccine Info Percent of short-stay residents assessed and appropriately given the seasonal influenza vaccine 81.5%
11% better than State average

State average: 73.3%

Breakdown by payment type

Medicare

29% of new residents, usually for short-term rehab.

Typical stay 1 - 2 months

Private pay

43% of new residents, often for short stays.

Typical stay 4 - 5 months

Medicaid

28% of new residents, often for long-term daily care.

Typical stay 10 - 11 months

Facility Characteristics

Source: CMS Long-Term Care Facility Characteristics (Data as of Jan 2026)

Total residents 38
Medicare
2
5.3% of residents
Medicaid
17
44.7% of residents
Private pay or other
19
50% of residents
Programs & Services
Residents Group

Residents meet regularly to discuss policies, care quality, and activities

Family Member Group

Family members meet regularly to discuss policies, care quality, and activities

Clinical Research

Conducts clinical research trials to develop and test new treatments

Active Family Council

Organized group of family members that meets regularly to discuss facility policies, resident care, and activities.

Active Resident Council

Organized group of residents that meets regularly to discuss facility policies, quality of life, and activities.

Finances and operations

Based on CMS SNF Cost Report for fiscal year ending in 12/2023.

For-profit
Corporation
Net patient revenue Info Net patient revenue — what the home actually collects for resident care, after contractual allowances, bad debt and discounts are subtracted from its gross charges (CMS cost report, Worksheet G-3). It covers resident care only; money the home earns from other sources is shown separately as "Other income."
$3.5M
Net patient income Info Net patient income: net patient revenue minus the home's total operating expenses. A positive figure means it earns more from resident care than it spends to deliver it; a negative figure means the opposite. It excludes non-operating "other income."
-$265.7K
For-profit Corporation
Net patient revenue Info Net patient revenue — what the home actually collects for resident care, after contractual allowances, bad debt and discounts are subtracted from its gross charges (CMS cost report, Worksheet G-3). It covers resident care only; money the home earns from other sources is shown separately as "Other income."
$3.5M Rank #142 / 251Revenue — State benchmarkedThis home is ranked 142nd out of 251 homes in Iowa. Shows this facility's annual revenue compared to the Iowa average. Higher revenue generally means more resources for staffing and capital — read alongside Payroll %.Rankings are based only on facilities in Iowa that report data for that category. Facilities without available data are excluded from the ranking.Click the rank badge to see the full State ranking.Click here to see the full State ranking.
Net patient income Info Net patient income: net patient revenue minus the home's total operating expenses. A positive figure means it earns more from resident care than it spends to deliver it; a negative figure means the opposite. It excludes non-operating "other income."
-$265.7K
Other income Info Money the home earns outside of resident care — such as investments, grants, rentals and other non-operating sources (CMS cost report, Worksheet G-3). It is tracked separately from net patient revenue: it is not part of that figure, and it is not included in net patient income.
$16.5K
Payroll costs Info Staff salaries plus wage-related costs — benefits such as payroll taxes, health insurance and retirement — from the home's own accounting records (CMS cost report, Worksheet A). Contract or agency labor is counted separately, under other operating costs. Rank #225 / 251Payroll — State benchmarkedThis home is ranked 225th out of 251 homes in Iowa. Shows total annual staff payroll benchmarked to the Iowa average. Higher payroll investment relative to peers often signals better staffing and less reliance on cheaper contract labor.Rankings are based only on facilities in Iowa that report data for that category. Facilities without available data are excluded from the ranking.Click the rank badge to see the full State ranking.Click here to see the full State ranking.
$1.9M 53.6% of net patient revenue Info Payroll as a share of revenue: staff salaries and wage-related benefits divided by net patient revenue. A higher figure means more of each revenue dollar goes to staff pay. Rank #243 / 251Payroll % — State benchmarkedThis home is ranked 243rd out of 251 homes in Iowa. Shows payroll as a percentage of revenue versus the Iowa average. Well-run Iowa facilities typically land around 61–69% — the top third Statewide. Below 25% may signal understaffing or heavy agency use — read with Staffing ratings.Rankings are based only on facilities in Iowa that report data for that category. Facilities without available data are excluded from the ranking.Click the rank badge to see the full State ranking.Click here to see the full State ranking.
Other operating costs Info Everything it costs to run the home apart from payroll — food, utilities, supplies, maintenance, contract labor and administration. Calculated as total operating expense minus payroll (staff salaries and wage-related benefits).
$1.9M
Total costs Info The home's total operating expense for the year — all the costs of running it, salaries included (CMS cost report, Worksheet G-3).
$3.7M

What does this home offer?

Housing options icon

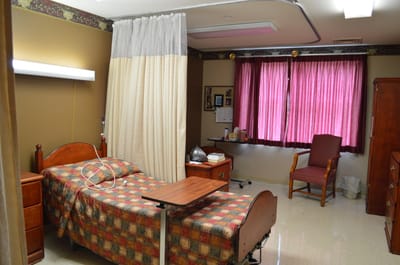
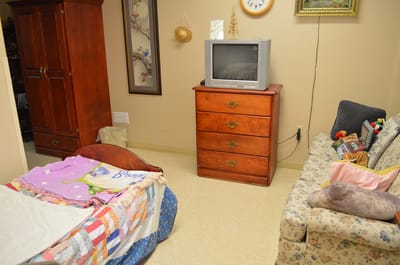
Housing Options: Semi-Private / 1 Bed

Building type icon
Building type icon

Building Type: Single-story

Housekeeping icon
Housekeeping icon

Housekeeping Services

Social and recreational activities icon

Social and Recreational Activities

Who this home usually serves

TYPE OF STAY

Mix of rehab and long-term care

This home supports both short-term rehab and long-term care, with residents staying for a wide range of durations.

New residents most often arrive under private pay (43% of admissions), and a typical private pay stay runs around 4 - 5 months.

Admissions
89 total

Coverage residents most often arrive under.

Medicare 29%
Private pay 43%
Medicaid 28%
Discharges
84 total

Coverage residents most often leave under.

Medicare 29%
Private pay 49%
Medicaid 23%

Places of interest near Avoca Lodge Assisted Living

Address 3.2 miles from city center Info Estimated distance in miles from Avoca's city center to Avoca Lodge Assisted Living's address, calculated via Google Maps.

Calculate Travel Distance to Avoca Lodge Assisted Living

Add your location

Address

Compare Nursing Homes around the area

The information below is reported by the Iowa Department of Inspections, Appeals, and Licensing.

Avoca Lodge Assisted Living
NH
AL
Avoca -40 - 0 Semi-Private / 1 Bed
Valley View Village
NH
AL
HC
IL
MC
RC
Des Moines (Fairmont Park) -79 - 38 Studio / 1 Bed / 2 Bed

Frequently Asked Questions about Avoca Lodge Assisted Living

What is the license number of Avoca Lodge Assisted Living?

According to IA state health department records, Avoca Lodge Assisted Living's license number is S0138.

When does Avoca Lodge Assisted Living's license expire?

According to IA state health department records, Avoca Lodge Assisted Living's license expires on February 27, 2028.

What is the occupancy rate at Avoca Lodge Assisted Living?

Avoca Lodge Assisted Living's occupancy is 80.1%.

What is the best email address for Avoca Lodge Assisted Living?

The team at Avoca Lodge Assisted Living can be reached at mmonroe@careinitiatives.org.

Does Avoca Lodge Assisted Living operate as a for-profit or non-profit?

Avoca Lodge Assisted Living is registered as a for-profit in IA.

Who is the administrator of Avoca Lodge Assisted Living?

Marquita Monroe is the administrator of Avoca Lodge Assisted Living.

How many beds does Avoca Lodge Assisted Living have?

Avoca Lodge Assisted Living has 40 beds.

Guides for Better Senior Living

Care Cost Calculator: See Prices in Your Area

Nursing Home Data Explorer

Don’t Wait Too Long: 7 Red Flag Signs Your Parent Needs Assisted Living Now

The True Cost of Assisted Living in 2025 – And How Families Are Paying For It

Understanding Senior Living Costs: Pricing Models, Discounts & Financial Assistance