Azria Health Prairie Ridge
Nursing Home & Assisted Living · Mediapolis, IA
CMS overall rating Info CMS (the Centers for Medicare & Medicaid Services) is the federal agency that rates nursing home quality. Its Overall Rating runs from 1 to 5 stars, combining health inspections, staffing, and quality measures, with inspections weighted most heavily.

Azria Health Prairie Ridge

Nursing Home & Assisted Living · Mediapolis, IA
CMS overall rating Info CMS (the Centers for Medicare & Medicaid Services) is the federal agency that rates nursing home quality. Its Overall Rating runs from 1 to 5 stars, combining health inspections, staffing, and quality measures, with inspections weighted most heavily.
Calculator: See prices in your area
Azria Health Prairie Ridge accepts Medicare, Medicaid, and private pay.

Overview of Azria Health Prairie Ridge

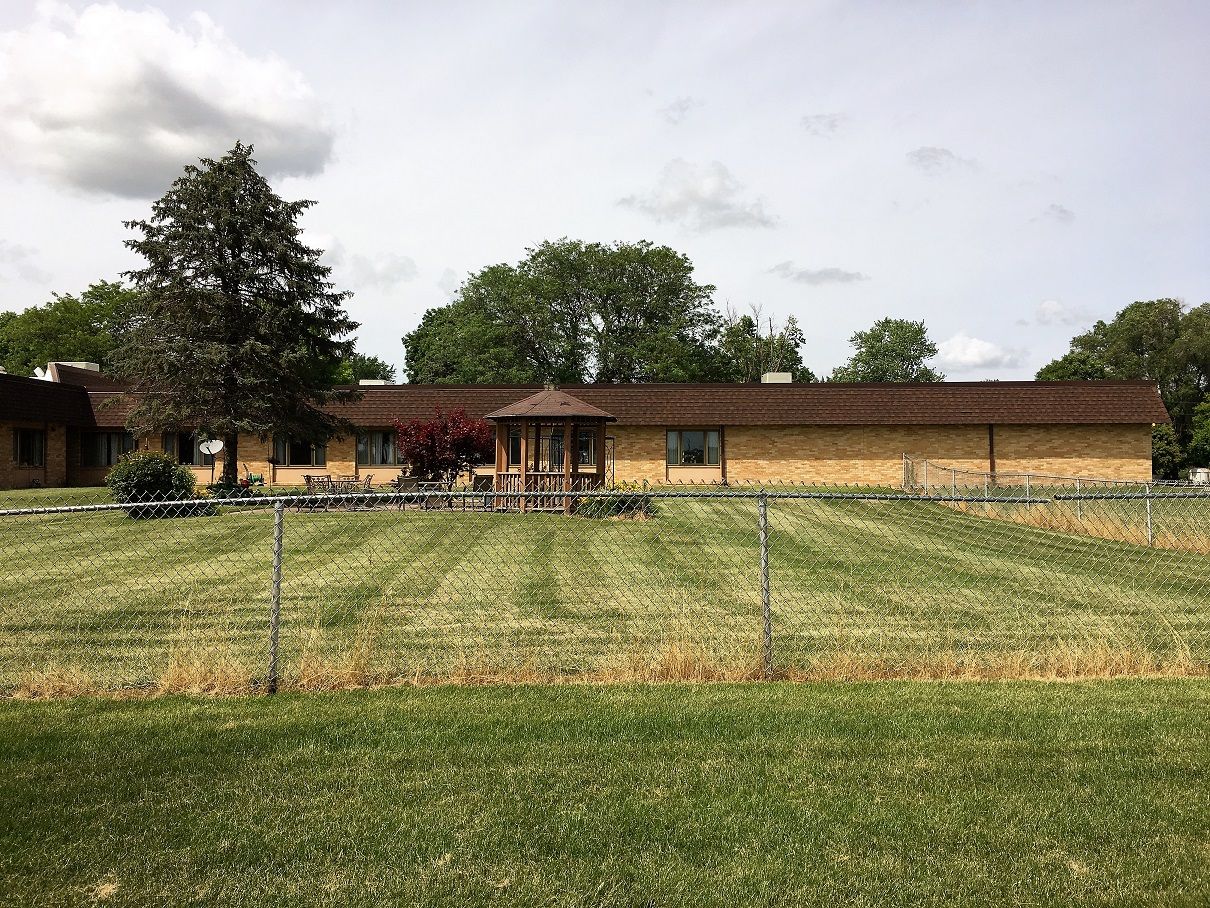
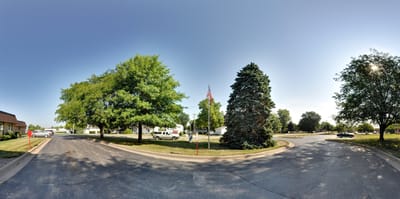
Located in a moderately walkable area, Azria Health Prairie Ridge is a nursing home owned by Pearl Bauder. Some nearby errands and services are within walking distance. The facility accepts Medicare, Medicaid, and private pay, so families can stay flexible when arranging coverage.

The home focuses on post-acute rehabilitation and specialized care. Residents stay an average of 123 days, which includes those recovering from hospital stays and receiving short-term skilled nursing care. Rehabilitation services are available, and the facility also offers respite care. There’s a doctor on staff, and staffing is available 24 hours a day.

Daily nursing care averages 4 hours and 5 minutes per resident. Registered nurses provide 31 minutes of that care, while nurse aides contribute 2 hours and 18 minutes. LPN/LVN staff add another 27 minutes each day. Registered nurses, nurse aides, and LPN/LVN staff work together to provide the hands-on support residents receive throughout the day.

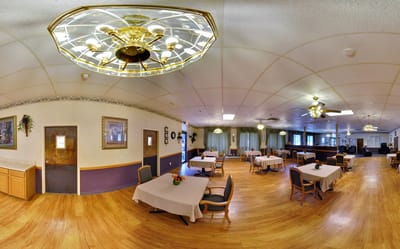
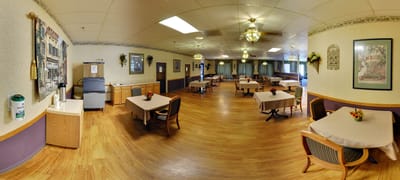
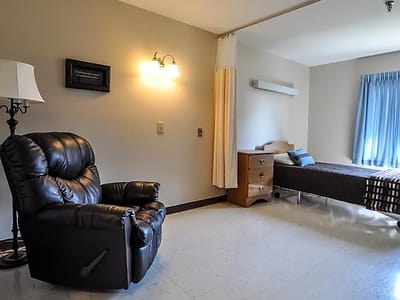
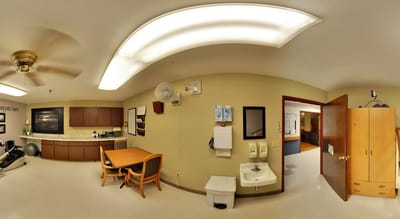
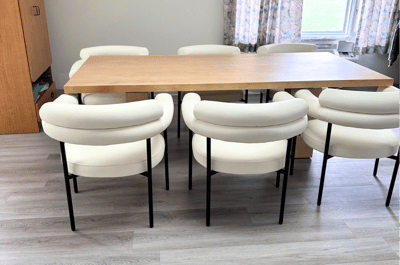
Residents are served chef-prepared meals, and a private dining room is available for those who prefer a quieter setting. The home also includes a beauty salon, spa services, complimentary Wi-Fi, laundry services, and interpreter support. Pet visitation is available, too. It’s a mix of services and amenities that support both residents and visiting family members.

Quality ratings

Measured by Centers for Medicare & Medicaid Services (CMS)

Overall rating Info The Overall CMS Rating combines results from health inspections, staffing levels and quality measures. Health inspections carry the most weight. Staffing and quality scores can increase or decrease the final rating based on performance compared to state and national standards.
Health Inspection Info Based on the results of the facility's three most recent standard inspections and any complaint investigations. CMS reviews the number, scope, and severity of deficiencies, with more recent findings weighted more heavily.
Staffing Info Measures average nursing staff hours per resident per day, including Registered Nurses (RNs) and total nursing staff. Ratings are adjusted based on the level of care residents require and are compared to state and national benchmarks.
Quality Measures Info Based on clinical and physical health indicators reported to CMS, such as hospital readmissions, falls, pressure ulcers, and improvements in mobility. These measures reflect how well residents' health needs are being managed.

Staffing hours breakdown

Info Daily nursing hours per resident by staff type, reported to CMS. Higher is generally better — compare this facility to state and national averages to see where staffing stands.

Hours per resident per day — compared to state averages

Total nursing care / resident Info Total adjusted nursing hours per resident per day, combining RN, LPN, and aide time. CMS adjusts this for case-mix so facilities can be fairly compared.
4h 5m per day
Rank #139 / 249Nurse hours — State benchmarkedThis home is ranked 139th out of 249 homes in Iowa. Shows adjusted nurse hours per resident per day benchmarked to the Iowa average, with a ranking across 249 Iowa facilities. More hours mean more direct care. The national average is about 3.5 hrs; below 3.0 is a red flag.Rankings are based only on facilities in Iowa that report data for that category. Facilities without available data are excluded from the ranking.Click the rank badge to see the full State ranking.Click here to see the full State ranking.
vs avg

5 of 6 metrics below state avg

Standout metric Physical Therapist is +21% above state avg
Staff typeHours / Day / Residentvs state avg
Registered Nurse (RN) Info RNs hold the highest nursing license and can assess residents, interpret test results, and direct care plans. More RN hours per day often signals stronger clinical oversight and faster response to health changes. 31m per day ▼ 29% State avg: 44m per day · National avg: 41m per day
LPN / LVN Info Licensed Practical Nurses (LPNs) or Licensed Vocational Nurses (LVNs) deliver routine hands-on care — medication administration, wound dressing, and monitoring vital signs. They work under RN supervision and make up a large share of daily bedside care. 27m per day ▼ 21% State avg: 34m per day · National avg: 52m per day
Nurse Aide Info Certified Nurse Aides (CNAs) provide the most direct day-to-day assistance: bathing, dressing, feeding, and mobility. Nurse aide hours are typically the largest staffing category and directly affect residents' quality of life. 2h 18m per day ▼ 9% State avg: 2h 32m per day · National avg: 2h 20m per day
Weekend Total Nursing Info Combined nursing hours (RN + LPN + Nurse Aide) per resident per day on weekends. Staffing often drops on weekends — this figure reveals whether the facility maintains adequate coverage outside of weekday hours. 2h 51m per day ▼ 15% State avg: 3h 21m per day · National avg: 3h 26m per day
Physical Therapist Info Hours per resident per day provided by licensed Physical Therapists (PTs) or PT Assistants. PT services help residents recover mobility after injury or illness and are especially important for post-acute (short-stay) rehabilitation. 2m per day ▲ 21% State avg: 2m per day · National avg: 4m per day
Weekend RN Info Registered nurse hours specifically on weekends. Facilities sometimes reduce RN presence on Saturdays and Sundays — a low weekend RN figure compared to weekday hours can indicate reduced clinical oversight when most administrative staff are absent. 17m per day ▼ 44% State avg: 30m per day · National avg: 28m per day

Capacity and availability

This home usually has availability

Lower occupancy than the state average
Occupancy rate
81.5% Rank #114 / 407Occupancy rate — State benchmarkedThis home is ranked 114th out of 407 homes in Iowa. Shows this facility's occupancy rate versus the Iowa average, with its Statewide rank out of 407. Higher occupancy signals strong local demand and financial stability.Rankings are based only on facilities in Iowa that report data for that category. Facilities without available data are excluded from the ranking.Click the rank badge to see the full State ranking.Click here to see the full State ranking.
Avg. Length of Stay
123 days
Bed community size
62-bed community Rank #202 / 407Bed count — State benchmarkedThis home is ranked 202nd out of 407 homes in Iowa. Shows this facility's certified or reported bed count compared to other Iowa facilities. Larger communities may offer more amenities, programs, and on-site services for residents and families.Rankings are based only on facilities in Iowa that report data for that category. Facilities without available data are excluded from the ranking.Click the rank badge to see the full State ranking.Click here to see the full State ranking.
A moderately sized community that may balance personal attention with shared amenities and social activities.
Walk Score
Walk Score: 52 / 100 Rank #202 / 528Walk Score — State benchmarkedThis home is ranked 202nd out of 528 homes in Iowa. Shows how walkable this facility's neighborhood is compared to the average Walk Score across Iowa facilities. Higher scores benefit residents, families, and staff.Rankings are based only on facilities in Iowa that report data for that category. Facilities without available data are excluded from the ranking.Click the rank badge to see the full State ranking.Click here to see the full State ranking.
Moderately walkable. Some errands can be accomplished on foot, with a mix of nearby amenities.

About this community

License Details

AccreditationsMember of Iowa Health Care Association, Member of American Healthcare Association, Medicare and Medicaid approved facility.

Payment & Insurance

2 services
Accept Medicaid
Accept Medicare

Therapy & Rehabilitation

3 services
Rehabilitation Services
Respite Care
Short-Term Rehab

Staffing & Medical

2 services
Doctor on Staff
24-Hour Staffing

Amenities & Lifestyle

Complimentary Wi-Fi
Chef-Prepared Menus
Private Dining Room
Beauty Salon And Spa Services
Interpreters
Pet Visitation
Laundry Services
Specific ProgramsPost-Acute Rehabilitation, Specialized Care Programs

Contact Azria Health Prairie Ridge

Staffing Data

Reporting period: October 1 – December 31, 2025 (Q4 2025). Source: CMS Payroll-Based Journal report.

Total staff 137
Employees 77
Contractors 60
Staff to resident ratio 2.58 : 1
0% compared with State average

State average ratio: 0 : 0

Avg staff/day 33
Average shift 6.9 hours
0% compared with State average

State average: 0 hours

Total staff hours (quarter) 20,917

Nursing staff breakdown

Q4 2025 · Oct 1 – Dec 31 More info This data comes from the CMS Payroll-Based Journal report covering October 1 – December 31, 2025.
Registered Nurse

Manages medical care and health needs.

RN Staff Info 10 total: 6 full-time employees and 4 contractors. 10
Average shift length Info Average shift length. Calculated as total hours divided by days worked and average staff per day. 7.7 hours
Licensed Practical Nurse

Assists with medical care and medications.

LPN Staff Info 15 total: 7 full-time employees and 8 contractors. 15
Average shift length Info Average shift length. Calculated as total hours divided by days worked and average staff per day. 7.7 hours
Certified Nursing Assistant

Helps with daily care and mobility.

CNA Staff Info 83 total: 50 full-time employees and 33 contractors. 83
Average shift length Info Average shift length. Calculated as total hours divided by days worked and average staff per day. 7.2 hours

Contractor staffing

Q4 2025 · Oct 1 – Dec 31 More info This data comes from the CMS Payroll-Based Journal report covering October 1 – December 31, 2025.

Total hours from contractors

12.4%

2,601 contractor hours this quarter

Certified Nursing Assistant: 33 Licensed Practical Nurse: 8 Speech Language Pathologist: 6 Registered Nurse: 4 Physical Therapy Aide: 2 Physical Therapy Assistant: 2 Respiratory Therapy Technician: 1 Qualified Social Worker: 1 Occupational Therapy Aide: 1 Occupational Therapy Assistant: 1 Medical Director: 1

Staff by category

Q4 2025 · Oct 1 – Dec 31 More info This data comes from the CMS Payroll-Based Journal report covering October 1 – December 31, 2025.
Certified Nursing Assistant50338311,24092100%7.2
Licensed Practical Nurse78151,97992100%7.7
Registered Nurse64101,94592100%7.7
Medication Aide/Technician7071,3546166%8.2
Dietitian1015386672%8.2
Administrator1015286672%8
Nurse Practitioner1015206672%7.9
RN Director of Nursing1014675863%8
Speech Language Pathologist0664556470%4.9
Mental Health Service Worker1014456065%7.4
Clinical Nurse Specialist2023895155%7.3
Physical Therapy Aide0223178491%3
Physical Therapy Assistant0222294852%4.8
Respiratory Therapy Technician0112214852%4.6
Qualified Social Worker0111276672%1.9
Occupational Therapy Aide0111104145%2.7
Occupational Therapy Assistant011421112%3.8
Medical Director011131314%1
83 Certified Nursing Assistant
% of Days 100%
15 Licensed Practical Nurse
% of Days 100%
10 Registered Nurse
% of Days 100%
7 Medication Aide/Technician
% of Days 66%
1 Dietitian
% of Days 72%
1 Administrator
% of Days 72%
1 Nurse Practitioner
% of Days 72%
1 RN Director of Nursing
% of Days 63%
6 Speech Language Pathologist
% of Days 70%
1 Mental Health Service Worker
% of Days 65%
2 Clinical Nurse Specialist
% of Days 55%
2 Physical Therapy Aide
% of Days 91%
2 Physical Therapy Assistant
% of Days 52%
1 Respiratory Therapy Technician
% of Days 52%
1 Qualified Social Worker
% of Days 72%
1 Occupational Therapy Aide
% of Days 45%
1 Occupational Therapy Assistant
% of Days 12%
1 Medical Director
% of Days 14%

Penalties and fines

Federal penalties imposed by CMS for regulatory violations, including civil money penalties (fines) and denials of payment for new Medicare/Medicaid admissions.

Source: CMS Penalties Database

No penalties in the past 3 years

No civil money penalties or payment denials were reported in the last 3 years.

Quality of care over time

These measures show how residents usually do over time at this home, based on health outcomes and preventive care.

High-risk clinical events score Info A composite score based on pressure ulcers, falls with injury, weight loss, walking ability decline, and activities of daily living decline. 13.0
27% worse than State average

State average: 10.2

Functional decline score Info A composite score based on activities of daily living decline, walking ability decline, and incontinence. 26.8
24% worse than State average

State average: 21.6

Long-stay resident measures
Average State avg: 3.3 Info CMS star rating based on long-stay quality measure performance. 5 stars = significantly above average, 1 star = significantly below average.
Need for Help with Daily Activities Increased Info Percent of long-stay residents whose need for help with daily activities has increased 30.5%
62% worse than State average

State average: 18.8%

Walking Ability Worsened Info Percent of long-stay residents whose ability to move independently worsened 24.2%
23% worse than State average

State average: 19.7%

Low Risk Residents with Bowel/Bladder Incontinence Info Percent of low risk long-stay residents who lose control of their bowels or bladder 25.7%
In line with State average

State average: 26.2%

Falls with Major Injury Info Percent of long-stay residents experiencing one or more falls with major injury 3.1%
13% better than State average

State average: 3.6%

High Risk Residents with Pressure Ulcers Info Percent of long-stay high risk residents with pressure ulcers 3.6%
18% better than State average

State average: 4.4%

Urinary Tract Infection Info Percent of long-stay residents with a urinary tract infection 7.5%
204% worse than State average

State average: 2.5%

Lost Too Much Weight Info Percent of long-stay residents who lose too much weight 3.4%
33% better than State average

State average: 5.0%

Depressive Symptoms Info Percent of long-stay residents who have depressive symptoms 1.2%
70% better than State average

State average: 3.9%

Antipsychotic Use Info Percent of long-stay residents who received an antipsychotic medication 11.1%
42% better than State average

State average: 19.0%

Pneumococcal Vaccine Info Percent of long-stay residents assessed and appropriately given the pneumococcal vaccine 84.3%
11% worse than State average

State average: 94.4%

Influenza Vaccine Info Percent of long-stay residents assessed and appropriately given the seasonal influenza vaccine 91.2%
In line with State average

State average: 95.3%

Hospitalizations per 1,000 days Info Number of hospitalizations per 1,000 long-stay resident days. 1.05
29% better than State average

State average: 1.48

ED visits per 1,000 days Info Number of outpatient emergency department visits per 1,000 long-stay resident days. 1.58
24% better than State average

State average: 2.09

Short-stay resident measures
Below average State avg: 2.6 Info CMS star rating based on short-stay quality measure performance. 5 stars = much above average, 1 star = much below average.
Pneumococcal Vaccine Info Percent of short-stay residents assessed and appropriately given the pneumococcal vaccine 71.3%
16% worse than State average

State average: 85.1%

Antipsychotic medication increase Info Percent of short-stay residents who newly received an antipsychotic medication 0.0%
100% better than State average

State average: 1.8%

Influenza Vaccine Info Percent of short-stay residents assessed and appropriately given the seasonal influenza vaccine 81.1%
11% better than State average

State average: 73.3%

Re-hospitalized after SNF stay Info Percentage of short-stay residents who were re-hospitalized after their nursing home admission. 21.9%
In line with State average

State average: 21.3%

Emergency department visits Info Percentage of short-stay residents who had an outpatient emergency department visit. 24.9%
90% worse than State average

State average: 13.1%

Falls with major injury Info Percentage of SNF residents who experience falls with major injury during their stay. 1.8%
132% worse than State average

State average: 0.8%

Ability to care for self at discharge Info Percentage of residents at or above expected ability to care for themselves at discharge. 35.9%
33% worse than State average

State average: 53.7%

Successful return to home or community Info Rate of successful return to home or community from a skilled nursing facility. 46.4%
8% worse than State average

State average: 50.6%

Breakdown by payment type

Medicare

45% of new residents, usually for short-term rehab.

Typical stay 1 - 2 months

Private pay

54% of new residents, often for short stays.

Typical stay 2 - 3 months

Medicaid

1% of new residents, often for long-term daily care.

Typical stay 17 - 18 years

Facility Characteristics

Source: CMS Long-Term Care Facility Characteristics (Data as of Jan 2026)

Total residents 53
Medicare
5
9.4% of residents
Medicaid
27
50.9% of residents
Private pay or other
21
39.6% of residents
Programs & Services
Residents Group

Residents meet regularly to discuss policies, care quality, and activities

Nurse Aide Training

State-approved Nurse Aide Training and Competency Evaluation Program on-site

Active Resident Council

Organized group of residents that meets regularly to discuss facility policies, quality of life, and activities.

Finances and operations

Based on CMS SNF Cost Report for fiscal year ending in 12/2023.

For-profit
Corporation
Net patient revenue Info Net patient revenue — what the home actually collects for resident care, after contractual allowances, bad debt and discounts are subtracted from its gross charges (CMS cost report, Worksheet G-3). It covers resident care only; money the home earns from other sources is shown separately as "Other income."
$6.1M
Net patient income Info Net patient income: net patient revenue minus the home's total operating expenses. A positive figure means it earns more from resident care than it spends to deliver it; a negative figure means the opposite. It excludes non-operating "other income."
$16.3K
For-profit Corporation
Net patient revenue Info Net patient revenue — what the home actually collects for resident care, after contractual allowances, bad debt and discounts are subtracted from its gross charges (CMS cost report, Worksheet G-3). It covers resident care only; money the home earns from other sources is shown separately as "Other income."
$6.1M Rank #125 / 251Revenue — State benchmarkedThis home is ranked 125th out of 251 homes in Iowa. Shows this facility's annual revenue compared to the Iowa average. Higher revenue generally means more resources for staffing and capital — read alongside Payroll %.Rankings are based only on facilities in Iowa that report data for that category. Facilities without available data are excluded from the ranking.Click the rank badge to see the full State ranking.Click here to see the full State ranking.
Net patient income Info Net patient income: net patient revenue minus the home's total operating expenses. A positive figure means it earns more from resident care than it spends to deliver it; a negative figure means the opposite. It excludes non-operating "other income."
$16.3K
Other income Info Money the home earns outside of resident care — such as investments, grants, rentals and other non-operating sources (CMS cost report, Worksheet G-3). It is tracked separately from net patient revenue: it is not part of that figure, and it is not included in net patient income.
$372.2K
Payroll costs Info Staff salaries plus wage-related costs — benefits such as payroll taxes, health insurance and retirement — from the home's own accounting records (CMS cost report, Worksheet A). Contract or agency labor is counted separately, under other operating costs. Rank #187 / 251Payroll — State benchmarkedThis home is ranked 187th out of 251 homes in Iowa. Shows total annual staff payroll benchmarked to the Iowa average. Higher payroll investment relative to peers often signals better staffing and less reliance on cheaper contract labor.Rankings are based only on facilities in Iowa that report data for that category. Facilities without available data are excluded from the ranking.Click the rank badge to see the full State ranking.Click here to see the full State ranking.
$2.7M 43.6% of net patient revenue Info Payroll as a share of revenue: staff salaries and wage-related benefits divided by net patient revenue. A higher figure means more of each revenue dollar goes to staff pay. Rank #230 / 251Payroll % — State benchmarkedThis home is ranked 230th out of 251 homes in Iowa. Shows payroll as a percentage of revenue versus the Iowa average. Well-run Iowa facilities typically land around 61–69% — the top third Statewide. Below 25% may signal understaffing or heavy agency use — read with Staffing ratings.Rankings are based only on facilities in Iowa that report data for that category. Facilities without available data are excluded from the ranking.Click the rank badge to see the full State ranking.Click here to see the full State ranking.
Other operating costs Info Everything it costs to run the home apart from payroll — food, utilities, supplies, maintenance, contract labor and administration. Calculated as total operating expense minus payroll (staff salaries and wage-related benefits).
$3.4M
Total costs Info The home's total operating expense for the year — all the costs of running it, salaries included (CMS cost report, Worksheet G-3).
$6.1M

Who this home usually serves

TYPE OF STAY

Mix of rehab and long-term care

This home supports both short-term rehab and long-term care, with residents staying for a wide range of durations.

Most new residents arrive under private pay (54% of admissions), and a typical private pay stay runs around 2 - 3 months.

Admissions
152 total

Coverage residents most often arrive under.

Medicare 45%
Private pay 54%
Medicaid 1%
Discharges
150 total

Coverage residents most often leave under.

Medicare 39%
Private pay 60%
Medicaid 1%

Places of interest near Azria Health Prairie Ridge

Address 0.0 miles from city center Info Estimated distance in miles from Mediapolis's city center to Azria Health Prairie Ridge's address, calculated via Google Maps.

Calculate Travel Distance to Azria Health Prairie Ridge

Add your location

Address

Compare Nursing Homes around the area

The information below is reported by the Iowa Department of Inspections, Appeals, and Licensing.

Azria Health Prairie Ridge
NH
AL
Mediapolis -62 - 52 -
Valley View Village
NH
AL
HC
IL
MC
RC
Des Moines (Fairmont Park) -79 - 38 Studio / 1 Bed / 2 Bed
Ramsey Village Continuing Care
NH
AL
IL
MC
RC
Des Moines (Drake) -78 - 38 1 bed / 2 bed
Ridgecrest Village
NH
AL
IL
MC
Davenport (Northwest Boulevard) -82 - 41 Studio / 1 Bed / 2 Bed
Mill Pond
NH
AL
IL
MC
Ankeny -60 - 16 Studio / 1 Bed / 2 Bed

Frequently Asked Questions about Azria Health Prairie Ridge

Is Azria Health Prairie Ridge in a walkable area?

Azria Health Prairie Ridge has a walk score of 52. Moderately walkable. Some errands can be accomplished on foot, with a mix of nearby amenities.

What is the occupancy rate at Azria Health Prairie Ridge?

Azria Health Prairie Ridge's occupancy is 81.5%.

Does Azria Health Prairie Ridge operate as a for-profit or non-profit?

Azria Health Prairie Ridge is registered as a for-profit.

Are there photos of Azria Health Prairie Ridge?

Yes — there are 12 photos of Azria Health Prairie Ridge in the photo gallery on this page.

What is the address of Azria Health Prairie Ridge?

Azria Health Prairie Ridge is located at 608 Prairie Street, Mediapolis, Ia 526370815.

What is the phone number of Azria Health Prairie Ridge?

(319) 394-3991 will put you in contact with the team at Azria Health Prairie Ridge.

Is Azria Health Prairie Ridge Medicare or Medicaid certified?

Yes — Azria Health Prairie Ridge is a CMS-certified provider of Medicare and Medicaid.

Guides for Better Senior Living

Care Cost Calculator: See Prices in Your Area

Nursing Home Data Explorer

Don’t Wait Too Long: 7 Red Flag Signs Your Parent Needs Assisted Living Now

The True Cost of Assisted Living in 2025 – And How Families Are Paying For It

Understanding Senior Living Costs: Pricing Models, Discounts & Financial Assistance