Total health inspections
32
California average 12.5
Last Health inspection on Aug 2025

We arrange tours, appointments, and even moving support so you don’t have to
Thank you for your interest!
Our team will be in touch shortly to help with next steps.
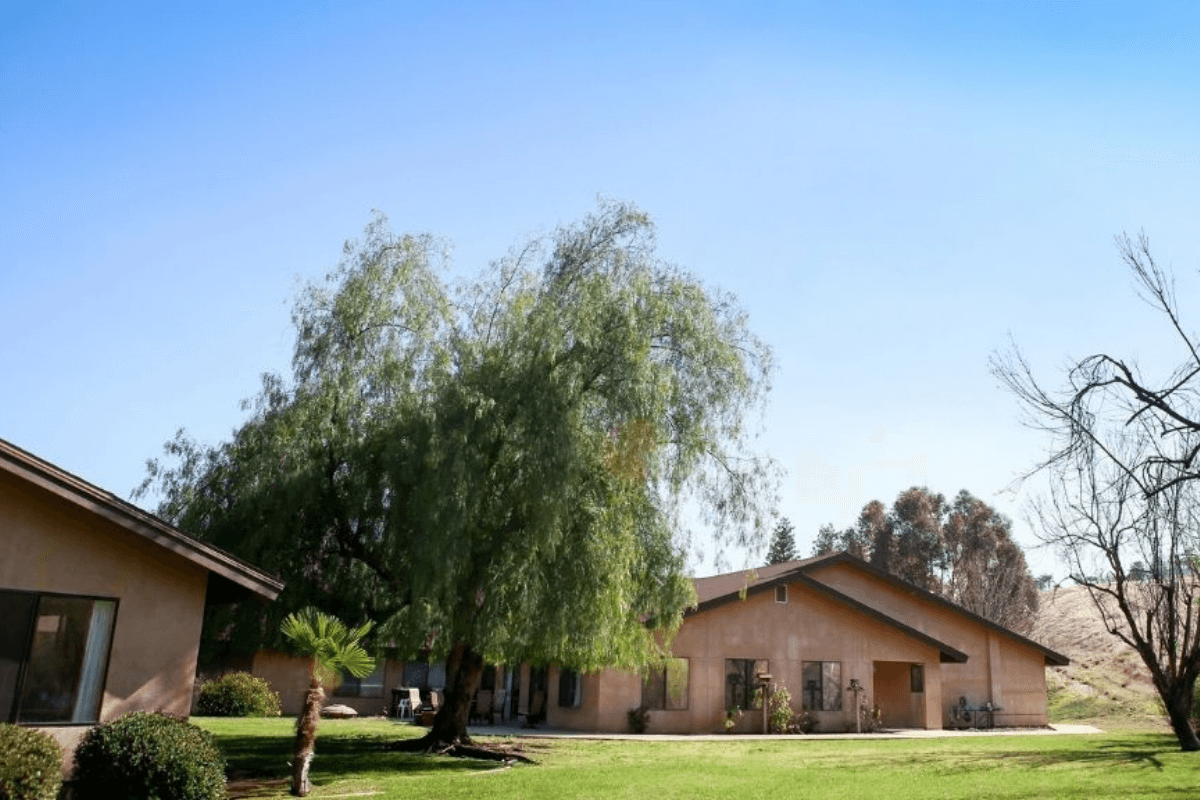
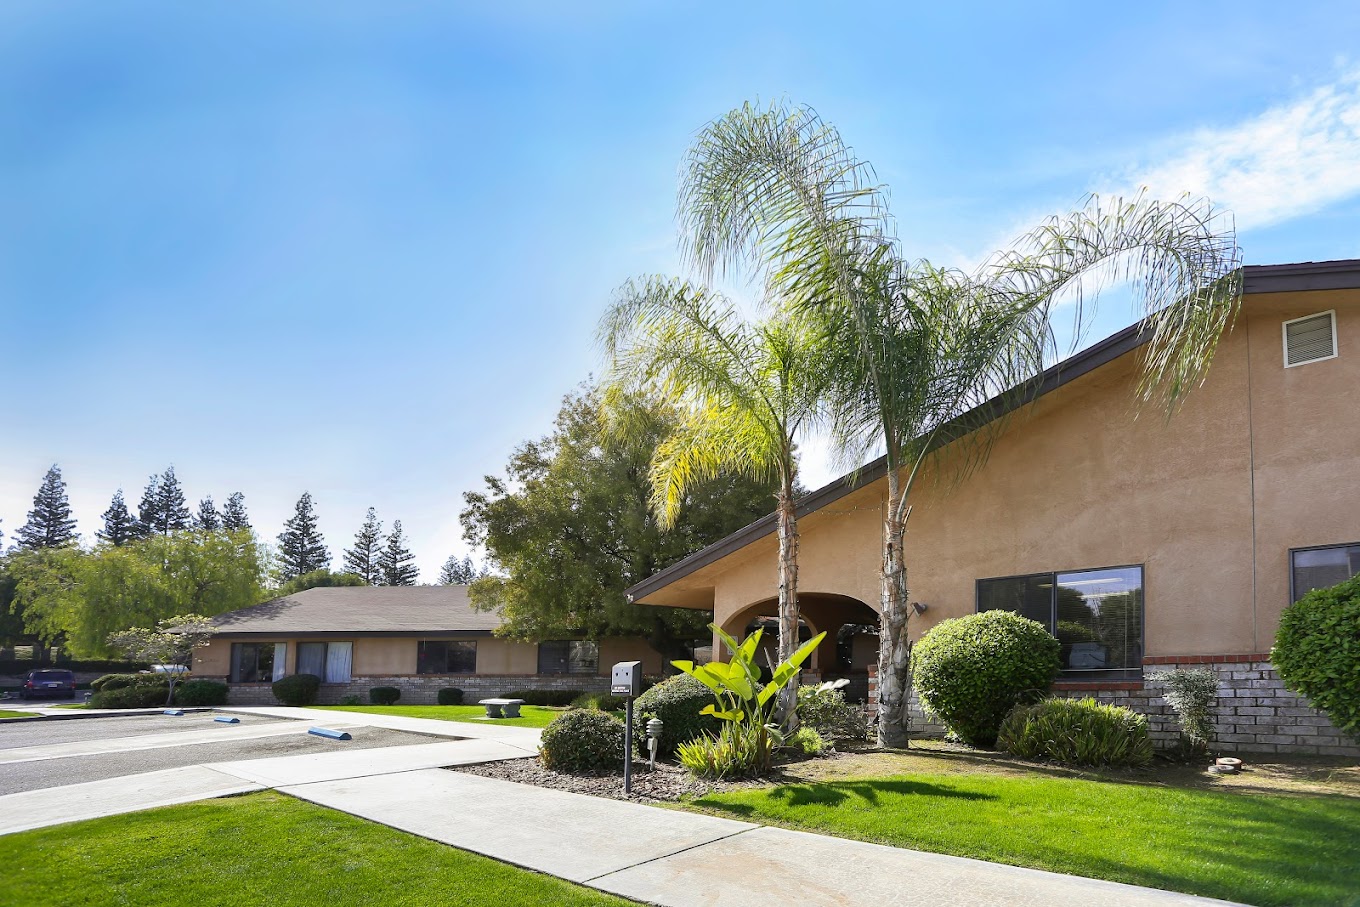
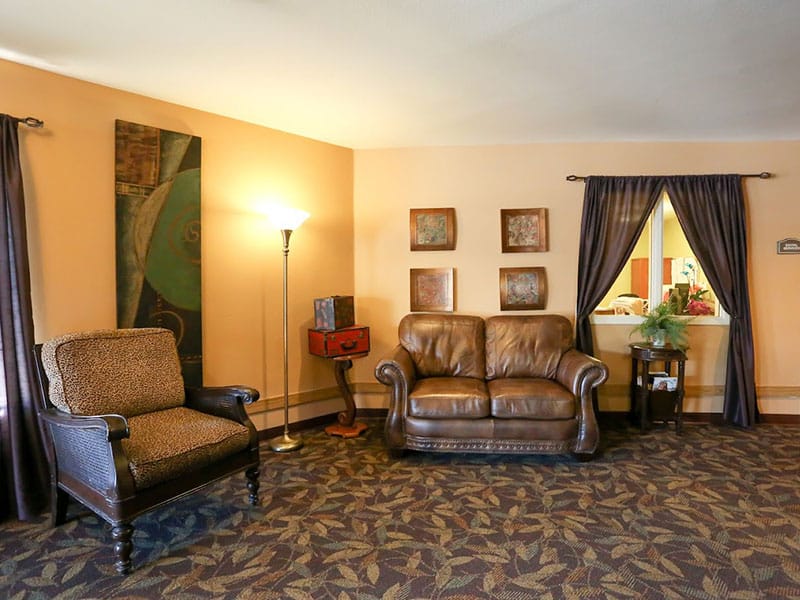
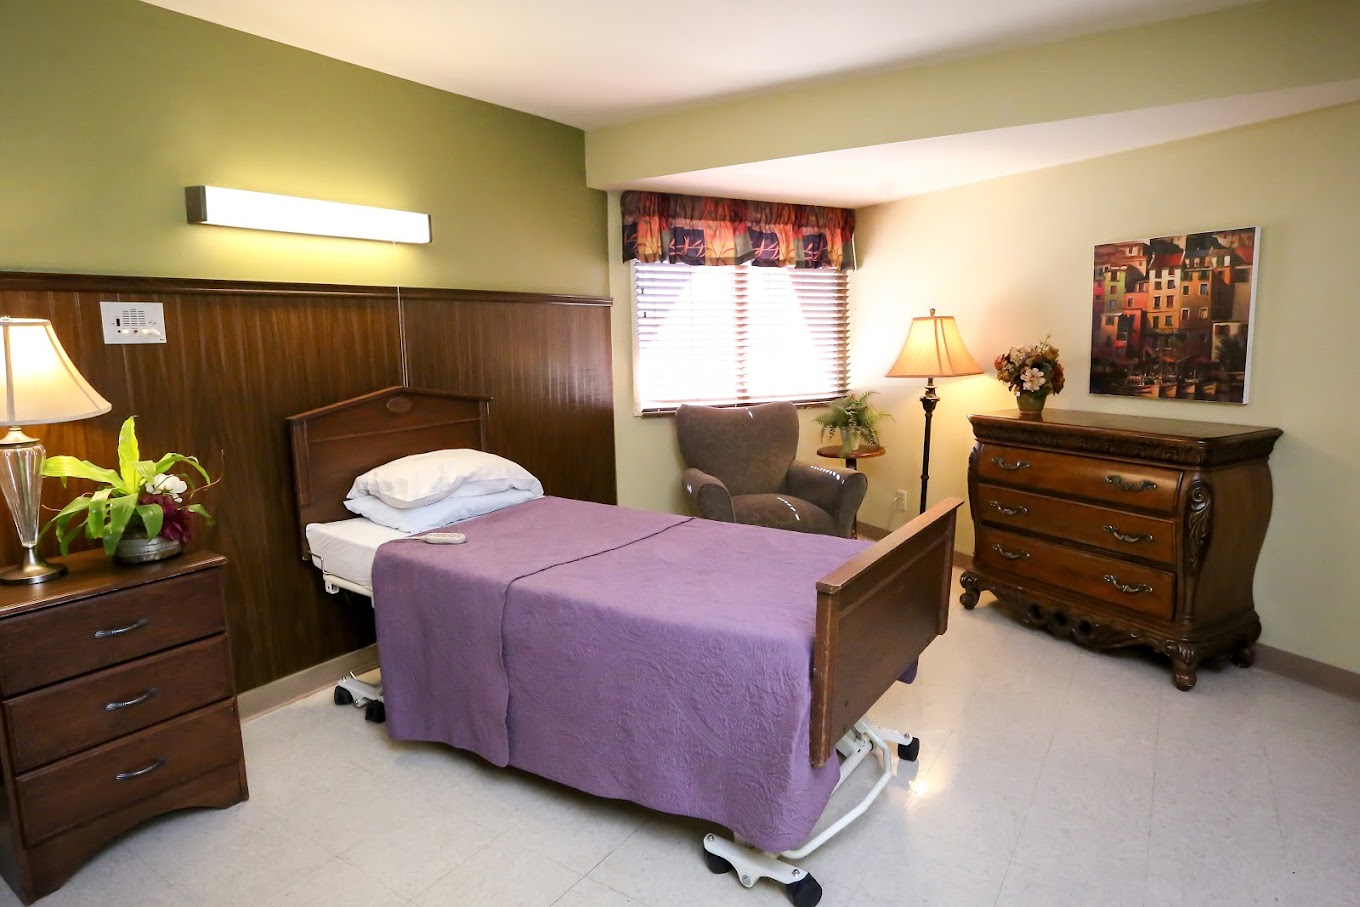


Nestled in Bakersfield, California, Bakersfield Post Acute is a dependable senior care provider that offers an excellent array of rehabilitation and long-term care services. They feature a reliable team of professionals to care for residents after their surgery, illness, or injury, helping them enjoy a speedy recovery. The community provides each resident with comfortable accommodations that give them the comfort and privacy they need to heal, combined with round the clock care from skilled and dependable nurses.
At Bakersfield Post Acute, they strive to create an environment where residents can stay for as long as they need to heal successfully with all the comforts of home and the convenience of excellent care services. The community also conducts a wide variety of activities to make sure residents stay active and engaged. Residents are also offered support after their discharge to make sure they can safely return to their home and routines.
May offer a more intimate, personalized care environment.
Occupancy is moderate, suggesting balanced demand.
Most residents typically stay for a few weeks or months before returning home or moving on.
71% of new residents, usually for short-term rehab.
14% of new residents, often for short stays.
15% of new residents, often for long-term daily care.
Accept Medicaid: Yes
Total Residents: 99
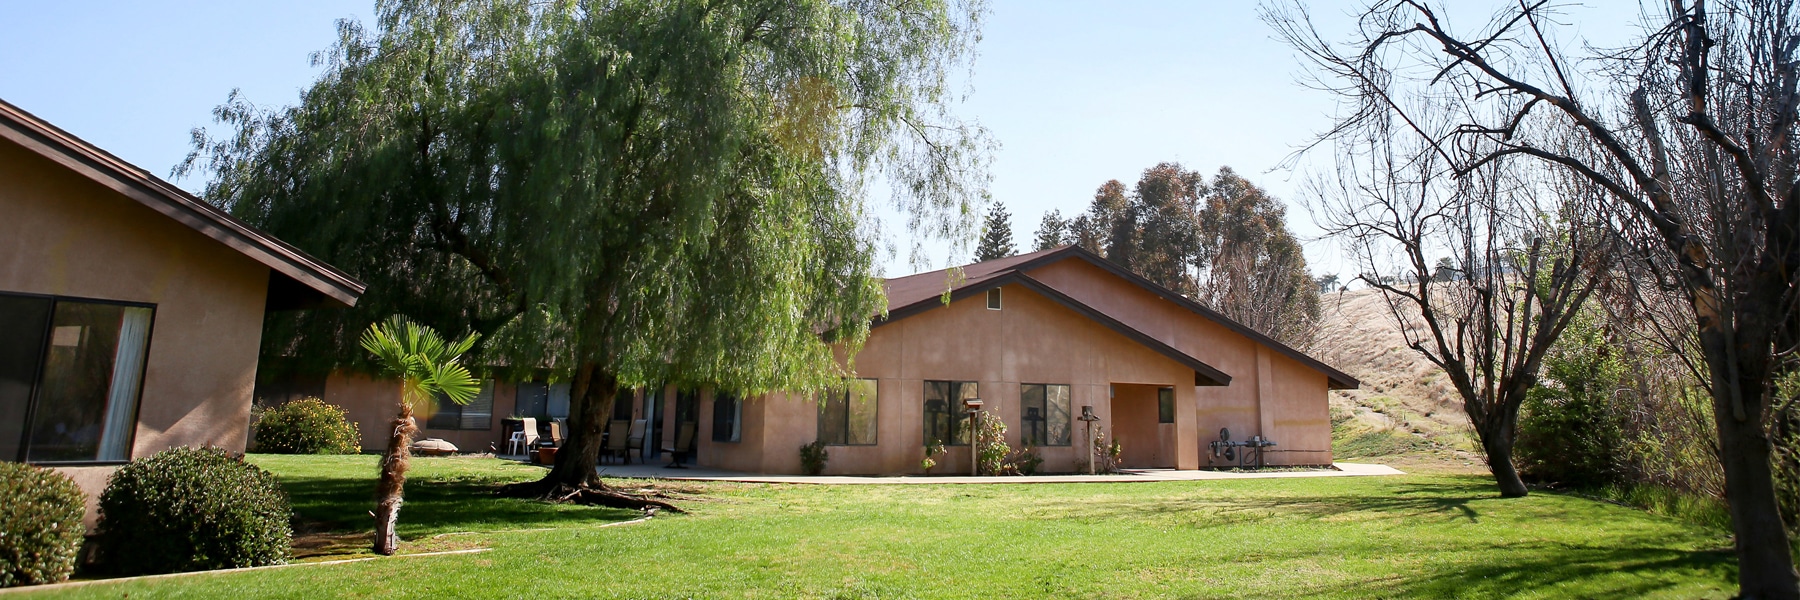
Building Type: Single-story
California average 12.5
Last Health inspection on Aug 2025
California average 50.2
California average 4.65
Health citations are formal notices following inspections when they fail to comply with safety and care standards.
50 of 102 citations resulted from standard inspections; and 52 of 102 resulted from complaint investigations.
California average: 0.4
California average: 1
Data sourced from CMS Health Deficiencies reports. Citation severity codes range from A (least serious) to L (most serious). Immediate Jeopardy (J-L) citations indicate situations where the facility's noncompliance has placed residents at risk of death or serious harm.
Assisted Living A licensed, long-term care setting for seniors or individuals with disabilities who need help with daily activities — like bathing, dressing, and medication management — but not 24-hour skilled nursing. Offers housing, meals, and around-the-clock support while aiming to maximize resident independence.
Independent Living Lifestyle-focused communities for older adults offering dining, activities, and transportation with minimal personal care. Best for active, independent seniors who want community without medical support.
Memory Care Secured, specialized care for people living with Alzheimer's or dementia. Staff trained in cognitive impairment, with higher staff-to-resident ratios and an environment designed to reduce confusion and wandering risk.
Nursing Home Licensed facility providing 24/7 skilled nursing care for residents with complex, ongoing medical needs. Staffed by RNs, LPNs, and CNAs. Inspected and star-rated annually by CMS. Accepts Medicare (short-term rehab) and Medicaid (long-term care).
Nursing Home Licensed facility providing 24/7 skilled nursing care for residents with complex, ongoing medical needs. Staffed by RNs, LPNs, and CNAs. Inspected and star-rated annually by CMS. Accepts Medicare (short-term rehab) and Medicaid (long-term care).
Assisted Living A licensed, long-term care setting for seniors or individuals with disabilities who need help with daily activities — like bathing, dressing, and medication management — but not 24-hour skilled nursing. Offers housing, meals, and around-the-clock support while aiming to maximize resident independence.
![]() 6.9 miles from city center
6.9 miles from city center
![]() 6212 Tudor Way, Bakersfield, CA 93306
6212 Tudor Way, Bakersfield, CA 93306
Add your location
This data corresponds to Q2 2025 and is based on CMS Payroll-Based Journal.
California average ratio: 0.00:1
California average: 7.7 hours
Manages medical care and health needs.
No contractors work on this role.
Assists with medical care and medications.
No contractors work on this role.
Helps with daily care and mobility.
No contractors work on this role.
Total hours from contractors
0 contractor hours this quarter
No contractor roles were reported this quarter.
| Certified Nursing Assistant | 67 | 0 | 67 | 18,975 | 91 | 100% | 8.2 |
| Licensed Practical Nurse | 31 | 0 | 31 | 8,872 | 91 | 100% | 8.1 |
| Registered Nurse | 12 | 0 | 12 | 1,858 | 91 | 100% | 7.4 |
| Dental Services Staff | 3 | 0 | 3 | 1,360 | 64 | 70% | 7.6 |
| Physical Therapy Aide | 3 | 0 | 3 | 1,275 | 81 | 89% | 7 |
| Other Dietary Services Staff | 3 | 0 | 3 | 1,194 | 91 | 100% | 7.5 |
| RN Director of Nursing | 2 | 0 | 2 | 1,016 | 64 | 70% | 8 |
| Speech Language Pathologist | 5 | 0 | 5 | 944 | 70 | 77% | 6.9 |
| Physical Therapy Assistant | 5 | 0 | 5 | 857 | 71 | 78% | 5.8 |
| Nurse Practitioner | 1 | 0 | 1 | 512 | 64 | 70% | 8 |
| Dietitian | 1 | 0 | 1 | 459 | 58 | 64% | 7.9 |
| Respiratory Therapy Technician | 3 | 0 | 3 | 368 | 78 | 86% | 4.3 |
| Administrator | 1 | 0 | 1 | 171 | 64 | 70% | 2.7 |
| Qualified Social Worker | 3 | 0 | 3 | 52 | 28 | 31% | 1.9 |
| Therapeutic Recreation Specialist | 2 | 0 | 2 | 20 | 5 | 5% | 4 |
Source: CMS Long-Term Care Facility Characteristics (Data as of Jan 2026)
Residents meet regularly to discuss policies, care quality, and activities
State-approved Nurse Aide Training and Competency Evaluation Program on-site
Organized group of residents that meets regularly to discuss facility policies, quality of life, and activities.
Data sourced from CMS Long-Term Care Facility Characteristics quarterly report. Payer mix reflects the current resident census by primary payment source.
These measures show how residents usually do over time at this home, based on health outcomes and preventive care.
California average: 6.6
California average: 11.3
California average: 11.1%
California average: 12.0%
California average: 11.3%
California average: 1.7%
California average: 5.0%
California average: 1.2%
California average: 4.2%
California average: 6.7%
California average: 10.1%
California average: 98.5%
California average: 98.2%
California average: 2.25
California average: 1.59
California average: 94.0%
California average: 1.5%
California average: 93.2%
California average: 23.2%
California average: 11.2%
California average: 0.8%
California average: 53.7%
California average: 50.6%
Quality measures are calculated from Minimum Data Set (MDS) assessments. For most measures, lower percentages indicate better care quality.
Federal penalties imposed by CMS for regulatory violations, including civil money penalties (fines) and denials of payment for new Medicare/Medicaid admissions.
Source: CMS Penalties Database (Data as of Jan 2026)
California average: $55K
California average: 2.4
California average: 0.5
Penalties are imposed by CMS for violations of federal nursing home regulations.
Last updated: Jan 2026
Historical financial and operational data for Bakersfield Post Acute based on CMS SNF Cost Reports.
Loading trend charts...
Care Cost Calculator: See Prices in Your Area
Nursing Home Data Explorer
Don’t Wait Too Long: 7 Red Flag Signs Your Parent Needs Assisted Living Now
The True Cost of Assisted Living in 2025 – And How Families Are Paying For It
Understanding Senior Living Costs: Pricing Models, Discounts & Financial Assistance

Touring a community? Use this expert-backed checklist to stay organized, ask the right questions, and find the perfect fit.
We'll send you a PDF version of the touring checklist.