Height Street Skilled Care
Nursing Home, Hospice Care, Nursing Care, Palliative Care & Respite Care · Bakersfield, CA
CMS overall rating Info CMS (the Centers for Medicare & Medicaid Services) is the federal agency that rates nursing home quality. Its Overall Rating runs from 1 to 5 stars, combining health inspections, staffing, and quality measures, with inspections weighted most heavily.

Height Street Skilled Care

Nursing Home, Hospice Care, Nursing Care, Palliative Care & Respite Care · Bakersfield, CA
CMS overall rating Info CMS (the Centers for Medicare & Medicaid Services) is the federal agency that rates nursing home quality. Its Overall Rating runs from 1 to 5 stars, combining health inspections, staffing, and quality measures, with inspections weighted most heavily.
Calculator: See prices in your area
Height Street Skilled Care accepts Medicare, Medicaid, and private pay.

Overview of Height Street Skilled Care

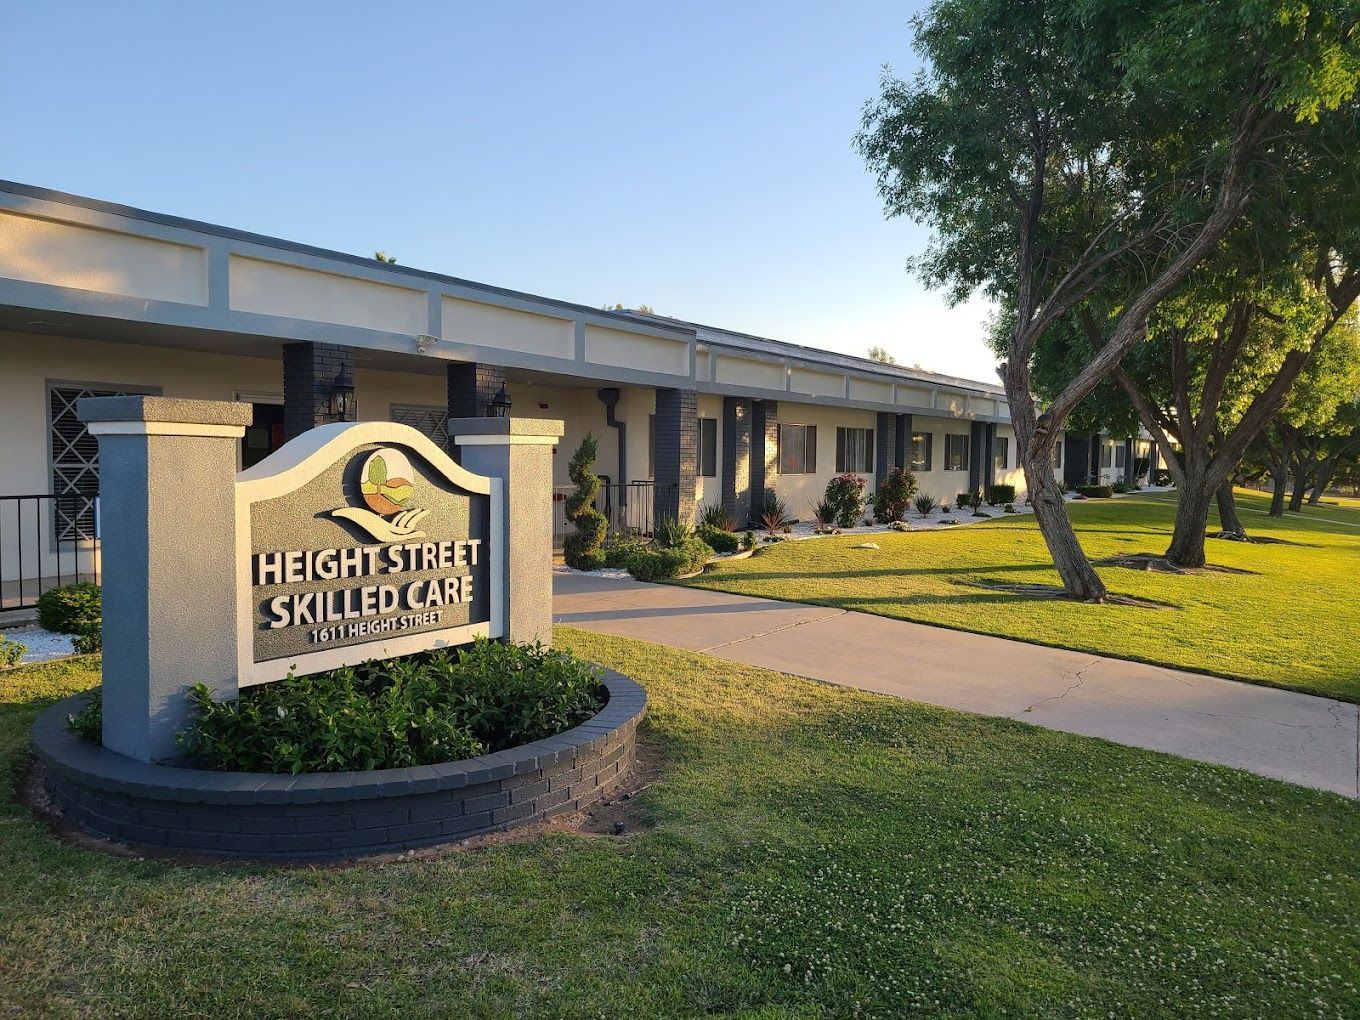
Set amidst the serene neighborhood of Bakersfield, CA, Height Street Skilled Care is a peaceful senior living community designed to cater to residents who are recovering from illness or hospitalization. The community provides residents a safe healing environment with access to an array of services, including skilled nursing, short-term rehabilitation and long term care. A compassionate and reliable care and security team is always available to make sure residents are comfortable and secure as they go through their recovery process.

At Height Street Skilled Care, they only employ highly-trusted and skilled employees to make sure residents are provided with excellent services. Residents’ wishes and preferences are also carefully considered when creating their care plans to ensure their usual interests and routines are incorporated into their recovery journey. With extensive services and a home-like atmosphere, residents are guaranteed to enjoy a speedy recovery.

(661) 748-1300

Quality ratings

Measured by Centers for Medicare & Medicaid Services (CMS)

Overall rating Info The Overall CMS Rating combines results from health inspections, staffing levels and quality measures. Health inspections carry the most weight. Staffing and quality scores can increase or decrease the final rating based on performance compared to state and national standards.
▼ 68.2% Below CA avg. ▼ 68.2% Below CA avg.CA average: 3.1Click the badge to see the full State ranking.Click here to see the full State ranking.
Health Inspection Info Based on the results of the facility's three most recent standard inspections and any complaint investigations. CMS reviews the number, scope, and severity of deficiencies, with more recent findings weighted more heavily.
▼ 64.2% Below CA avg. ▼ 64.2% Below CA avg.CA average: 2.8Click the badge to see the full State ranking.Click here to see the full State ranking.
Staffing Info Measures average nursing staff hours per resident per day, including Registered Nurses (RNs) and total nursing staff. Ratings are adjusted based on the level of care residents require and are compared to state and national benchmarks.
▼ 4.4% Below CA avg. ▼ 4.4% Below CA avg.CA average: 3.1Click the badge to see the full State ranking.Click here to see the full State ranking.
Quality Measures Info Based on clinical and physical health indicators reported to CMS, such as hospital readmissions, falls, pressure ulcers, and improvements in mobility. These measures reflect how well residents' health needs are being managed.
▼ 51.0% Below CA avg. ▼ 51.0% Below CA avg.CA average: 4.1Click the badge to see the full State ranking.Click here to see the full State ranking.

Staffing hours breakdown

Info Daily nursing hours per resident by staff type, reported to CMS. Higher is generally better — compare this facility to state and national averages to see where staffing stands.

Hours per resident per day — compared to California state averages

Total nursing care / resident Info This home is ranked 138th out of 354 homes in California for nurse hours. Total adjusted nursing hours per resident per day, combining RN, LPN, and aide time. CMS adjusts this for case-mix so facilities can be fairly compared.
4h 11m per day
Rank #138 / 354Nurse hours — State benchmarkedThis home is ranked 138th out of 354 homes in California. Shows adjusted nurse hours per resident per day benchmarked to the California average, with a ranking across 354 California facilities. More hours mean more direct care. The national average is about 3.5 hrs; below 3.0 is a red flag.Rankings are based only on facilities in California that report data for that category. Facilities without available data are excluded from the ranking.Click the rank badge to see the full State ranking.Click here to see the full State ranking.
This facility California avg (4h 13m per day)
vs California avg
-1%

5 of 6 metrics below state avg

Staff typeHours / Day / Residentvs state avg
Registered Nurse (RN) Info RNs hold the highest nursing license and can assess residents, interpret test results, and direct care plans. More RN hours per day often signals stronger clinical oversight and faster response to health changes. 25m per day ▼ 35% State avg: 39m per day · National avg: 41m per day
LPN / LVN Info Licensed Practical Nurses (LPNs) or Licensed Vocational Nurses (LVNs) deliver routine hands-on care — medication administration, wound dressing, and monitoring vital signs. They work under RN supervision and make up a large share of daily bedside care. 1h 11m per day ■ Avg State avg: 1h 13m per day · National avg: 52m per day
Nurse Aide Info Certified Nurse Aides (CNAs) provide the most direct day-to-day assistance: bathing, dressing, feeding, and mobility. Nurse aide hours are typically the largest staffing category and directly affect residents' quality of life. 2h 27m per day ▼ 8% State avg: 2h 39m per day · National avg: 2h 21m per day
Weekend Total Nursing Info Combined nursing hours (RN + LPN + Nurse Aide) per resident per day on weekends. Staffing often drops on weekends — this figure reveals whether the facility maintains adequate coverage outside of weekday hours. 3h 41m per day ▼ 10% State avg: 4h 5m per day · National avg: 3h 26m per day
Physical Therapist Info Hours per resident per day provided by licensed Physical Therapists (PTs) or PT Assistants. PT services help residents recover mobility after injury or illness and are especially important for post-acute (short-stay) rehabilitation. 3m per day ▼ 46% State avg: 5m per day · National avg: 4m per day
Weekend RN Info Registered nurse hours specifically on weekends. Facilities sometimes reduce RN presence on Saturdays and Sundays — a low weekend RN figure compared to weekday hours can indicate reduced clinical oversight when most administrative staff are absent. 18m per day ▼ 42% State avg: 30m per day · National avg: 29m per day

Capacity and availability

This home usually has availability

Lower occupancy than the California average: 84.7%
Occupancy rate
46.3% Rank #1409 / 1537Occupancy rate — State benchmarkedThis home is ranked 1409th out of 1537 homes in California. Shows this facility's occupancy rate versus the California average, with its Statewide rank out of 1537. Higher occupancy signals strong local demand and financial stability.Rankings are based only on facilities in California that report data for that category. Facilities without available data are excluded from the ranking.Click the rank badge to see the full State ranking.Click here to see the full State ranking.
Avg. Length of Stay
151 days
Bed community size
99-bed community Rank #725 / 1657Bed count — State benchmarkedThis home is ranked 725th out of 1657 homes in California. Shows this facility's certified or reported bed count compared to other California facilities. Larger communities may offer more amenities, programs, and on-site services for residents and families.Rankings are based only on facilities in California that report data for that category. Facilities without available data are excluded from the ranking.Click the rank badge to see the full State ranking.Click here to see the full State ranking.
A larger shared setting that may offer more common spaces and organized community services.
Years in operation
56 years in operation Rank #1 / 1487Years in operation — State benchmarkedThis home is ranked 1st out of 1487 homes in California. Shows how long this facility has been in operation compared to other California facilities. Longer operating histories may benefit residents, families, and staff.Rankings are based only on facilities in California that report data for that category. Facilities without available data are excluded from the ranking.Click the rank badge to see the full State ranking.Click here to see the full State ranking.
A longer operating history, which may indicate experience navigating regulations and delivering ongoing care.
Walk Score
Walk Score: 73 / 100 Rank #642 / 2092Walk Score — State benchmarkedThis home is ranked 642nd out of 2092 homes in California. Shows how walkable this facility's neighborhood is compared to the average Walk Score across California facilities. Higher scores benefit residents, families, and staff.Rankings are based only on facilities in California that report data for that category. Facilities without available data are excluded from the ranking.Click the rank badge to see the full State ranking.Click here to see the full State ranking.
Very walkable. Most errands can be accomplished on foot, and many essentials are within a short walk.
BBB Rating
BBB Rating: A+ (Not Accredited)
An independent rating from the Better Business Bureau based on factors such as complaint history, transparency, and business practices.
How BBB ratings work

About this community

License Details

CMS Certification Number555902

Staffing

Key information about the people who lead and staff this community.

Leadership

ContactJames Preimesberger

Therapy & Rehabilitation

1 service
Rehabilitation Services

Staffing & Medical

1 service
24-Hour Staffing

Amenities & Lifestyle

Spacious Scenic Courtyard
On-Site Beauty And Barber Services
Holiday Celebrations
Engaging Daily Activities
Social Dining Experience
Specific ProgramsWound Care Services, Therapy Services, Clinical Nutritional Program, Post-Surgery Orthopedic Care, Physician Services.

Dining & Nutrition

Food DescriptionNutritious meals are provided to residents.

Contact Height Street Skilled Care

Inspection History

In California, the Department of Social Services (for assisted living facilities) and the Department of Public Health (for nursing homes) conduct inspections to ensure resident safety and regulatory compliance.

Health Inspection History

Inspections since 2024
Total health inspections 25

California average 12.5


Last Health inspection on Sep 2025

Total health citations
65 Rank #286 / 361Health citations — State benchmarkedThis home is ranked 286th out of 361 homes in California. Shows this facility's total health deficiency citations benchmarked to the California State average, with a ranking across all 361 CA facilities. Lower citation counts earn a better rank.Rankings are based only on facilities in California that report data for that category. Facilities without available data are excluded from the ranking.Click the rank badge to see the full State ranking.Click here to see the full State ranking.

California average 50.2

Citations per inspection
2.6 Rank #39 / 361Citations per inspection — State benchmarkedThis home is ranked 39th out of 361 homes in California. Shows average deficiency citations per CMS inspection for this facility versus the California mean across 361 facilities with citation data. Lower is better.Rankings are based only on facilities in California that report data for that category. Facilities without available data are excluded from the ranking.Click the rank badge to see the full State ranking.Click here to see the full State ranking.

California average 4.65


Health citations are formal notices following inspections when they fail to comply with safety and care standards.

28 of 65 citations resulted from standard inspections; 36 of 65 resulted from complaint investigations; and 1 of 65 came from combined inspections (standard and complaint).

Breakdown of citation severity (last 2 years)
Critical health citations
0
100% better than California average

California average: 0.4


Serious health citations
3
200% worse than California average

California average: 1

0 critical citations California average: 0.4

3 serious citations California average: 1

62 moderate citations California average: 47.2

0 minor citations California average: 1.5
Citations history (last 2 years)
Quality of Care moderate citation Sep 03, 2025
Corrected

Quality of Care moderate citation Sep 03, 2025
Corrected

Care Planning moderate citation Sep 03, 2025
Corrected

Resident Rights moderate citation Sep 03, 2025
Corrected

Staffing Data

Reporting period: October 1 – December 31, 2025 (Q4 2025). Source: CMS Payroll-Based Journal report.

Total staff 133
Employees 133
Contractors 0
Staff to resident ratio 1.48 : 1
18% fewer staff per resident than California average
California average ratio: 1.81 : 1 California average ratio: 1.81 : 1See full California ranking
Avg staff/day 61
Average shift 7.2 hours
6% worse than California average
California average: 7.7 hours California average shift: 7.7 hoursSee full California ranking
Total staff hours (quarter) 40,486

Nursing staff breakdown

Q4 2025 · Oct 1 – Dec 31 More info This data comes from the CMS Payroll-Based Journal report covering October 1 – December 31, 2025.
Registered Nurse

Manages medical care and health needs.

RN Staff Info All 9 RN Staff are full-time employees. No contractors work on this role. 9
Average shift length Info Average shift length. Calculated as total hours divided by days worked and average staff per day. 7.9 hours
Licensed Practical Nurse

Assists with medical care and medications.

LPN Staff Info All 26 LPN Staff are full-time employees. No contractors work on this role. 26
Average shift length Info Average shift length. Calculated as total hours divided by days worked and average staff per day. 7.5 hours
Certified Nursing Assistant

Helps with daily care and mobility.

CNA Staff Info All 55 CNA Staff are full-time employees. No contractors work on this role. 55
Average shift length Info Average shift length. Calculated as total hours divided by days worked and average staff per day. 7.3 hours

Contractor staffing

Q4 2025 · Oct 1 – Dec 31 More info This data comes from the CMS Payroll-Based Journal report covering October 1 – December 31, 2025.
Total hours from contractors 0% — all staff are direct employees this quarter

Staff by category

Q4 2025 · Oct 1 – Dec 31 More info This data comes from the CMS Payroll-Based Journal report covering October 1 – December 31, 2025.
Certified Nursing Assistant5505520,51792100%7.3
Licensed Practical Nurse260269,13392100%7.5
Registered Nurse9092,10492100%7.9
Other Dietary Services Staff4041,53892100%6.9
Speech Language Pathologist7071,2318390%6.6
Clinical Nurse Specialist2029586470%7.7
RN Director of Nursing2028086267%7.7
Physical Therapy Assistant4047397885%6
Administrator1015126470%8
Nurse Practitioner1014725964%8
Dental Services Staff1014635964%7.8
Mental Health Service Worker1014535762%8
Occupational Therapy Aide2024426368%6.9
Physical Therapy Aide6064296571%4.4
Respiratory Therapy Technician5053735964%4.4
Qualified Social Worker5051925358%2.6
Medical Director101752426%3.1
Occupational Therapy Assistant10148910%5.3
55 Certified Nursing Assistant
% of Days 100%
26 Licensed Practical Nurse
% of Days 100%
9 Registered Nurse
% of Days 100%
4 Other Dietary Services Staff
% of Days 100%
7 Speech Language Pathologist
% of Days 90%
2 Clinical Nurse Specialist
% of Days 70%
2 RN Director of Nursing
% of Days 67%
4 Physical Therapy Assistant
% of Days 85%
1 Administrator
% of Days 70%
1 Nurse Practitioner
% of Days 64%
1 Dental Services Staff
% of Days 64%
1 Mental Health Service Worker
% of Days 62%
2 Occupational Therapy Aide
% of Days 68%
6 Physical Therapy Aide
% of Days 71%
5 Respiratory Therapy Technician
% of Days 64%
5 Qualified Social Worker
% of Days 58%
1 Medical Director
% of Days 26%
1 Occupational Therapy Assistant
% of Days 10%

Penalties and fines

Federal penalties imposed by CMS for regulatory violations, including civil money penalties (fines) and denials of payment for new Medicare/Medicaid admissions.

Source: CMS Penalties Database

No penalties in the past 3 years

No civil money penalties or payment denials were reported in the last 3 years.

Quality of care over time

These measures show how residents usually do over time at this home, based on health outcomes and preventive care.

High-risk clinical events score Info A composite score based on pressure ulcers, falls with injury, weight loss, walking ability decline, and activities of daily living decline. 14.3
116% worse than California average

California average: 6.6

Functional decline score Info A composite score based on activities of daily living decline, walking ability decline, and incontinence. 25.7
127% worse than California average

California average: 11.3

Long-stay resident measures
Average California avg: 4.2 Info CMS star rating based on long-stay quality measure performance. 5 stars = significantly above average, 1 star = significantly below average.
Need for Help with Daily Activities Increased Info Percent of long-stay residents whose need for help with daily activities has increased 32.9%
197% worse than California average

California average: 11.1%

Walking Ability Worsened Info Percent of long-stay residents whose ability to move independently worsened 26.9%
124% worse than California average

California average: 12.0%

Low Risk Residents with Bowel/Bladder Incontinence Info Percent of low risk long-stay residents who lose control of their bowels or bladder 17.4%
54% worse than California average

California average: 11.3%

Falls with Major Injury Info Percent of long-stay residents experiencing one or more falls with major injury 2.0%
21% worse than California average

California average: 1.7%

High Risk Residents with Pressure Ulcers Info Percent of long-stay high risk residents with pressure ulcers 3.8%
23% better than California average

California average: 5.0%

Urinary Tract Infection Info Percent of long-stay residents with a urinary tract infection 1.8%
43% worse than California average

California average: 1.2%

Lost Too Much Weight Info Percent of long-stay residents who lose too much weight 6.0%
42% worse than California average

California average: 4.2%

Depressive Symptoms Info Percent of long-stay residents who have depressive symptoms 36.4%
443% worse than California average

California average: 6.7%

Antipsychotic Use Info Percent of long-stay residents who received an antipsychotic medication 6.6%
34% better than California average

California average: 10.1%

Pneumococcal Vaccine Info Percent of long-stay residents assessed and appropriately given the pneumococcal vaccine 98.3%
In line with California average

California average: 98.5%

Influenza Vaccine Info Percent of long-stay residents assessed and appropriately given the seasonal influenza vaccine 95.0%
In line with California average

California average: 98.2%

Hospitalizations per 1,000 days Info Number of hospitalizations per 1,000 long-stay resident days. 3.55
58% worse than California average

California average: 2.25

ED visits per 1,000 days Info Number of outpatient emergency department visits per 1,000 long-stay resident days. 1.74
9% worse than California average

California average: 1.59

Short-stay resident measures
Significantly below average California avg: 3.5 Info CMS star rating based on short-stay quality measure performance. 5 stars = much above average, 1 star = much below average.
Pneumococcal Vaccine Info Percent of short-stay residents assessed and appropriately given the pneumococcal vaccine 95.4%
In line with California average

California average: 94.0%

Antipsychotic medication increase Info Percent of short-stay residents who newly received an antipsychotic medication 2.8%
94% worse than California average

California average: 1.5%

Influenza Vaccine Info Percent of short-stay residents assessed and appropriately given the seasonal influenza vaccine 91.9%
In line with California average

California average: 93.2%

Re-hospitalized after SNF stay Info Percentage of short-stay residents who were re-hospitalized after their nursing home admission. 24.3%
5% worse than California average

California average: 23.2%

Emergency department visits Info Percentage of short-stay residents who had an outpatient emergency department visit. 13.5%
21% worse than California average

California average: 11.2%

Falls with major injury Info Percentage of SNF residents who experience falls with major injury during their stay. 1.9%
152% worse than California average

California average: 0.8%

Ability to care for self at discharge Info Percentage of residents at or above expected ability to care for themselves at discharge. 41.5%
23% worse than California average

California average: 53.7%

Successful return to home or community Info Rate of successful return to home or community from a skilled nursing facility. 42.5%
16% worse than California average

California average: 50.6%

Breakdown by payment type

Medicare

32% of new residents, usually for short-term rehab.

Typical stay 2 - 3 months

Private pay

15% of new residents, often for short stays.

Typical stay 1 months

Medicaid

53% of new residents, often for long-term daily care.

Typical stay 8 - 9 months

Facility Characteristics

Source: CMS Long-Term Care Facility Characteristics (Data as of Jan 2026)

Total residents 90
Medicare
16
17.8% of residents
Medicaid
65
72.2% of residents
Private pay or other
9
10% of residents
Programs & Services
Residents Group

Residents meet regularly to discuss policies, care quality, and activities

Nurse Aide Training

State-approved Nurse Aide Training and Competency Evaluation Program on-site

Active Resident Council

Organized group of residents that meets regularly to discuss facility policies, quality of life, and activities.

Finances and operations

Based on CMS SNF Cost Report for fiscal year ending in 12/2023.

Privately-owned community
Operated by a single business entity.
Net patient revenue Info Net patient revenue — what the home actually collects for resident care, after contractual allowances, bad debt and discounts are subtracted from its gross charges (CMS cost report, Worksheet G-3). It covers resident care only; money the home earns from other sources is shown separately as "Other income."
$12.2M
Net patient income Info Net patient income: net patient revenue minus the home's total operating expenses. A positive figure means it earns more from resident care than it spends to deliver it; a negative figure means the opposite. It excludes non-operating "other income."
-$2.2M
Privately-owned community Operated by a single business entity.
Net patient revenue Info Net patient revenue — what the home actually collects for resident care, after contractual allowances, bad debt and discounts are subtracted from its gross charges (CMS cost report, Worksheet G-3). It covers resident care only; money the home earns from other sources is shown separately as "Other income."
$12.2M Rank #186 / 355Revenue — State benchmarkedThis home is ranked 186th out of 355 homes in California. Shows this facility's annual revenue compared to the California average. Higher revenue generally means more resources for staffing and capital — read alongside Payroll %.Rankings are based only on facilities in California that report data for that category. Facilities without available data are excluded from the ranking.Click the rank badge to see the full State ranking.Click here to see the full State ranking.
Net patient income Info Net patient income: net patient revenue minus the home's total operating expenses. A positive figure means it earns more from resident care than it spends to deliver it; a negative figure means the opposite. It excludes non-operating "other income."
-$2.2M
Other income Info Money the home earns outside of resident care — such as investments, grants, rentals and other non-operating sources (CMS cost report, Worksheet G-3). It is tracked separately from net patient revenue: it is not part of that figure, and it is not included in net patient income.
$2.5M
Payroll costs Info Staff salaries plus wage-related costs — benefits such as payroll taxes, health insurance and retirement — from the home's own accounting records (CMS cost report, Worksheet A). Contract or agency labor is counted separately, under other operating costs. Rank #145 / 355Payroll — State benchmarkedThis home is ranked 145th out of 355 homes in California. Shows total annual staff payroll benchmarked to the California average. Higher payroll investment relative to peers often signals better staffing and less reliance on cheaper contract labor.Rankings are based only on facilities in California that report data for that category. Facilities without available data are excluded from the ranking.Click the rank badge to see the full State ranking.Click here to see the full State ranking.
$9.3M 76.1% of net patient revenue Info Payroll as a share of revenue: staff salaries and wage-related benefits divided by net patient revenue. A higher figure means more of each revenue dollar goes to staff pay. Rank #87 / 355Payroll % — State benchmarkedThis home is ranked 87th out of 355 homes in California. Shows payroll as a percentage of revenue versus the California average. Well-run California facilities typically land around 56–67% — the top third Statewide. Below 25% may signal understaffing or heavy agency use — read with Staffing ratings.Rankings are based only on facilities in California that report data for that category. Facilities without available data are excluded from the ranking.Click the rank badge to see the full State ranking.Click here to see the full State ranking.
Other operating costs Info Everything it costs to run the home apart from payroll — food, utilities, supplies, maintenance, contract labor and administration. Calculated as total operating expense minus payroll (staff salaries and wage-related benefits).
$5.2M
Total costs Info The home's total operating expense for the year — all the costs of running it, salaries included (CMS cost report, Worksheet G-3).
$14.4M

What does this home offer?

Building type icon
Building type icon

Building Type: Single-story

Who this home usually serves

TYPE OF STAY

Mostly long-term care residents

Most residents stay for extended periods and receive ongoing daily care.

Most new residents arrive under Medicaid (53% of admissions), and a typical Medicaid stay runs around 8 - 9 months.

Admissions
214 total

Coverage residents most often arrive under.

Medicare 32%
Private pay 15%
Medicaid 53%
Discharges
222 total

Coverage residents most often leave under.

Medicare 17%
Private pay 10%
Medicaid 73%

Places of interest near Height Street Skilled Care

Address 3.6 miles from city center Info Estimated distance in miles from Bakersfield's city center to Height Street Skilled Care's address, calculated via Google Maps.

Calculate Travel Distance to Height Street Skilled Care

Add your location

Address

Compare Nursing Homes around Bakersfield

The information below is reported by the California Department of Social Services and Department of Public Health.

5 facilities compared · CMS & CA Dept. of Health data

San Joaquin Nursing and Rehabilitation Center
NH
HC
MC
Bakersfield (Homaker Park)
99
Facility 99
CA AVG 103
Rank #725 / 1657
93.7%
Facility 93.7%
CA AVG 84.7%
Rank #167 / 1537
+11%
3.70
Facility 3.70
CA AVG 4.22
Rank #245 / 354
-60%-12%
$47.2k
Facility $47.2k
CA AVG $56.5k
Rank #311 / 362
-
87
Facility 87
CA AVG 50.2
Rank #320 / 361
2.6
Facility 2.6
CA AVG 4.6
Rank #39 / 361
289A+
55
Facility 55
CA AVG 57
Rank #1215 / 2092
Bryce Blood
$17.1M
Facility $17.1M
CA AVG $17.0M
Rank #129 / 355
$8.8M
Facility $8.8M
CA AVG $7.0M
Rank #166 / 355
51.3%
Facility 51.3%
CA AVG 45.2%
Rank #263 / 355
56294
Brookdale Riverwalk
NH
AL
IL
MC
Bakersfield (Fairway Oaks)
376
Facility 376
CA AVG 103
Rank #32 / 1657
66.0%
Facility 66.0%
CA AVG 84.7%
Rank #1099 / 1537
-22%
4.35
Facility 4.35
CA AVG 4.22
Rank #122 / 354
+1%+3%
$56.3k
Facility $56.3k
CA AVG $56.5k
Rank #320 / 362
65
Facility 65
CA AVG 81
Rank #1237 / 1401
69
Facility 69
CA AVG 50.2
Rank #296 / 361
2.6
Facility 2.6
CA AVG 4.6
Rank #39 / 361
1248-
32
Facility 32
CA AVG 57
Rank #1693 / 2092
Brookdale Gardens Inc
$15.6M
Facility $15.6M
CA AVG $17.0M
Rank #131 / 355
$8.7M
Facility $8.7M
CA AVG $7.0M
Rank #170 / 355
55.6%
Facility 55.6%
CA AVG 45.2%
Rank #257 / 355
555771
Height Street Skilled Care
NH
HC
NC
PC
RC
Bakersfield
99
Facility 99
CA AVG 103
Rank #725 / 1657
46.3%
Facility 46.3%
CA AVG 84.7%
Rank #1409 / 1537
-45%
4.19
Facility 4.19
CA AVG 4.22
Rank #138 / 354
-24%-1%
$12.7k
Facility $12.7k
CA AVG $56.5k
Rank #253 / 362
-
65
Facility 65
CA AVG 50.2
Rank #286 / 361
2.6
Facility 2.6
CA AVG 4.6
Rank #39 / 361
391A+
73
Facility 73
CA AVG 57
Rank #642 / 2092
Cep Holdings LLC
$12.2M
Facility $12.2M
CA AVG $17.0M
Rank #186 / 355
$9.3M
Facility $9.3M
CA AVG $7.0M
Rank #145 / 355
76.1%
Facility 76.1%
CA AVG 45.2%
Rank #87 / 355
555902
The Orchards Post-Acute
NH
AL
IL
MC
Bakersfield (Homaker Park)
150
Facility 150
CA AVG 103
Rank #343 / 1657
87.4%
Facility 87.4%
CA AVG 84.7%
Rank #398 / 1537
+3%
3.93
Facility 3.93
CA AVG 4.22
Rank #206 / 354
+4%-7%
$9.2k
Facility $9.2k
CA AVG $56.5k
Rank #236 / 362
-
96
Facility 96
CA AVG 50.2
Rank #336 / 361
2.8
Facility 2.8
CA AVG 4.6
Rank #50 / 361
2140-
60
Facility 60
CA AVG 57
Rank #1050 / 2092
-
$18.6M
Facility $18.6M
CA AVG $17.0M
Rank #139 / 355
$9.5M
Facility $9.5M
CA AVG $7.0M
Rank #90 / 355
51%
Facility 51%
CA AVG 45.2%
Rank #113 / 355
555702
Kern River Transitional Care
NH
Bakersfield (South San Lauren)
140
Facility 140
CA AVG 103
Rank #419 / 1657
95.6%
Facility 95.6%
CA AVG 84.7%
Rank #184 / 1537
+13%
3.46
Facility 3.46
CA AVG 4.22
Rank #296 / 354
-23%-18%
$77.7k
Facility $77.7k
CA AVG $56.5k
Rank #335 / 362
-
99
Facility 99
CA AVG 50.2
Rank #340 / 361
2.8
Facility 2.8
CA AVG 4.6
Rank #50 / 361
1133-
27
Facility 27
CA AVG 57
Rank #1760 / 2092
-
$29.3M
Facility $29.3M
CA AVG $17.0M
Rank #29 / 355
$13.7M
Facility $13.7M
CA AVG $7.0M
Rank #43 / 355
46.6%
Facility 46.6%
CA AVG 45.2%
Rank #308 / 355
555912

Financial Assistance for
Nursing Home in California

Height Street Skilled Care is located in Bakersfield, California.
Here are the financial assistance programs available to residents in California.

Get Financial aid guidance

Multipurpose Senior Services Program

MSSP (Medi-Cal Waiver)

Age 65+
General California resident, Medi-Cal eligible, nursing home risk.
Income Limits (2025) ~$2,829/month 300% FBR, individual
Asset Limits $2,000 (individual), $3,000 (couple).
CA

County-managed; waitlists possible.

Benefits
In-home support (4-6 hours/day) Respite care (14 days/year) Meals (~$6/meal) Transportation (8 trips/month) Care management

In-Home Supportive Services (IHSS)

California IHSS

Age 65+
General California resident, Medicaid-eligible or low-income.
Income Limits ~$1,732/month individual, Medi-Cal threshold
Asset Limits $2,000 individual
CA

Can hire family as caregivers.

Benefits
Personal care (up to 283 hours/month) Homemaker services Respite (varies)

Multipurpose Senior Services Program (MSSP)

CA MSSP

Age 65+
General California resident, Medi-Cal-eligible, nursing home-eligible but community-capable.
Income Limits ~$2,829/month 300% FBR, individual
Asset Limits $2,000 individual
CA

Available in 38 counties; waitlists common.

Benefits
Case management Respite care (up to 10 days/year) Minor home mods (avg. $500) Adult day care (~$50/day)

Property Tax Postponement Program (PTP)

CA PTP

Age 62+
General California resident, own and live in home, 40% equity.
Income Limits (2025) ~$51,500/year household, adjusted annually
Asset Limits Equity-based; no strict asset cap.
CA

Deferred taxes accrue interest (5% as of 2024); repaid upon sale/death.

Benefits
Property tax deferral (avg. $1,000-$3,000/year, varies by county)

Assisted Living Waiver (ALW)

CA ALW

Age 65+ or disabled
General California resident, Medi-Cal-eligible, nursing home-eligible.
Income Limits ~$2,829/month 300% FBR, individual
Asset Limits $2,000 individual
CA

Available in 15 counties (e.g., LA, Sacramento); waitlists common.

Benefits
Personal care in ALFs (5-7 hours/day) Medication management Social services

California CARES Program

CA CARES

Age
General Caregivers of California residents 60+ needing help with 3+ daily activities; no caregiver age limit.
Income Limits No strict limit; cost-sharing above ~$2,500/month threshold.
Asset Limits Not applicable; need-based.
CA

High demand in urban areas; complements IHSS respite.

Benefits
Respite care (up to 10 days/year) Counseling (4-6 sessions/year) Training (2-3 workshops/year) Supplies (~$200/year)

Frequently Asked Questions about Height Street Skilled Care

Is Height Street Skilled Care in a walkable area?

Height Street Skilled Care has a walk score of 73. Very walkable. Most errands can be accomplished on foot, and many essentials are within a short walk.

What is the occupancy rate at Height Street Skilled Care?

Height Street Skilled Care's occupancy is 46.3%.

Are there photos of Height Street Skilled Care?

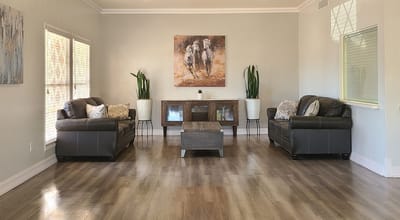
Yes — there are 2 photos of Height Street Skilled Care in the photo gallery on this page.

What is the address of Height Street Skilled Care?

Height Street Skilled Care is located at 1611 Height St, Bakersfield, CA 93305.

What is the phone number of Height Street Skilled Care?

(661) 748-1300 will put you in contact with the team at Height Street Skilled Care.

Is Height Street Skilled Care Medicare or Medicaid certified?

Yes — Height Street Skilled Care is a CMS-certified provider of Medicare and Medicaid.

Guides for Better Senior Living

Care Cost Calculator: See Prices in Your Area

Nursing Home Data Explorer

Don’t Wait Too Long: 7 Red Flag Signs Your Parent Needs Assisted Living Now

The True Cost of Assisted Living in 2025 – And How Families Are Paying For It

Understanding Senior Living Costs: Pricing Models, Discounts & Financial Assistance