San Joaquin Nursing and Rehabilitation Center
Nursing Home, Hospice Care & Memory Care · Bakersfield, CA
CMS overall rating Info CMS (the Centers for Medicare & Medicaid Services) is the federal agency that rates nursing home quality. Its Overall Rating runs from 1 to 5 stars, combining health inspections, staffing, and quality measures, with inspections weighted most heavily.

San Joaquin Nursing and Rehabilitation Center

Nursing Home, Hospice Care & Memory Care · Bakersfield, CA
CMS overall rating Info CMS (the Centers for Medicare & Medicaid Services) is the federal agency that rates nursing home quality. Its Overall Rating runs from 1 to 5 stars, combining health inspections, staffing, and quality measures, with inspections weighted most heavily.
Calculator: See prices in your area
San Joaquin Nursing and Rehabilitation Center accepts Medicare, Medicaid, and private pay.

Overview of San Joaquin Nursing and Rehabilitation Center

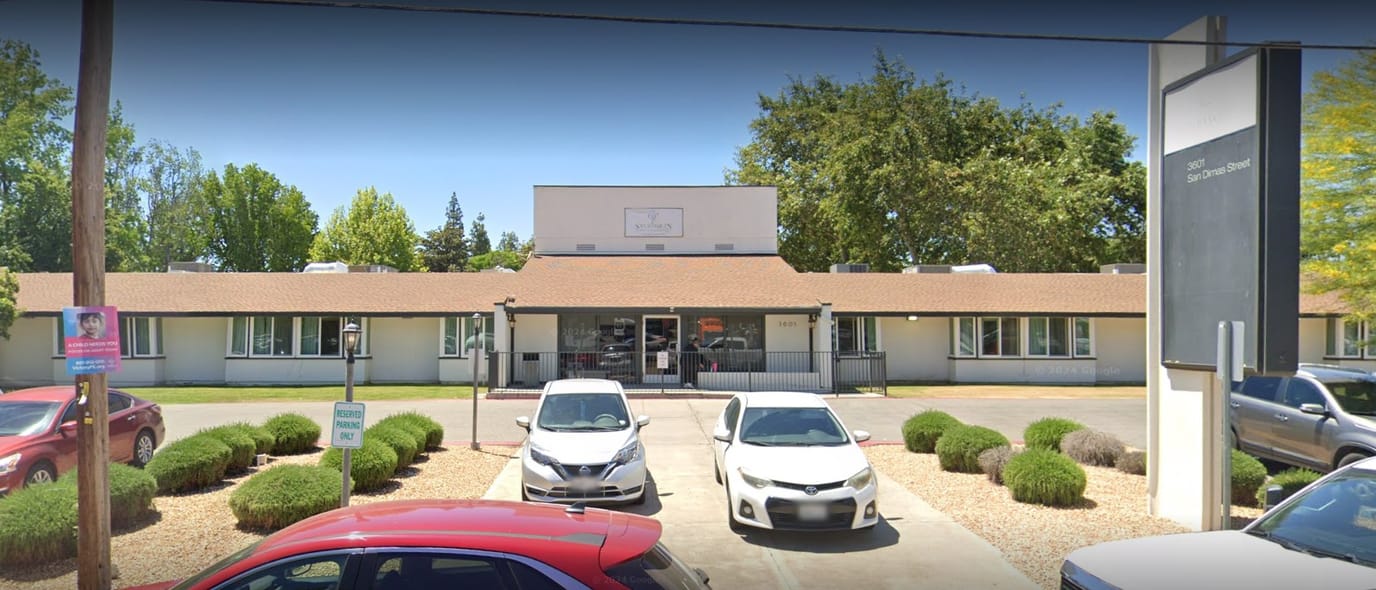
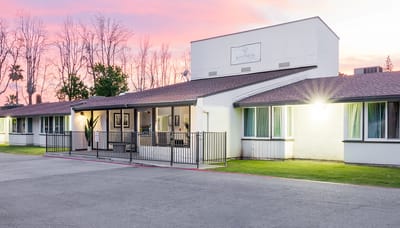
Located in the neighborhood of Bakersfield, CA, San Joaquin Nursing and Rehabilitation Center is a compassionate senior care provider, offering skilled nursing and short-term rehabilitation services. Designed to help residents recover successfully from their conditions or hospitalization, the community provides a reliable and compassionate team of caregivers and nurses that oversee residents’ personalized care plans. Offering access to physical, occupational, speech, and respiratory therapies, the community ensures residents are able to maintain or regain their strength and functionality.

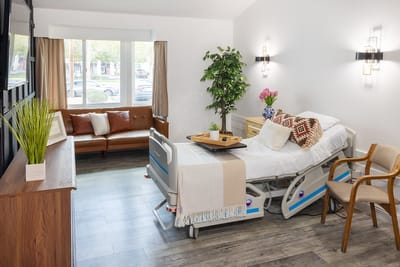
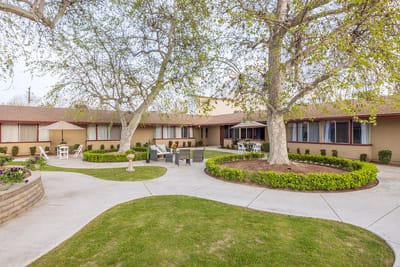
Residents here are also offered an engaging daily schedule of activities to keep them motivated, happy, and entertained as they go through their recovery journey. Spacious common areas and refreshing courtyards are also available to give residents a serene space for connecting with others or enjoying their free time idylling around. The community also offers help and support to residents and families to prepare for life after discharge, making sure they transition back to their usual routines smoothly.

(661) 323-2894

Quality ratings

Measured by Centers for Medicare & Medicaid Services (CMS)

Overall rating Info The Overall CMS Rating combines results from health inspections, staffing levels and quality measures. Health inspections carry the most weight. Staffing and quality scores can increase or decrease the final rating based on performance compared to state and national standards.
▼ 4.7% Below CA avg. ▼ 4.7% Below CA avg.CA average: 3.1Click the badge to see the full State ranking.Click here to see the full State ranking.
Health Inspection Info Based on the results of the facility's three most recent standard inspections and any complaint investigations. CMS reviews the number, scope, and severity of deficiencies, with more recent findings weighted more heavily.
▼ 28.5% Below CA avg. ▼ 28.5% Below CA avg.CA average: 2.8Click the badge to see the full State ranking.Click here to see the full State ranking.
Staffing Info Measures average nursing staff hours per resident per day, including Registered Nurses (RNs) and total nursing staff. Ratings are adjusted based on the level of care residents require and are compared to state and national benchmarks.
▼ 4.4% Below CA avg. ▼ 4.4% Below CA avg.CA average: 3.1Click the badge to see the full State ranking.Click here to see the full State ranking.
Quality Measures Info Based on clinical and physical health indicators reported to CMS, such as hospital readmissions, falls, pressure ulcers, and improvements in mobility. These measures reflect how well residents' health needs are being managed.
▲ 22.4% Above CA avg. ▲ 22.4% Above CA avg.CA average: 4.1Click the badge to see the full State ranking.Click here to see the full State ranking.

Staffing hours breakdown

Info Daily nursing hours per resident by staff type, reported to CMS. Higher is generally better — compare this facility to state and national averages to see where staffing stands.

Hours per resident per day — compared to California state averages

Total nursing care / resident Info This home is ranked 245th out of 354 homes in California for nurse hours. Total adjusted nursing hours per resident per day, combining RN, LPN, and aide time. CMS adjusts this for case-mix so facilities can be fairly compared.
3h 42m per day
Rank #245 / 354Nurse hours — State benchmarkedThis home is ranked 245th out of 354 homes in California. Shows adjusted nurse hours per resident per day benchmarked to the California average, with a ranking across 354 California facilities. More hours mean more direct care. The national average is about 3.5 hrs; below 3.0 is a red flag.Rankings are based only on facilities in California that report data for that category. Facilities without available data are excluded from the ranking.Click the rank badge to see the full State ranking.Click here to see the full State ranking.
This facility California avg (4h 13m per day)
vs California avg
-12%

3 of 6 metrics below state avg

Standout metric Physical Therapist is +26% above state avg
Staff typeHours / Day / Residentvs state avg
Registered Nurse (RN) Info RNs hold the highest nursing license and can assess residents, interpret test results, and direct care plans. More RN hours per day often signals stronger clinical oversight and faster response to health changes. 15m per day ▼ 61% State avg: 39m per day · National avg: 41m per day
LPN / LVN Info Licensed Practical Nurses (LPNs) or Licensed Vocational Nurses (LVNs) deliver routine hands-on care — medication administration, wound dressing, and monitoring vital signs. They work under RN supervision and make up a large share of daily bedside care. 1h 24m per day ▲ 15% State avg: 1h 13m per day · National avg: 52m per day
Nurse Aide Info Certified Nurse Aides (CNAs) provide the most direct day-to-day assistance: bathing, dressing, feeding, and mobility. Nurse aide hours are typically the largest staffing category and directly affect residents' quality of life. 2h 37m per day ■ Avg State avg: 2h 39m per day · National avg: 2h 21m per day
Weekend Total Nursing Info Combined nursing hours (RN + LPN + Nurse Aide) per resident per day on weekends. Staffing often drops on weekends — this figure reveals whether the facility maintains adequate coverage outside of weekday hours. 3h 57m per day ▼ 3% State avg: 4h 5m per day · National avg: 3h 26m per day
Physical Therapist Info Hours per resident per day provided by licensed Physical Therapists (PTs) or PT Assistants. PT services help residents recover mobility after injury or illness and are especially important for post-acute (short-stay) rehabilitation. 6m per day ▲ 26% State avg: 5m per day · National avg: 4m per day
Weekend RN Info Registered nurse hours specifically on weekends. Facilities sometimes reduce RN presence on Saturdays and Sundays — a low weekend RN figure compared to weekday hours can indicate reduced clinical oversight when most administrative staff are absent. 8m per day ▼ 74% State avg: 30m per day · National avg: 29m per day

Capacity and availability

This home usually has limited availability

Higher occupancy than the California average: 84.7%
Occupancy rate
93.7% Rank #167 / 1537Occupancy rate — State benchmarkedThis home is ranked 167th out of 1537 homes in California. Shows this facility's occupancy rate versus the California average, with its Statewide rank out of 1537. Higher occupancy signals strong local demand and financial stability.Rankings are based only on facilities in California that report data for that category. Facilities without available data are excluded from the ranking.Click the rank badge to see the full State ranking.Click here to see the full State ranking.
Avg. Length of Stay
66 days
Bed community size
99-bed community Rank #725 / 1657Bed count — State benchmarkedThis home is ranked 725th out of 1657 homes in California. Shows this facility's certified or reported bed count compared to other California facilities. Larger communities may offer more amenities, programs, and on-site services for residents and families.Rankings are based only on facilities in California that report data for that category. Facilities without available data are excluded from the ranking.Click the rank badge to see the full State ranking.Click here to see the full State ranking.
A larger shared setting that may offer more common spaces and organized community services.
Years in operation
9 years in operation Rank #703 / 1487Years in operation — State benchmarkedThis home is ranked 703rd out of 1487 homes in California. Shows how long this facility has been in operation compared to other California facilities. Longer operating histories may benefit residents, families, and staff.Rankings are based only on facilities in California that report data for that category. Facilities without available data are excluded from the ranking.Click the rank badge to see the full State ranking.Click here to see the full State ranking.
An established community with some operational experience and growing routines.
Walk Score
Walk Score: 55 / 100 Rank #1215 / 2092Walk Score — State benchmarkedThis home is ranked 1215th out of 2092 homes in California. Shows how walkable this facility's neighborhood is compared to the average Walk Score across California facilities. Higher scores benefit residents, families, and staff.Rankings are based only on facilities in California that report data for that category. Facilities without available data are excluded from the ranking.Click the rank badge to see the full State ranking.Click here to see the full State ranking.
Moderately walkable. Some errands can be accomplished on foot, with a mix of nearby amenities.
BBB Rating
BBB Rating: A+ (Not Accredited)
An independent rating from the Better Business Bureau based on factors such as complaint history, transparency, and business practices.
How BBB ratings work

About this community

License Details

CMS Certification Number56294

Contact San Joaquin Nursing and Rehabilitation Center

Inspection History

In California, the Department of Social Services (for assisted living facilities) and the Department of Public Health (for nursing homes) conduct inspections to ensure resident safety and regulatory compliance.

Health Inspection History

Inspections since 2023
Total health inspections 33

California average 12.5


Last Health inspection on Aug 2025

Total health citations
87 Rank #320 / 361Health citations — State benchmarkedThis home is ranked 320th out of 361 homes in California. Shows this facility's total health deficiency citations benchmarked to the California State average, with a ranking across all 361 CA facilities. Lower citation counts earn a better rank.Rankings are based only on facilities in California that report data for that category. Facilities without available data are excluded from the ranking.Click the rank badge to see the full State ranking.Click here to see the full State ranking.

California average 50.2

Citations per inspection
2.64 Rank #39 / 361Citations per inspection — State benchmarkedThis home is ranked 39th out of 361 homes in California. Shows average deficiency citations per CMS inspection for this facility versus the California mean across 361 facilities with citation data. Lower is better.Rankings are based only on facilities in California that report data for that category. Facilities without available data are excluded from the ranking.Click the rank badge to see the full State ranking.Click here to see the full State ranking.

California average 4.65


Health citations are formal notices following inspections when they fail to comply with safety and care standards.

45 of 87 citations resulted from standard inspections; and 42 of 87 resulted from complaint investigations.

Breakdown of citation severity (last 3 years)
Critical health citations
0
100% better than California average

California average: 0.4


Serious health citations
2
100% worse than California average

California average: 1

0 critical citations California average: 0.4

2 serious citations California average: 1

85 moderate citations California average: 47.2

0 minor citations California average: 1.5
Citations history (last 3 years)
Quality of Care moderate citation Aug 27, 2025
Corrected

Quality of Care moderate citation Aug 18, 2025
Corrected

Infection Control moderate citation Jul 11, 2025
Corrected

Quality of Care moderate citation Jul 11, 2025
Corrected

Staffing Data

Reporting period: October 1 – December 31, 2025 (Q4 2025). Source: CMS Payroll-Based Journal report.

Total staff 140
Employees 140
Contractors 0
Staff to resident ratio 1.46 : 1
20% fewer staff per resident than California average
California average ratio: 1.81 : 1 California average ratio: 1.81 : 1See full California ranking
Avg staff/day 62
Average shift 7.5 hours
0% compared with California average
California average: 7.7 hours California average shift: 7.7 hoursSee full California ranking
Total staff hours (quarter) 42,824

Nursing staff breakdown

Q4 2025 · Oct 1 – Dec 31 More info This data comes from the CMS Payroll-Based Journal report covering October 1 – December 31, 2025.
Registered Nurse

Manages medical care and health needs.

RN Staff Info All 5 RN Staff are full-time employees. No contractors work on this role. 5
Average shift length Info Average shift length. Calculated as total hours divided by days worked and average staff per day. 6.5 hours
Licensed Practical Nurse

Assists with medical care and medications.

LPN Staff Info All 28 LPN Staff are full-time employees. No contractors work on this role. 28
Average shift length Info Average shift length. Calculated as total hours divided by days worked and average staff per day. 9.6 hours
Certified Nursing Assistant

Helps with daily care and mobility.

CNA Staff Info All 68 CNA Staff are full-time employees. No contractors work on this role. 68
Average shift length Info Average shift length. Calculated as total hours divided by days worked and average staff per day. 7.3 hours

Contractor staffing

Q4 2025 · Oct 1 – Dec 31 More info This data comes from the CMS Payroll-Based Journal report covering October 1 – December 31, 2025.
Total hours from contractors 0% — all staff are direct employees this quarter

Staff by category

Q4 2025 · Oct 1 – Dec 31 More info This data comes from the CMS Payroll-Based Journal report covering October 1 – December 31, 2025.
Certified Nursing Assistant6806821,50292100%7.3
Licensed Practical Nurse2802810,44892100%9.6
Registered Nurse5051,58692100%6.5
Speech Language Pathologist7071,5688896%6.9
Physical Therapy Aide7071,2978997%5.3
Other Dietary Services Staff3031,19292100%7.8
RN Director of Nursing2021,0666874%8.1
Physical Therapy Assistant6069158390%5.7
Respiratory Therapy Technician4048647480%7.6
Nurse Practitioner1015126470%8
Dietitian2024846368%7.7
Therapeutic Recreation Specialist4044816065%7.8
Dental Services Staff1013945661%7
Qualified Social Worker1013455459%6.4
Administrator1011716470%2.7
68 Certified Nursing Assistant
% of Days 100%
28 Licensed Practical Nurse
% of Days 100%
5 Registered Nurse
% of Days 100%
7 Speech Language Pathologist
% of Days 96%
7 Physical Therapy Aide
% of Days 97%
3 Other Dietary Services Staff
% of Days 100%
2 RN Director of Nursing
% of Days 74%
6 Physical Therapy Assistant
% of Days 90%
4 Respiratory Therapy Technician
% of Days 80%
1 Nurse Practitioner
% of Days 70%
2 Dietitian
% of Days 68%
4 Therapeutic Recreation Specialist
% of Days 65%
1 Dental Services Staff
% of Days 61%
1 Qualified Social Worker
% of Days 59%
1 Administrator
% of Days 70%

Penalties and fines

Includes penalties issued in 2025

Federal penalties imposed by CMS for regulatory violations, including civil money penalties (fines) and denials of payment for new Medicare/Medicaid admissions.

Source: CMS Penalties Database (Data as of Jan 2026)

Total fines amount $73K Rank #311 / 362Federal fines — State benchmarkedThis home is ranked 311th out of 362 homes in California. Shows this facility's cumulative CMS federal fine dollars versus the California average among facilities with fines, and where it ranks among 362 facilities in the pool. Lower total dollars mean a better rank.Rankings are based only on facilities in California that report data for that category. Facilities without available data are excluded from the ranking.Click the rank badge to see the full State ranking.Click here to see the full State ranking.
33% higher than California average

California average: $55K

Number of fines 1
58% fewer fines than California average

California average: 2.4

Payment Denials Info Serious action where Medicare and/or Medicaid temporarily stops payments for new residents until issues are fixed. 0
100% fewer payment denials than California average

California average: 0.5

Fines amount comparison
This facility $73K
California average $55K
Penalty History

Penalties are imposed by CMS for violations of federal nursing home regulations.

1 penalty in the past 3 years

Jun 23, 2025 · $73K

Civil Money Penalty Info Fines imposed for noncompliance, which can be assessed per day or per instance of violation. Jun 23, 2025
$73K

Last updated: Jan 2026

Quality of care over time

These measures show how residents usually do over time at this home, based on health outcomes and preventive care.

High-risk clinical events score Info A composite score based on pressure ulcers, falls with injury, weight loss, walking ability decline, and activities of daily living decline. 3.0
55% better than California average

California average: 6.6

Functional decline score Info A composite score based on activities of daily living decline, walking ability decline, and incontinence. 2.9
75% better than California average

California average: 11.3

Long-stay resident measures
Significantly above average California avg: 4.2 Info CMS star rating based on long-stay quality measure performance. 5 stars = significantly above average, 1 star = significantly below average.
Need for Help with Daily Activities Increased Info Percent of long-stay residents whose need for help with daily activities has increased 2.1%
81% better than California average

California average: 11.1%

Walking Ability Worsened Info Percent of long-stay residents whose ability to move independently worsened 0.0%
100% better than California average

California average: 12.0%

Low Risk Residents with Bowel/Bladder Incontinence Info Percent of low risk long-stay residents who lose control of their bowels or bladder 6.5%
43% better than California average

California average: 11.3%

Falls with Major Injury Info Percent of long-stay residents experiencing one or more falls with major injury 1.8%
10% worse than California average

California average: 1.7%

High Risk Residents with Pressure Ulcers Info Percent of long-stay high risk residents with pressure ulcers 2.3%
53% better than California average

California average: 5.0%

Urinary Tract Infection Info Percent of long-stay residents with a urinary tract infection 0.0%
100% better than California average

California average: 1.2%

Lost Too Much Weight Info Percent of long-stay residents who lose too much weight 8.7%
106% worse than California average

California average: 4.2%

Depressive Symptoms Info Percent of long-stay residents who have depressive symptoms 4.4%
35% better than California average

California average: 6.7%

Antipsychotic Use Info Percent of long-stay residents who received an antipsychotic medication 0.0%
100% better than California average

California average: 10.1%

Pneumococcal Vaccine Info Percent of long-stay residents assessed and appropriately given the pneumococcal vaccine 100.0%
In line with California average

California average: 98.5%

Influenza Vaccine Info Percent of long-stay residents assessed and appropriately given the seasonal influenza vaccine 100.0%
In line with California average

California average: 98.2%

Hospitalizations per 1,000 days Info Number of hospitalizations per 1,000 long-stay resident days. 1.92
15% better than California average

California average: 2.25

ED visits per 1,000 days Info Number of outpatient emergency department visits per 1,000 long-stay resident days. 1.90
19% worse than California average

California average: 1.59

Short-stay resident measures
Average California avg: 3.5 Info CMS star rating based on short-stay quality measure performance. 5 stars = much above average, 1 star = much below average.
Pneumococcal Vaccine Info Percent of short-stay residents assessed and appropriately given the pneumococcal vaccine 100.0%
6% better than California average

California average: 94.0%

Antipsychotic medication increase Info Percent of short-stay residents who newly received an antipsychotic medication 0.9%
40% better than California average

California average: 1.5%

Influenza Vaccine Info Percent of short-stay residents assessed and appropriately given the seasonal influenza vaccine 100.0%
7% better than California average

California average: 93.2%

Re-hospitalized after SNF stay Info Percentage of short-stay residents who were re-hospitalized after their nursing home admission. 20.4%
12% better than California average

California average: 23.2%

Emergency department visits Info Percentage of short-stay residents who had an outpatient emergency department visit. 12.8%
14% worse than California average

California average: 11.2%

Falls with major injury Info Percentage of SNF residents who experience falls with major injury during their stay. 0.0%
100% better than California average

California average: 0.8%

Ability to care for self at discharge Info Percentage of residents at or above expected ability to care for themselves at discharge. 35.5%
34% worse than California average

California average: 53.7%

Successful return to home or community Info Rate of successful return to home or community from a skilled nursing facility. 52.0%
In line with California average

California average: 50.6%

Breakdown by payment type

Medicare

29% of new residents, usually for short-term rehab.

Typical stay 2 - 3 months

Private pay

66% of new residents, often for short stays.

Typical stay 2 - 3 months

Medicaid

5% of new residents, often for long-term daily care.

Typical stay 5 months

Facility Characteristics

Source: CMS Long-Term Care Facility Characteristics (Data as of Jan 2026)

Total residents 96
Medicare
47
49% of residents
Medicaid
48
50% of residents
Private pay or other
1
1% of residents
Programs & Services
Residents Group

Residents meet regularly to discuss policies, care quality, and activities

CCRC

Part of a Continuing Care Retirement Community offering multiple care levels

Active Resident Council

Organized group of residents that meets regularly to discuss facility policies, quality of life, and activities.

Finances and operations

Based on CMS SNF Cost Report for fiscal year ending in 12/2023.

Privately-owned community
Operated by a single business entity.
Net patient revenue Info Net patient revenue — what the home actually collects for resident care, after contractual allowances, bad debt and discounts are subtracted from its gross charges (CMS cost report, Worksheet G-3). It covers resident care only; money the home earns from other sources is shown separately as "Other income."
$17.1M
Net patient income Info Net patient income: net patient revenue minus the home's total operating expenses. A positive figure means it earns more from resident care than it spends to deliver it; a negative figure means the opposite. It excludes non-operating "other income."
$1.9M
Privately-owned community Operated by a single business entity.
Net patient revenue Info Net patient revenue — what the home actually collects for resident care, after contractual allowances, bad debt and discounts are subtracted from its gross charges (CMS cost report, Worksheet G-3). It covers resident care only; money the home earns from other sources is shown separately as "Other income."
$17.1M Rank #129 / 355Revenue — State benchmarkedThis home is ranked 129th out of 355 homes in California. Shows this facility's annual revenue compared to the California average. Higher revenue generally means more resources for staffing and capital — read alongside Payroll %.Rankings are based only on facilities in California that report data for that category. Facilities without available data are excluded from the ranking.Click the rank badge to see the full State ranking.Click here to see the full State ranking.
Net patient income Info Net patient income: net patient revenue minus the home's total operating expenses. A positive figure means it earns more from resident care than it spends to deliver it; a negative figure means the opposite. It excludes non-operating "other income."
$1.9M
Other income Info Money the home earns outside of resident care — such as investments, grants, rentals and other non-operating sources (CMS cost report, Worksheet G-3). It is tracked separately from net patient revenue: it is not part of that figure, and it is not included in net patient income.
$23.0K
Payroll costs Info Staff salaries plus wage-related costs — benefits such as payroll taxes, health insurance and retirement — from the home's own accounting records (CMS cost report, Worksheet A). Contract or agency labor is counted separately, under other operating costs. Rank #166 / 355Payroll — State benchmarkedThis home is ranked 166th out of 355 homes in California. Shows total annual staff payroll benchmarked to the California average. Higher payroll investment relative to peers often signals better staffing and less reliance on cheaper contract labor.Rankings are based only on facilities in California that report data for that category. Facilities without available data are excluded from the ranking.Click the rank badge to see the full State ranking.Click here to see the full State ranking.
$8.8M 51.3% of net patient revenue Info Payroll as a share of revenue: staff salaries and wage-related benefits divided by net patient revenue. A higher figure means more of each revenue dollar goes to staff pay. Rank #263 / 355Payroll % — State benchmarkedThis home is ranked 263rd out of 355 homes in California. Shows payroll as a percentage of revenue versus the California average. Well-run California facilities typically land around 56–67% — the top third Statewide. Below 25% may signal understaffing or heavy agency use — read with Staffing ratings.Rankings are based only on facilities in California that report data for that category. Facilities without available data are excluded from the ranking.Click the rank badge to see the full State ranking.Click here to see the full State ranking.
Other operating costs Info Everything it costs to run the home apart from payroll — food, utilities, supplies, maintenance, contract labor and administration. Calculated as total operating expense minus payroll (staff salaries and wage-related benefits).
$6.4M
Total costs Info The home's total operating expense for the year — all the costs of running it, salaries included (CMS cost report, Worksheet G-3).
$15.2M

What does this home offer?

Building type icon
Building type icon

Building Type: Single-story

Who this home usually serves

TYPE OF STAY

Primarily short stays

Residents typically stay for brief periods, with frequent admissions and discharges throughout the year.

Most new residents arrive under private pay (66% of admissions), and a typical private pay stay runs around 2 - 3 months.

Admissions
417 total

Coverage residents most often arrive under.

Medicare 29%
Private pay 66%
Medicaid 5%
Discharges
514 total

Coverage residents most often leave under.

Medicare 50%
Private pay 50%

Places of interest near San Joaquin Nursing and Rehabilitation Center

Address 2.0 miles from city center Info Estimated distance in miles from Bakersfield's city center to San Joaquin Nursing and Rehabilitation Center's address, calculated via Google Maps.

Calculate Travel Distance to San Joaquin Nursing and Rehabilitation Center

Add your location

Address

Compare Nursing Homes around Bakersfield

The information below is reported by the California Department of Social Services and Department of Public Health.

5 facilities compared · CMS & CA Dept. of Health data

San Joaquin Nursing and Rehabilitation Center
NH
HC
MC
Bakersfield (Homaker Park)
99
Facility 99
CA AVG 103
Rank #725 / 1657
93.7%
Facility 93.7%
CA AVG 84.7%
Rank #167 / 1537
+11%
3.70
Facility 3.70
CA AVG 4.22
Rank #245 / 354
-60%-12%
$47.2k
Facility $47.2k
CA AVG $56.5k
Rank #311 / 362
-
87
Facility 87
CA AVG 50.2
Rank #320 / 361
2.6
Facility 2.6
CA AVG 4.6
Rank #39 / 361
289A+
55
Facility 55
CA AVG 57
Rank #1215 / 2092
Bryce Blood
$17.1M
Facility $17.1M
CA AVG $17.0M
Rank #129 / 355
$8.8M
Facility $8.8M
CA AVG $7.0M
Rank #166 / 355
51.3%
Facility 51.3%
CA AVG 45.2%
Rank #263 / 355
56294
Brookdale Riverwalk
NH
AL
IL
MC
Bakersfield (Fairway Oaks)
376
Facility 376
CA AVG 103
Rank #32 / 1657
66.0%
Facility 66.0%
CA AVG 84.7%
Rank #1099 / 1537
-22%
4.35
Facility 4.35
CA AVG 4.22
Rank #122 / 354
+1%+3%
$56.3k
Facility $56.3k
CA AVG $56.5k
Rank #320 / 362
65
Facility 65
CA AVG 81
Rank #1237 / 1401
69
Facility 69
CA AVG 50.2
Rank #296 / 361
2.6
Facility 2.6
CA AVG 4.6
Rank #39 / 361
1248-
32
Facility 32
CA AVG 57
Rank #1693 / 2092
Brookdale Gardens Inc
$15.6M
Facility $15.6M
CA AVG $17.0M
Rank #131 / 355
$8.7M
Facility $8.7M
CA AVG $7.0M
Rank #170 / 355
55.6%
Facility 55.6%
CA AVG 45.2%
Rank #257 / 355
555771
Height Street Skilled Care
NH
HC
NC
PC
RC
Bakersfield
99
Facility 99
CA AVG 103
Rank #725 / 1657
46.3%
Facility 46.3%
CA AVG 84.7%
Rank #1409 / 1537
-45%
4.19
Facility 4.19
CA AVG 4.22
Rank #138 / 354
-24%-1%
$12.7k
Facility $12.7k
CA AVG $56.5k
Rank #253 / 362
-
65
Facility 65
CA AVG 50.2
Rank #286 / 361
2.6
Facility 2.6
CA AVG 4.6
Rank #39 / 361
391A+
73
Facility 73
CA AVG 57
Rank #642 / 2092
Cep Holdings LLC
$12.2M
Facility $12.2M
CA AVG $17.0M
Rank #186 / 355
$9.3M
Facility $9.3M
CA AVG $7.0M
Rank #145 / 355
76.1%
Facility 76.1%
CA AVG 45.2%
Rank #87 / 355
555902
The Orchards Post-Acute
NH
AL
IL
MC
Bakersfield (Homaker Park)
150
Facility 150
CA AVG 103
Rank #343 / 1657
87.4%
Facility 87.4%
CA AVG 84.7%
Rank #398 / 1537
+3%
3.93
Facility 3.93
CA AVG 4.22
Rank #206 / 354
+4%-7%
$9.2k
Facility $9.2k
CA AVG $56.5k
Rank #236 / 362
-
96
Facility 96
CA AVG 50.2
Rank #336 / 361
2.8
Facility 2.8
CA AVG 4.6
Rank #50 / 361
2140-
60
Facility 60
CA AVG 57
Rank #1050 / 2092
-
$18.6M
Facility $18.6M
CA AVG $17.0M
Rank #139 / 355
$9.5M
Facility $9.5M
CA AVG $7.0M
Rank #90 / 355
51%
Facility 51%
CA AVG 45.2%
Rank #113 / 355
555702
Kern River Transitional Care
NH
Bakersfield (South San Lauren)
140
Facility 140
CA AVG 103
Rank #419 / 1657
95.6%
Facility 95.6%
CA AVG 84.7%
Rank #184 / 1537
+13%
3.46
Facility 3.46
CA AVG 4.22
Rank #296 / 354
-23%-18%
$77.7k
Facility $77.7k
CA AVG $56.5k
Rank #335 / 362
-
99
Facility 99
CA AVG 50.2
Rank #340 / 361
2.8
Facility 2.8
CA AVG 4.6
Rank #50 / 361
1133-
27
Facility 27
CA AVG 57
Rank #1760 / 2092
-
$29.3M
Facility $29.3M
CA AVG $17.0M
Rank #29 / 355
$13.7M
Facility $13.7M
CA AVG $7.0M
Rank #43 / 355
46.6%
Facility 46.6%
CA AVG 45.2%
Rank #308 / 355
555912

Financial Assistance for
Nursing Home in California

San Joaquin Nursing and Rehabilitation Center is located in Bakersfield, California.
Here are the financial assistance programs available to residents in California.

Get Financial aid guidance

Multipurpose Senior Services Program

MSSP (Medi-Cal Waiver)

Age 65+
General California resident, Medi-Cal eligible, nursing home risk.
Income Limits (2025) ~$2,829/month 300% FBR, individual
Asset Limits $2,000 (individual), $3,000 (couple).
CA

County-managed; waitlists possible.

Benefits
In-home support (4-6 hours/day) Respite care (14 days/year) Meals (~$6/meal) Transportation (8 trips/month) Care management

In-Home Supportive Services (IHSS)

California IHSS

Age 65+
General California resident, Medicaid-eligible or low-income.
Income Limits ~$1,732/month individual, Medi-Cal threshold
Asset Limits $2,000 individual
CA

Can hire family as caregivers.

Benefits
Personal care (up to 283 hours/month) Homemaker services Respite (varies)

Multipurpose Senior Services Program (MSSP)

CA MSSP

Age 65+
General California resident, Medi-Cal-eligible, nursing home-eligible but community-capable.
Income Limits ~$2,829/month 300% FBR, individual
Asset Limits $2,000 individual
CA

Available in 38 counties; waitlists common.

Benefits
Case management Respite care (up to 10 days/year) Minor home mods (avg. $500) Adult day care (~$50/day)

Property Tax Postponement Program (PTP)

CA PTP

Age 62+
General California resident, own and live in home, 40% equity.
Income Limits (2025) ~$51,500/year household, adjusted annually
Asset Limits Equity-based; no strict asset cap.
CA

Deferred taxes accrue interest (5% as of 2024); repaid upon sale/death.

Benefits
Property tax deferral (avg. $1,000-$3,000/year, varies by county)

Assisted Living Waiver (ALW)

CA ALW

Age 65+ or disabled
General California resident, Medi-Cal-eligible, nursing home-eligible.
Income Limits ~$2,829/month 300% FBR, individual
Asset Limits $2,000 individual
CA

Available in 15 counties (e.g., LA, Sacramento); waitlists common.

Benefits
Personal care in ALFs (5-7 hours/day) Medication management Social services

California CARES Program

CA CARES

Age
General Caregivers of California residents 60+ needing help with 3+ daily activities; no caregiver age limit.
Income Limits No strict limit; cost-sharing above ~$2,500/month threshold.
Asset Limits Not applicable; need-based.
CA

High demand in urban areas; complements IHSS respite.

Benefits
Respite care (up to 10 days/year) Counseling (4-6 sessions/year) Training (2-3 workshops/year) Supplies (~$200/year)

Frequently Asked Questions about San Joaquin Nursing and Rehabilitation Center

What neighborhood is San Joaquin Nursing and Rehabilitation Center in?

San Joaquin Nursing and Rehabilitation Center is in the Homaker Park neighborhood of Bakersfield.

Is San Joaquin Nursing and Rehabilitation Center in a walkable area?

San Joaquin Nursing and Rehabilitation Center has a walk score of 55. Moderately walkable. Some errands can be accomplished on foot, with a mix of nearby amenities.

What is the occupancy rate at San Joaquin Nursing and Rehabilitation Center?

San Joaquin Nursing and Rehabilitation Center's occupancy is 93.7%.

Are there photos of San Joaquin Nursing and Rehabilitation Center?

Yes — there are 4 photos of San Joaquin Nursing and Rehabilitation Center in the photo gallery on this page.

What is the address of San Joaquin Nursing and Rehabilitation Center?

San Joaquin Nursing and Rehabilitation Center is located at 3601 San Dimas St, Bakersfield, CA 93301.

What is the phone number of San Joaquin Nursing and Rehabilitation Center?

(661) 323-2894 will put you in contact with the team at San Joaquin Nursing and Rehabilitation Center.

Is San Joaquin Nursing and Rehabilitation Center Medicare or Medicaid certified?

Yes — San Joaquin Nursing and Rehabilitation Center is a CMS-certified provider of Medicare and Medicaid.

Guides for Better Senior Living

Care Cost Calculator: See Prices in Your Area

Nursing Home Data Explorer

Don’t Wait Too Long: 7 Red Flag Signs Your Parent Needs Assisted Living Now

The True Cost of Assisted Living in 2025 – And How Families Are Paying For It

Understanding Senior Living Costs: Pricing Models, Discounts & Financial Assistance