Bakersfield Post Acute
CMS overall rating Info CMS (the Centers for Medicare & Medicaid Services) is the federal agency that rates nursing home quality. Its Overall Rating runs from 1 to 5 stars, combining health inspections, staffing, and quality measures, with inspections weighted most heavily.

Bakersfield Post Acute

CMS overall rating Info CMS (the Centers for Medicare & Medicaid Services) is the federal agency that rates nursing home quality. Its Overall Rating runs from 1 to 5 stars, combining health inspections, staffing, and quality measures, with inspections weighted most heavily.
Calculator: See prices in your area
Bakersfield Post Acute accepts Medicare, Medicaid, and private pay.

Overview of Bakersfield Post Acute

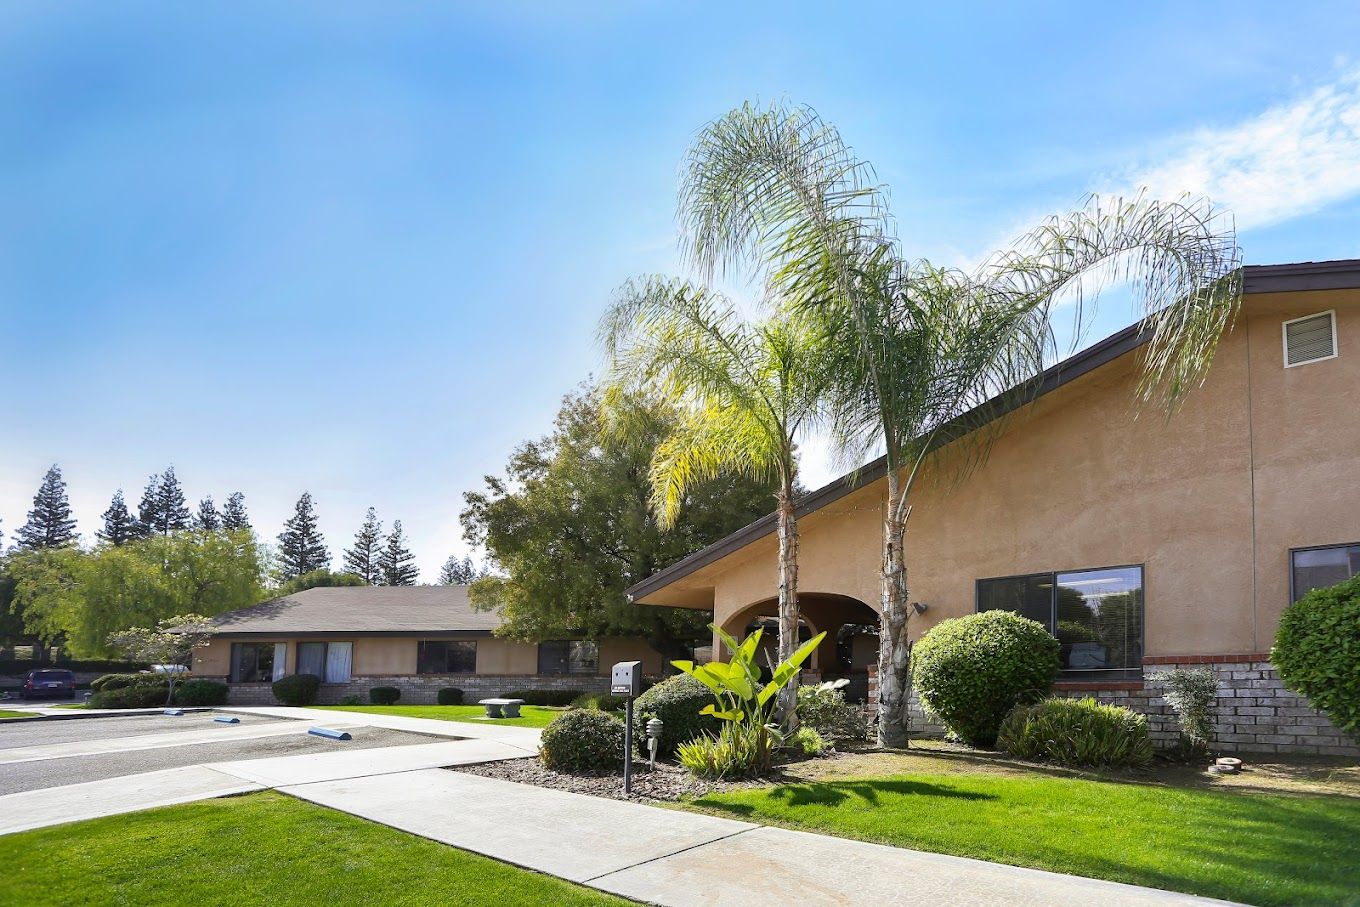
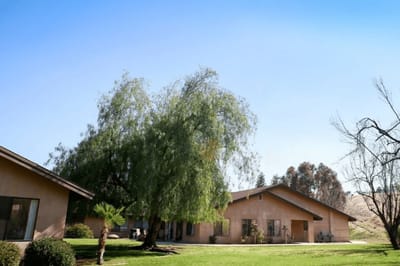
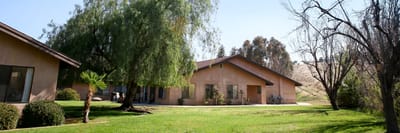
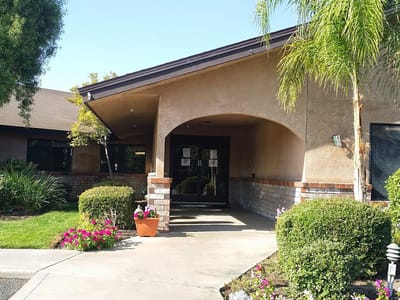
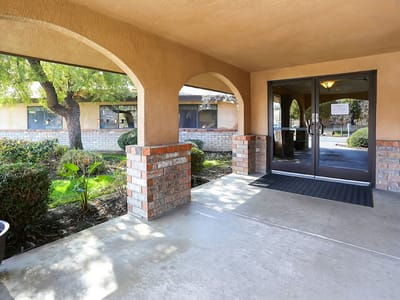
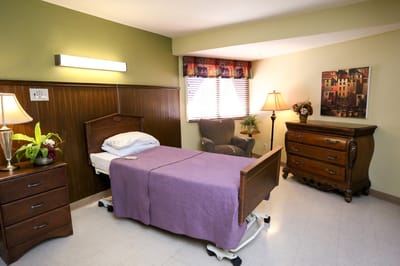
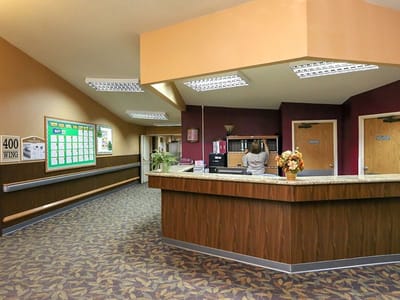
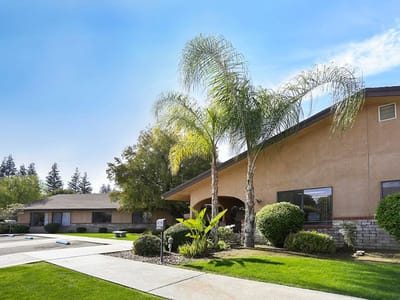
Nestled in Bakersfield, California, Bakersfield Post Acute is a dependable senior care provider that offers an excellent array of rehabilitation and long-term care services. They feature a reliable team of professionals to care for residents after their surgery, illness, or injury, helping them enjoy a speedy recovery. The community provides each resident with comfortable accommodations that give them the comfort and privacy they need to heal, combined with round the clock care from skilled and dependable nurses.

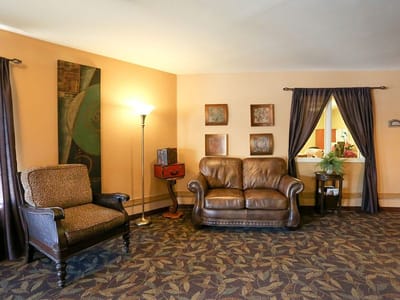
At Bakersfield Post Acute, they strive to create an environment where residents can stay for as long as they need to heal successfully with all the comforts of home and the convenience of excellent care services. The community also conducts a wide variety of activities to make sure residents stay active and engaged. Residents are also offered support after their discharge to make sure they can safely return to their home and routines.

(661) 871-3133

Quality ratings

Measured by Centers for Medicare & Medicaid Services (CMS)

Overall rating Info The Overall CMS Rating combines results from health inspections, staffing levels and quality measures. Health inspections carry the most weight. Staffing and quality scores can increase or decrease the final rating based on performance compared to state and national standards.
▼ 68.2% Below CA avg. ▼ 68.2% Below CA avg.CA average: 3.1Click the badge to see the full State ranking.Click here to see the full State ranking.
Health Inspection Info Based on the results of the facility's three most recent standard inspections and any complaint investigations. CMS reviews the number, scope, and severity of deficiencies, with more recent findings weighted more heavily.
▼ 64.2% Below CA avg. ▼ 64.2% Below CA avg.CA average: 2.8Click the badge to see the full State ranking.Click here to see the full State ranking.
Staffing Info Measures average nursing staff hours per resident per day, including Registered Nurses (RNs) and total nursing staff. Ratings are adjusted based on the level of care residents require and are compared to state and national benchmarks.
▼ 36.3% Below CA avg. ▼ 36.3% Below CA avg.CA average: 3.1Click the badge to see the full State ranking.Click here to see the full State ranking.
Quality Measures Info Based on clinical and physical health indicators reported to CMS, such as hospital readmissions, falls, pressure ulcers, and improvements in mobility. These measures reflect how well residents' health needs are being managed.
▼ 2.1% Below CA avg. ▼ 2.1% Below CA avg.CA average: 4.1Click the badge to see the full State ranking.Click here to see the full State ranking.

Staffing hours breakdown

Info Daily nursing hours per resident by staff type, reported to CMS. Higher is generally better — compare this facility to state and national averages to see where staffing stands.

Hours per resident per day — compared to California state averages

Total nursing care / resident Info This home is ranked 316th out of 354 homes in California for nurse hours. Total adjusted nursing hours per resident per day, combining RN, LPN, and aide time. CMS adjusts this for case-mix so facilities can be fairly compared.
3h 24m per day
Rank #316 / 354Nurse hours — State benchmarkedThis home is ranked 316th out of 354 homes in California. Shows adjusted nurse hours per resident per day benchmarked to the California average, with a ranking across 354 California facilities. More hours mean more direct care. The national average is about 3.5 hrs; below 3.0 is a red flag.Rankings are based only on facilities in California that report data for that category. Facilities without available data are excluded from the ranking.Click the rank badge to see the full State ranking.Click here to see the full State ranking.
This facility California avg (4h 13m per day)
vs California avg
-20%

6 of 6 metrics below state avg

Staff typeHours / Day / Residentvs state avg
Registered Nurse (RN) Info RNs hold the highest nursing license and can assess residents, interpret test results, and direct care plans. More RN hours per day often signals stronger clinical oversight and faster response to health changes. 19m per day ▼ 51% State avg: 39m per day · National avg: 41m per day
LPN / LVN Info Licensed Practical Nurses (LPNs) or Licensed Vocational Nurses (LVNs) deliver routine hands-on care — medication administration, wound dressing, and monitoring vital signs. They work under RN supervision and make up a large share of daily bedside care. 1h 6m per day ▼ 10% State avg: 1h 13m per day · National avg: 52m per day
Nurse Aide Info Certified Nurse Aides (CNAs) provide the most direct day-to-day assistance: bathing, dressing, feeding, and mobility. Nurse aide hours are typically the largest staffing category and directly affect residents' quality of life. 2h 28m per day ▼ 7% State avg: 2h 39m per day · National avg: 2h 21m per day
Weekend Total Nursing Info Combined nursing hours (RN + LPN + Nurse Aide) per resident per day on weekends. Staffing often drops on weekends — this figure reveals whether the facility maintains adequate coverage outside of weekday hours. 3h 27m per day ▼ 16% State avg: 4h 5m per day · National avg: 3h 26m per day
Physical Therapist Info Hours per resident per day provided by licensed Physical Therapists (PTs) or PT Assistants. PT services help residents recover mobility after injury or illness and are especially important for post-acute (short-stay) rehabilitation. 2m per day ▼ 53% State avg: 5m per day · National avg: 4m per day
Weekend RN Info Registered nurse hours specifically on weekends. Facilities sometimes reduce RN presence on Saturdays and Sundays — a low weekend RN figure compared to weekday hours can indicate reduced clinical oversight when most administrative staff are absent. 15m per day ▼ 51% State avg: 30m per day · National avg: 29m per day

Capacity and availability

This home usually has limited availability

Higher occupancy than the California average: 84.7%
Occupancy rate
94.5% Rank #211 / 1537Occupancy rate — State benchmarkedThis home is ranked 211th out of 1537 homes in California. Shows this facility's occupancy rate versus the California average, with its Statewide rank out of 1537. Higher occupancy signals strong local demand and financial stability.Rankings are based only on facilities in California that report data for that category. Facilities without available data are excluded from the ranking.Click the rank badge to see the full State ranking.Click here to see the full State ranking.
Avg. Length of Stay
236 days
Bed community size
99-bed community Rank #725 / 1657Bed count — State benchmarkedThis home is ranked 725th out of 1657 homes in California. Shows this facility's certified or reported bed count compared to other California facilities. Larger communities may offer more amenities, programs, and on-site services for residents and families.Rankings are based only on facilities in California that report data for that category. Facilities without available data are excluded from the ranking.Click the rank badge to see the full State ranking.Click here to see the full State ranking.
A larger shared setting that may offer more common spaces and organized community services.
Walk Score
Walk Score: 2 / 100 Rank #2044 / 2092Walk Score — State benchmarkedThis home is ranked 2044th out of 2092 homes in California. Shows how walkable this facility's neighborhood is compared to the average Walk Score across California facilities. Higher scores benefit residents, families, and staff.Rankings are based only on facilities in California that report data for that category. Facilities without available data are excluded from the ranking.Click the rank badge to see the full State ranking.Click here to see the full State ranking.
Car-dependent. Most errands require a car, with limited nearby walkable options.

About this community

Therapy & Rehabilitation

1 service
Rehabilitation Services

Contact Bakersfield Post Acute

Staffing Data

Reporting period: October 1 – December 31, 2025 (Q4 2025). Source: CMS Payroll-Based Journal report.

Total staff 132
Employees 132
Contractors 0
Staff to resident ratio 1.40 : 1
23% fewer staff per resident than California average
California average ratio: 1.81 : 1 California average ratio: 1.81 : 1See full California ranking
Avg staff/day 55
Average shift 7.6 hours
0% compared with California average
California average: 7.7 hours California average shift: 7.7 hoursSee full California ranking
Total staff hours (quarter) 38,678

Nursing staff breakdown

Q4 2025 · Oct 1 – Dec 31 More info This data comes from the CMS Payroll-Based Journal report covering October 1 – December 31, 2025.
Registered Nurse

Manages medical care and health needs.

RN Staff Info All 10 RN Staff are full-time employees. No contractors work on this role. 10
Average shift length Info Average shift length. Calculated as total hours divided by days worked and average staff per day. 8 hours
Licensed Practical Nurse

Assists with medical care and medications.

LPN Staff Info All 28 LPN Staff are full-time employees. No contractors work on this role. 28
Average shift length Info Average shift length. Calculated as total hours divided by days worked and average staff per day. 8.2 hours
Certified Nursing Assistant

Helps with daily care and mobility.

CNA Staff Info All 67 CNA Staff are full-time employees. No contractors work on this role. 67
Average shift length Info Average shift length. Calculated as total hours divided by days worked and average staff per day. 7.7 hours

Contractor staffing

Q4 2025 · Oct 1 – Dec 31 More info This data comes from the CMS Payroll-Based Journal report covering October 1 – December 31, 2025.
Total hours from contractors 0% — all staff are direct employees this quarter

Staff by category

Q4 2025 · Oct 1 – Dec 31 More info This data comes from the CMS Payroll-Based Journal report covering October 1 – December 31, 2025.
Certified Nursing Assistant6706720,66792100%7.7
Licensed Practical Nurse280288,35892100%8.2
Registered Nurse100102,12692100%8
Other Dietary Services Staff3031,21192100%7.7
Physical Therapy Aide3031,1318693%6.3
Dental Services Staff2021,0246470%8
RN Director of Nursing3038486470%8
Speech Language Pathologist3037526874%6.9
Physical Therapy Assistant5056826874%5.5
Administrator1015126470%8
Nurse Practitioner1015126470%8
Dietitian1014445459%8.2
Respiratory Therapy Technician3033267885%3.9
Qualified Social Worker101772628%3
Clinical Nurse Specialist101811%8
67 Certified Nursing Assistant
% of Days 100%
28 Licensed Practical Nurse
% of Days 100%
10 Registered Nurse
% of Days 100%
3 Other Dietary Services Staff
% of Days 100%
3 Physical Therapy Aide
% of Days 93%
2 Dental Services Staff
% of Days 70%
3 RN Director of Nursing
% of Days 70%
3 Speech Language Pathologist
% of Days 74%
5 Physical Therapy Assistant
% of Days 74%
1 Administrator
% of Days 70%
1 Nurse Practitioner
% of Days 70%
1 Dietitian
% of Days 59%
3 Respiratory Therapy Technician
% of Days 85%
1 Qualified Social Worker
% of Days 28%
1 Clinical Nurse Specialist
% of Days 1%

Penalties and fines

Includes penalties issued in 2023-2024

Federal penalties imposed by CMS for regulatory violations, including civil money penalties (fines) and denials of payment for new Medicare/Medicaid admissions.

Source: CMS Penalties Database (Data as of Jan 2026)

Total fines amount $31K Rank #275 / 362Federal fines — State benchmarkedThis home is ranked 275th out of 362 homes in California. Shows this facility's cumulative CMS federal fine dollars versus the California average among facilities with fines, and where it ranks among 362 facilities in the pool. Lower total dollars mean a better rank.Rankings are based only on facilities in California that report data for that category. Facilities without available data are excluded from the ranking.Click the rank badge to see the full State ranking.Click here to see the full State ranking.
43% lower than California average

California average: $55K

Number of fines 3
27% more fines than California average

California average: 2.4

Payment Denials Info Serious action where Medicare and/or Medicaid temporarily stops payments for new residents until issues are fixed. 1
102% more payment denials than California average

California average: 0.5

Fines amount comparison
This facility $31K
California average $55K
Penalty History

Penalties are imposed by CMS for violations of federal nursing home regulations.

3 penalties in the past 3 years

Multiple penalties were reported in the last 3 years.

Civil Money Penalty Info Fines imposed for noncompliance, which can be assessed per day or per instance of violation. Oct 17, 2024
$13K
Payment Denial Info Serious action where Medicare and/or Medicaid temporarily stops payments for new residents until issues are fixed. Oct 17, 2024
31 days
Civil Money Penalty Info Fines imposed for noncompliance, which can be assessed per day or per instance of violation. Oct 26, 2023
$13K

Last updated: Jan 2026

Quality of care over time

These measures show how residents usually do over time at this home, based on health outcomes and preventive care.

High-risk clinical events score Info A composite score based on pressure ulcers, falls with injury, weight loss, walking ability decline, and activities of daily living decline. 2.9
56% better than California average

California average: 6.6

Functional decline score Info A composite score based on activities of daily living decline, walking ability decline, and incontinence. 4.4
61% better than California average

California average: 11.3

Long-stay resident measures
Significantly above average California avg: 4.2 Info CMS star rating based on long-stay quality measure performance. 5 stars = significantly above average, 1 star = significantly below average.
Need for Help with Daily Activities Increased Info Percent of long-stay residents whose need for help with daily activities has increased 2.3%
79% better than California average

California average: 11.1%

Walking Ability Worsened Info Percent of long-stay residents whose ability to move independently worsened 6.8%
43% better than California average

California average: 12.0%

Low Risk Residents with Bowel/Bladder Incontinence Info Percent of low risk long-stay residents who lose control of their bowels or bladder 4.1%
64% better than California average

California average: 11.3%

Falls with Major Injury Info Percent of long-stay residents experiencing one or more falls with major injury 1.4%
17% better than California average

California average: 1.7%

High Risk Residents with Pressure Ulcers Info Percent of long-stay high risk residents with pressure ulcers 2.0%
60% better than California average

California average: 5.0%

Urinary Tract Infection Info Percent of long-stay residents with a urinary tract infection 0.4%
71% better than California average

California average: 1.2%

Lost Too Much Weight Info Percent of long-stay residents who lose too much weight 2.0%
54% better than California average

California average: 4.2%

Depressive Symptoms Info Percent of long-stay residents who have depressive symptoms 3.0%
55% better than California average

California average: 6.7%

Antipsychotic Use Info Percent of long-stay residents who received an antipsychotic medication 3.2%
68% better than California average

California average: 10.1%

Pneumococcal Vaccine Info Percent of long-stay residents assessed and appropriately given the pneumococcal vaccine 100.0%
In line with California average

California average: 98.5%

Influenza Vaccine Info Percent of long-stay residents assessed and appropriately given the seasonal influenza vaccine 100.0%
In line with California average

California average: 98.2%

Hospitalizations per 1,000 days Info Number of hospitalizations per 1,000 long-stay resident days. 1.56
31% better than California average

California average: 2.25

ED visits per 1,000 days Info Number of outpatient emergency department visits per 1,000 long-stay resident days. 2.62
65% worse than California average

California average: 1.59

Short-stay resident measures
Significantly below average California avg: 3.5 Info CMS star rating based on short-stay quality measure performance. 5 stars = much above average, 1 star = much below average.
Pneumococcal Vaccine Info Percent of short-stay residents assessed and appropriately given the pneumococcal vaccine 99.1%
5% better than California average

California average: 94.0%

Antipsychotic medication increase Info Percent of short-stay residents who newly received an antipsychotic medication 0.5%
63% better than California average

California average: 1.5%

Influenza Vaccine Info Percent of short-stay residents assessed and appropriately given the seasonal influenza vaccine 98.7%
6% better than California average

California average: 93.2%

Re-hospitalized after SNF stay Info Percentage of short-stay residents who were re-hospitalized after their nursing home admission. 27.5%
19% worse than California average

California average: 23.2%

Emergency department visits Info Percentage of short-stay residents who had an outpatient emergency department visit. 11.4%
In line with California average

California average: 11.2%

Falls with major injury Info Percentage of SNF residents who experience falls with major injury during their stay. 1.0%
25% worse than California average

California average: 0.8%

Ability to care for self at discharge Info Percentage of residents at or above expected ability to care for themselves at discharge. 13.3%
75% worse than California average

California average: 53.7%

Successful return to home or community Info Rate of successful return to home or community from a skilled nursing facility. 43.1%
15% worse than California average

California average: 50.6%

Breakdown by payment type

Medicare

71% of new residents, usually for short-term rehab.

Typical stay 3 - 4 months

Private pay

14% of new residents, often for short stays.

Typical stay 5 years

Medicaid

15% of new residents, often for long-term daily care.

Typical stay 11 - 12 months

Facility Characteristics

Source: CMS Long-Term Care Facility Characteristics (Data as of Jan 2026)

Total residents 94
Medicare
10
10.6% of residents
Medicaid
60
63.8% of residents
Private pay or other
24
25.5% of residents
Programs & Services
Residents Group

Residents meet regularly to discuss policies, care quality, and activities

Nurse Aide Training

State-approved Nurse Aide Training and Competency Evaluation Program on-site

Active Resident Council

Organized group of residents that meets regularly to discuss facility policies, quality of life, and activities.

Finances and operations

Based on CMS SNF Cost Report for fiscal year ending in 12/2023.

Privately-owned community
Operated by a single business entity.
Net patient revenue Info Net patient revenue — what the home actually collects for resident care, after contractual allowances, bad debt and discounts are subtracted from its gross charges (CMS cost report, Worksheet G-3). It covers resident care only; money the home earns from other sources is shown separately as "Other income."
$11.4M
Net patient income Info Net patient income: net patient revenue minus the home's total operating expenses. A positive figure means it earns more from resident care than it spends to deliver it; a negative figure means the opposite. It excludes non-operating "other income."
$1.1M
Privately-owned community Operated by a single business entity.
Net patient revenue Info Net patient revenue — what the home actually collects for resident care, after contractual allowances, bad debt and discounts are subtracted from its gross charges (CMS cost report, Worksheet G-3). It covers resident care only; money the home earns from other sources is shown separately as "Other income."
$11.4M Rank #223 / 355Revenue — State benchmarkedThis home is ranked 223rd out of 355 homes in California. Shows this facility's annual revenue compared to the California average. Higher revenue generally means more resources for staffing and capital — read alongside Payroll %.Rankings are based only on facilities in California that report data for that category. Facilities without available data are excluded from the ranking.Click the rank badge to see the full State ranking.Click here to see the full State ranking.
Net patient income Info Net patient income: net patient revenue minus the home's total operating expenses. A positive figure means it earns more from resident care than it spends to deliver it; a negative figure means the opposite. It excludes non-operating "other income."
$1.1M
Other income Info Money the home earns outside of resident care — such as investments, grants, rentals and other non-operating sources (CMS cost report, Worksheet G-3). It is tracked separately from net patient revenue: it is not part of that figure, and it is not included in net patient income.
$952
Payroll costs Info Staff salaries plus wage-related costs — benefits such as payroll taxes, health insurance and retirement — from the home's own accounting records (CMS cost report, Worksheet A). Contract or agency labor is counted separately, under other operating costs. Rank #272 / 355Payroll — State benchmarkedThis home is ranked 272nd out of 355 homes in California. Shows total annual staff payroll benchmarked to the California average. Higher payroll investment relative to peers often signals better staffing and less reliance on cheaper contract labor.Rankings are based only on facilities in California that report data for that category. Facilities without available data are excluded from the ranking.Click the rank badge to see the full State ranking.Click here to see the full State ranking.
$5.5M 48.2% of net patient revenue Info Payroll as a share of revenue: staff salaries and wage-related benefits divided by net patient revenue. A higher figure means more of each revenue dollar goes to staff pay. Rank #279 / 355Payroll % — State benchmarkedThis home is ranked 279th out of 355 homes in California. Shows payroll as a percentage of revenue versus the California average. Well-run California facilities typically land around 56–67% — the top third Statewide. Below 25% may signal understaffing or heavy agency use — read with Staffing ratings.Rankings are based only on facilities in California that report data for that category. Facilities without available data are excluded from the ranking.Click the rank badge to see the full State ranking.Click here to see the full State ranking.
Other operating costs Info Everything it costs to run the home apart from payroll — food, utilities, supplies, maintenance, contract labor and administration. Calculated as total operating expense minus payroll (staff salaries and wage-related benefits).
$4.8M
Total costs Info The home's total operating expense for the year — all the costs of running it, salaries included (CMS cost report, Worksheet G-3).
$10.2M

What does this home offer?

Building type icon
Building type icon

Building Type: Single-story

Who this home usually serves

TYPE OF STAY

Mostly short-term rehab stays

Most residents typically stay for a few weeks or months before returning home or moving on.

Most new residents arrive under Medicare (71% of admissions), and a typical Medicare stay runs around 3 - 4 months.

Admissions
75 total

Coverage residents most often arrive under.

Medicare 71%
Private pay 14%
Medicaid 15%
Discharges
121 total

Coverage residents most often leave under.

Medicare 88%
Private pay 6%
Medicaid 6%

Places of interest near Bakersfield Post Acute

Address 6.9 miles from city center Info Estimated distance in miles from Bakersfield's city center to Bakersfield Post Acute's address, calculated via Google Maps.

Calculate Travel Distance to Bakersfield Post Acute

Add your location

Address

Compare Nursing Homes around Bakersfield

The information below is reported by the California Department of Social Services and Department of Public Health.

5 facilities compared · CMS & CA Dept. of Health data

San Joaquin Nursing and Rehabilitation Center
NH
HC
MC
Bakersfield (Homaker Park)
99
Facility 99
CA AVG 103
Rank #725 / 1657
93.7%
Facility 93.7%
CA AVG 84.7%
Rank #167 / 1537
+11%
3.70
Facility 3.70
CA AVG 4.22
Rank #245 / 354
-60%-12%
$47.2k
Facility $47.2k
CA AVG $56.5k
Rank #311 / 362
-
87
Facility 87
CA AVG 50.2
Rank #320 / 361
2.6
Facility 2.6
CA AVG 4.6
Rank #39 / 361
289A+
55
Facility 55
CA AVG 57
Rank #1215 / 2092
Bryce Blood
$17.1M
Facility $17.1M
CA AVG $17.0M
Rank #129 / 355
$8.8M
Facility $8.8M
CA AVG $7.0M
Rank #166 / 355
51.3%
Facility 51.3%
CA AVG 45.2%
Rank #263 / 355
56294
Brookdale Riverwalk
NH
AL
IL
MC
Bakersfield (Fairway Oaks)
376
Facility 376
CA AVG 103
Rank #32 / 1657
66.0%
Facility 66.0%
CA AVG 84.7%
Rank #1099 / 1537
-22%
4.35
Facility 4.35
CA AVG 4.22
Rank #122 / 354
+1%+3%
$56.3k
Facility $56.3k
CA AVG $56.5k
Rank #320 / 362
65
Facility 65
CA AVG 81
Rank #1237 / 1401
69
Facility 69
CA AVG 50.2
Rank #296 / 361
2.6
Facility 2.6
CA AVG 4.6
Rank #39 / 361
1248-
32
Facility 32
CA AVG 57
Rank #1693 / 2092
Brookdale Gardens Inc
$15.6M
Facility $15.6M
CA AVG $17.0M
Rank #131 / 355
$8.7M
Facility $8.7M
CA AVG $7.0M
Rank #170 / 355
55.6%
Facility 55.6%
CA AVG 45.2%
Rank #257 / 355
555771
Height Street Skilled Care
NH
HC
NC
PC
RC
Bakersfield
99
Facility 99
CA AVG 103
Rank #725 / 1657
46.3%
Facility 46.3%
CA AVG 84.7%
Rank #1409 / 1537
-45%
4.19
Facility 4.19
CA AVG 4.22
Rank #138 / 354
-24%-1%
$12.7k
Facility $12.7k
CA AVG $56.5k
Rank #253 / 362
-
65
Facility 65
CA AVG 50.2
Rank #286 / 361
2.6
Facility 2.6
CA AVG 4.6
Rank #39 / 361
391A+
73
Facility 73
CA AVG 57
Rank #642 / 2092
Cep Holdings LLC
$12.2M
Facility $12.2M
CA AVG $17.0M
Rank #186 / 355
$9.3M
Facility $9.3M
CA AVG $7.0M
Rank #145 / 355
76.1%
Facility 76.1%
CA AVG 45.2%
Rank #87 / 355
555902
The Orchards Post-Acute
NH
AL
IL
MC
Bakersfield (Homaker Park)
150
Facility 150
CA AVG 103
Rank #343 / 1657
87.4%
Facility 87.4%
CA AVG 84.7%
Rank #398 / 1537
+3%
3.93
Facility 3.93
CA AVG 4.22
Rank #206 / 354
+4%-7%
$9.2k
Facility $9.2k
CA AVG $56.5k
Rank #236 / 362
-
96
Facility 96
CA AVG 50.2
Rank #336 / 361
2.8
Facility 2.8
CA AVG 4.6
Rank #50 / 361
2140-
60
Facility 60
CA AVG 57
Rank #1050 / 2092
-
$18.6M
Facility $18.6M
CA AVG $17.0M
Rank #139 / 355
$9.5M
Facility $9.5M
CA AVG $7.0M
Rank #90 / 355
51%
Facility 51%
CA AVG 45.2%
Rank #113 / 355
555702
Bakersfield Post Acute
NH
Bakersfield
99
Facility 99
CA AVG 103
Rank #725 / 1657
94.5%
Facility 94.5%
CA AVG 84.7%
Rank #211 / 1537
+12%
3.40
Facility 3.40
CA AVG 4.22
Rank #316 / 354
-15%-20%
$25.9k
Facility $25.9k
CA AVG $56.5k
Rank #275 / 362
-
102
Facility 102
CA AVG 50.2
Rank #342 / 361
3.2
Facility 3.2
CA AVG 4.6
Rank #82 / 361
291-
2
Facility 2
CA AVG 57
Rank #2044 / 2092
Cody Rasmussen
$11.4M
Facility $11.4M
CA AVG $17.0M
Rank #223 / 355
$5.5M
Facility $5.5M
CA AVG $7.0M
Rank #272 / 355
48.2%
Facility 48.2%
CA AVG 45.2%
Rank #279 / 355
555260

Financial Assistance for
Nursing Home in California

Bakersfield Post Acute is located in Bakersfield, California.
Here are the financial assistance programs available to residents in California.

Get Financial aid guidance

Multipurpose Senior Services Program

MSSP (Medi-Cal Waiver)

Age 65+
General California resident, Medi-Cal eligible, nursing home risk.
Income Limits (2025) ~$2,829/month 300% FBR, individual
Asset Limits $2,000 (individual), $3,000 (couple).
CA

County-managed; waitlists possible.

Benefits
In-home support (4-6 hours/day) Respite care (14 days/year) Meals (~$6/meal) Transportation (8 trips/month) Care management

In-Home Supportive Services (IHSS)

California IHSS

Age 65+
General California resident, Medicaid-eligible or low-income.
Income Limits ~$1,732/month individual, Medi-Cal threshold
Asset Limits $2,000 individual
CA

Can hire family as caregivers.

Benefits
Personal care (up to 283 hours/month) Homemaker services Respite (varies)

Multipurpose Senior Services Program (MSSP)

CA MSSP

Age 65+
General California resident, Medi-Cal-eligible, nursing home-eligible but community-capable.
Income Limits ~$2,829/month 300% FBR, individual
Asset Limits $2,000 individual
CA

Available in 38 counties; waitlists common.

Benefits
Case management Respite care (up to 10 days/year) Minor home mods (avg. $500) Adult day care (~$50/day)

Property Tax Postponement Program (PTP)

CA PTP

Age 62+
General California resident, own and live in home, 40% equity.
Income Limits (2025) ~$51,500/year household, adjusted annually
Asset Limits Equity-based; no strict asset cap.
CA

Deferred taxes accrue interest (5% as of 2024); repaid upon sale/death.

Benefits
Property tax deferral (avg. $1,000-$3,000/year, varies by county)

Assisted Living Waiver (ALW)

CA ALW

Age 65+ or disabled
General California resident, Medi-Cal-eligible, nursing home-eligible.
Income Limits ~$2,829/month 300% FBR, individual
Asset Limits $2,000 individual
CA

Available in 15 counties (e.g., LA, Sacramento); waitlists common.

Benefits
Personal care in ALFs (5-7 hours/day) Medication management Social services

California CARES Program

CA CARES

Age
General Caregivers of California residents 60+ needing help with 3+ daily activities; no caregiver age limit.
Income Limits No strict limit; cost-sharing above ~$2,500/month threshold.
Asset Limits Not applicable; need-based.
CA

High demand in urban areas; complements IHSS respite.

Benefits
Respite care (up to 10 days/year) Counseling (4-6 sessions/year) Training (2-3 workshops/year) Supplies (~$200/year)

Frequently Asked Questions about Bakersfield Post Acute

Is Bakersfield Post Acute in a walkable area?

Bakersfield Post Acute has a walk score of 2. Car-dependent. Most errands require a car, with limited nearby walkable options.

What is the occupancy rate at Bakersfield Post Acute?

Bakersfield Post Acute's occupancy is 94.5%.

Are there photos of Bakersfield Post Acute?

Yes — there are 9 photos of Bakersfield Post Acute in the photo gallery on this page.

What is the address of Bakersfield Post Acute?

Bakersfield Post Acute is located at 6212 Tudor Way, Bakersfield, CA 93306.

What is the phone number of Bakersfield Post Acute?

(661) 871-3133 will put you in contact with the team at Bakersfield Post Acute.

Is Bakersfield Post Acute Medicare or Medicaid certified?

Yes — Bakersfield Post Acute is a CMS-certified provider of Medicare and Medicaid.

Guides for Better Senior Living

Care Cost Calculator: See Prices in Your Area

Nursing Home Data Explorer

Don’t Wait Too Long: 7 Red Flag Signs Your Parent Needs Assisted Living Now

The True Cost of Assisted Living in 2025 – And How Families Are Paying For It

Understanding Senior Living Costs: Pricing Models, Discounts & Financial Assistance