Bay Bluffs Emmet County Medical Care Facility
Nursing Home, Hospice Care, Memory Care & Nursing Care · Harbor Springs, MI
CMS overall rating Info CMS (the Centers for Medicare & Medicaid Services) is the federal agency that rates nursing home quality. Its Overall Rating runs from 1 to 5 stars, combining health inspections, staffing, and quality measures, with inspections weighted most heavily.

Bay Bluffs Emmet County Medical Care Facility

Nursing Home, Hospice Care, Memory Care & Nursing Care · Harbor Springs, MI
CMS overall rating Info CMS (the Centers for Medicare & Medicaid Services) is the federal agency that rates nursing home quality. Its Overall Rating runs from 1 to 5 stars, combining health inspections, staffing, and quality measures, with inspections weighted most heavily.
Calculator: See prices in your area
Bay Bluffs Emmet County Medical Care Facility accepts Medicare, Medicaid, and private pay.

Overview of Bay Bluffs Emmet County Medical Care Facility

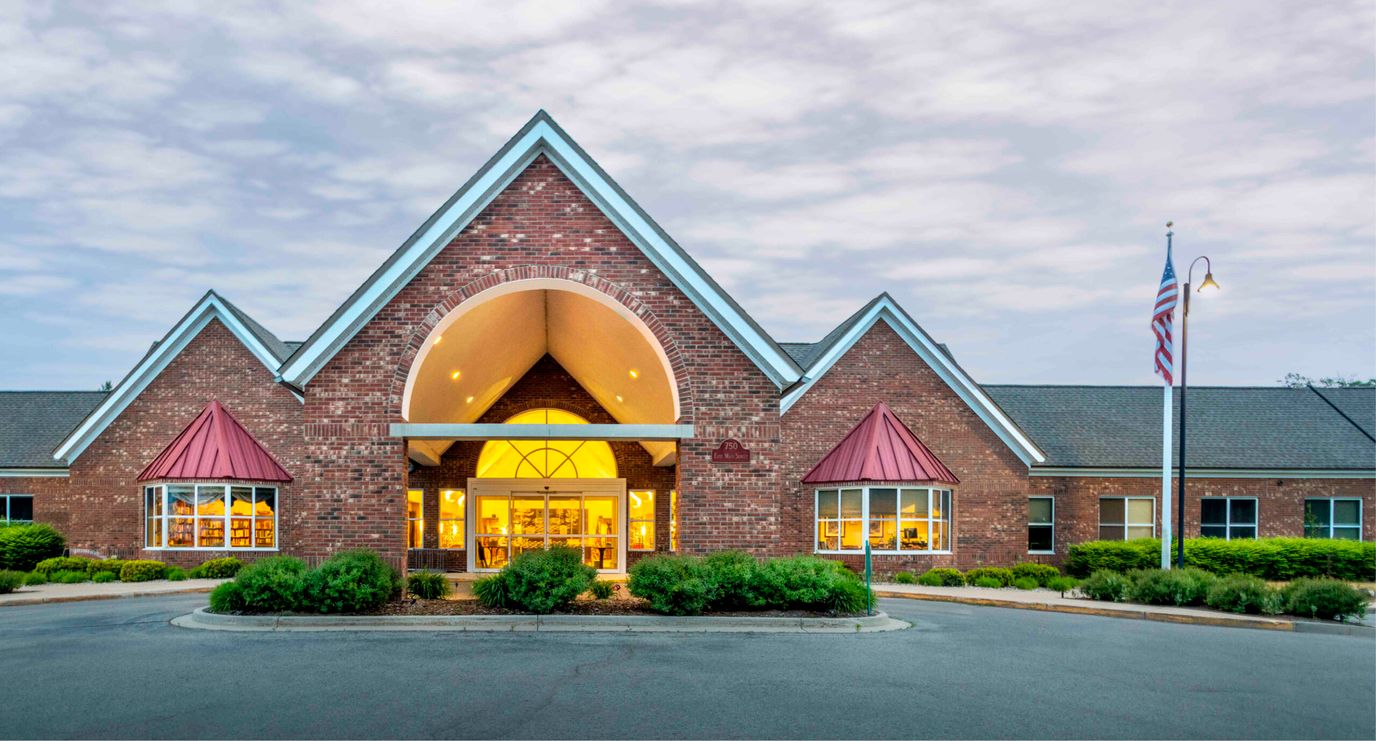
Bay Bluffs Emmet County Medical Care Facility is a nursing home in Harbor Springs, MI, offering long-term care, memory care, and rehabilitation. The community also ensures older adults are well-cared for in a compassionate, home-like setting. Residents also experience a worry-free lifestyle with 24/7 nursing care, nutritious meals, and social services. Along with a multidisciplinary care team, personalized care plans are also provided to help residents recover and return to their routines.

Light exercises, sensory-stimulating activities, and social events help enhance residents’ cognition and maintain holistic wellness. State-of-the-art rehabilitation equipment and spacious gathering areas also ensure residents can relax and focus on their wellness. Residents also experience a laid-back lifestyle, as it is located near the West Wequenstonsing Nature Preserve in Harbor Springs. This nursing home is dedicated to helping older adults thrive in retirement, making it a great choice for senior living in Michigan.

Quality ratings

Measured by Centers for Medicare & Medicaid Services (CMS)

Overall rating Info The Overall CMS Rating combines results from health inspections, staffing levels and quality measures. Health inspections carry the most weight. Staffing and quality scores can increase or decrease the final rating based on performance compared to state and national standards.
▲ 59.4% Above MI avg. ▲ 59.4% Above MI avg.MI average: 3.1Click the badge to see the full State ranking.Click here to see the full State ranking.
Health Inspection Info Based on the results of the facility's three most recent standard inspections and any complaint investigations. CMS reviews the number, scope, and severity of deficiencies, with more recent findings weighted more heavily.
▲ 41.5% Above MI avg. ▲ 41.5% Above MI avg.MI average: 2.8Click the badge to see the full State ranking.Click here to see the full State ranking.
Staffing Info Measures average nursing staff hours per resident per day, including Registered Nurses (RNs) and total nursing staff. Ratings are adjusted based on the level of care residents require and are compared to state and national benchmarks.
▲ 43.0% Above MI avg. ▲ 43.0% Above MI avg.MI average: 3.5Click the badge to see the full State ranking.Click here to see the full State ranking.
Quality Measures Info Based on clinical and physical health indicators reported to CMS, such as hospital readmissions, falls, pressure ulcers, and improvements in mobility. These measures reflect how well residents' health needs are being managed.
▲ 33.0% Above MI avg. ▲ 33.0% Above MI avg.MI average: 3.8Click the badge to see the full State ranking.Click here to see the full State ranking.

Staffing hours breakdown

Info Daily nursing hours per resident by staff type, reported to CMS. Higher is generally better — compare this facility to state and national averages to see where staffing stands.

Hours per resident per day — compared to Michigan state averages

Total nursing care / resident Info This home is ranked 2nd out of 142 homes in Michigan for nurse hours. Total adjusted nursing hours per resident per day, combining RN, LPN, and aide time. CMS adjusts this for case-mix so facilities can be fairly compared.
6h 10m per day
Rank #2 / 142Nurse hours — State benchmarkedThis home is ranked 2nd out of 142 homes in Michigan. Shows adjusted nurse hours per resident per day benchmarked to the Michigan average, with a ranking across 142 Michigan facilities. More hours mean more direct care. The national average is about 3.5 hrs; below 3.0 is a red flag.Rankings are based only on facilities in Michigan that report data for that category. Facilities without available data are excluded from the ranking.Click the rank badge to see the full State ranking.Click here to see the full State ranking.
This facility Michigan avg (4h 18m per day)
vs Michigan avg
+43%

2 of 6 metrics below state avg

Standout metric Registered Nurse (RN) is +110% above state avg
Staff typeHours / Day / Residentvs state avg
Registered Nurse (RN) Info RNs hold the highest nursing license and can assess residents, interpret test results, and direct care plans. More RN hours per day often signals stronger clinical oversight and faster response to health changes. 1h 37m per day ▲ 110% State avg: 46m per day · National avg: 41m per day
LPN / LVN Info Licensed Practical Nurses (LPNs) or Licensed Vocational Nurses (LVNs) deliver routine hands-on care — medication administration, wound dressing, and monitoring vital signs. They work under RN supervision and make up a large share of daily bedside care. 34m per day ▼ 36% State avg: 53m per day · National avg: 52m per day
Nurse Aide Info Certified Nurse Aides (CNAs) provide the most direct day-to-day assistance: bathing, dressing, feeding, and mobility. Nurse aide hours are typically the largest staffing category and directly affect residents' quality of life. 3h 9m per day ▲ 36% State avg: 2h 20m per day · National avg: 2h 20m per day
Weekend Total Nursing Info Combined nursing hours (RN + LPN + Nurse Aide) per resident per day on weekends. Staffing often drops on weekends — this figure reveals whether the facility maintains adequate coverage outside of weekday hours. 4h 27m per day ▲ 27% State avg: 3h 31m per day · National avg: 3h 27m per day
Physical Therapist Info Hours per resident per day provided by licensed Physical Therapists (PTs) or PT Assistants. PT services help residents recover mobility after injury or illness and are especially important for post-acute (short-stay) rehabilitation. 3m per day ▼ 22% State avg: 4m per day · National avg: 4m per day
Weekend RN Info Registered nurse hours specifically on weekends. Facilities sometimes reduce RN presence on Saturdays and Sundays — a low weekend RN figure compared to weekday hours can indicate reduced clinical oversight when most administrative staff are absent. 58m per day ▲ 98% State avg: 29m per day · National avg: 29m per day

Capacity and availability

This home usually has limited availability

Higher occupancy than the Michigan average: 75.8%
Occupancy rate
88.1% Rank #41 / 395Occupancy rate — State benchmarkedThis home is ranked 41st out of 395 homes in Michigan. Shows this facility's occupancy rate versus the Michigan average, with its Statewide rank out of 395. Higher occupancy signals strong local demand and financial stability.Rankings are based only on facilities in Michigan that report data for that category. Facilities without available data are excluded from the ranking.Click the rank badge to see the full State ranking.Click here to see the full State ranking.
Avg. Length of Stay
176 days
Bed community size
120-bed community Rank #74 / 435Bed count — State benchmarkedThis home is ranked 74th out of 435 homes in Michigan. Shows this facility's certified or reported bed count compared to other Michigan facilities. Larger communities may offer more amenities, programs, and on-site services for residents and families.Rankings are based only on facilities in Michigan that report data for that category. Facilities without available data are excluded from the ranking.Click the rank badge to see the full State ranking.Click here to see the full State ranking.
A larger shared setting that may offer more common spaces and organized community services.
Walk Score
Walk Score: 29 / 100 Rank #438 / 703Walk Score — State benchmarkedThis home is ranked 438th out of 703 homes in Michigan. Shows how walkable this facility's neighborhood is compared to the average Walk Score across Michigan facilities. Higher scores benefit residents, families, and staff.Rankings are based only on facilities in Michigan that report data for that category. Facilities without available data are excluded from the ranking.Click the rank badge to see the full State ranking.Click here to see the full State ranking.
Somewhat walkable. A few nearby services may be reachable on foot, but most trips require transportation.

Contact Bay Bluffs Emmet County Medical Care Facility

Staffing Data

Reporting period: October 1 – December 31, 2025 (Q4 2025). Source: CMS Payroll-Based Journal report.

Total staff 108
Employees 107
Contractors 1
Staff to resident ratio 1.77 : 1
0% compared with Michigan average
Michigan average ratio: 1.70 : 1 Michigan average ratio: 1.70 : 1See full Michigan ranking
Avg staff/day 47
Average shift 9.1 hours
15% better than Michigan average
Michigan average: 7.9 hours Michigan average shift: 7.9 hoursSee full Michigan ranking
Total staff hours (quarter) 39,228

Nursing staff breakdown

Q4 2025 · Oct 1 – Dec 31 More info This data comes from the CMS Payroll-Based Journal report covering October 1 – December 31, 2025.
Registered Nurse

Manages medical care and health needs.

RN Staff Info All 19 RN Staff are full-time employees. No contractors work on this role. 19
Average shift length Info Average shift length. Calculated as total hours divided by days worked and average staff per day. 8.9 hours
Licensed Practical Nurse

Assists with medical care and medications.

LPN Staff Info 9 total: 8 full-time employees and 1 contractor. 9
Average shift length Info Average shift length. Calculated as total hours divided by days worked and average staff per day. 10.7 hours
Certified Nursing Assistant

Helps with daily care and mobility.

CNA Staff Info All 53 CNA Staff are full-time employees. No contractors work on this role. 53
Average shift length Info Average shift length. Calculated as total hours divided by days worked and average staff per day. 9.3 hours

Contractor staffing

Q4 2025 · Oct 1 – Dec 31 More info This data comes from the CMS Payroll-Based Journal report covering October 1 – December 31, 2025.

Total hours from contractors

0.5%

212 contractor hours this quarter

Licensed Practical Nurse: 1

Staff by category

Q4 2025 · Oct 1 – Dec 31 More info This data comes from the CMS Payroll-Based Journal report covering October 1 – December 31, 2025.
Certified Nursing Assistant5305320,73292100%9.3
Registered Nurse190197,10392100%8.9
Licensed Practical Nurse8193,73592100%10.7
Clinical Nurse Specialist8083,0606267%8.2
Other Dietary Services Staff3031,24892100%9.8
Mental Health Service Worker2027495964%7.7
Physical Therapy Assistant4046936571%6.7
Administrator1014234751%9
Nurse Practitioner1014005155%7.8
Respiratory Therapy Technician2023535358%5.8
Qualified Social Worker3033505863%5.9
Speech Language Pathologist2022383740%6.2
Dietitian1011441820%8
53 Certified Nursing Assistant
% of Days 100%
19 Registered Nurse
% of Days 100%
9 Licensed Practical Nurse
% of Days 100%
8 Clinical Nurse Specialist
% of Days 67%
3 Other Dietary Services Staff
% of Days 100%
2 Mental Health Service Worker
% of Days 64%
4 Physical Therapy Assistant
% of Days 71%
1 Administrator
% of Days 51%
1 Nurse Practitioner
% of Days 55%
2 Respiratory Therapy Technician
% of Days 58%
3 Qualified Social Worker
% of Days 63%
2 Speech Language Pathologist
% of Days 40%
1 Dietitian
% of Days 20%

Penalties and fines

Federal penalties imposed by CMS for regulatory violations, including civil money penalties (fines) and denials of payment for new Medicare/Medicaid admissions.

Source: CMS Penalties Database

No penalties in the past 3 years

No civil money penalties or payment denials were reported in the last 3 years.

Quality of care over time

These measures show how residents usually do over time at this home, based on health outcomes and preventive care.

High-risk clinical events score Info A composite score based on pressure ulcers, falls with injury, weight loss, walking ability decline, and activities of daily living decline. 12.1
44% worse than Michigan average

Michigan average: 8.4

Functional decline score Info A composite score based on activities of daily living decline, walking ability decline, and incontinence. 22.9
40% worse than Michigan average

Michigan average: 16.3

Long-stay resident measures
Need for Help with Daily Activities Increased Info Percent of long-stay residents whose need for help with daily activities has increased 21.8%
75% worse than Michigan average

Michigan average: 12.5%

Walking Ability Worsened Info Percent of long-stay residents whose ability to move independently worsened 25.1%
64% worse than Michigan average

Michigan average: 15.3%

Low Risk Residents with Bowel/Bladder Incontinence Info Percent of low risk long-stay residents who lose control of their bowels or bladder 21.7%
In line with Michigan average

Michigan average: 21.0%

Falls with Major Injury Info Percent of long-stay residents experiencing one or more falls with major injury 1.8%
42% better than Michigan average

Michigan average: 3.2%

High Risk Residents with Pressure Ulcers Info Percent of long-stay high risk residents with pressure ulcers 6.0%
5% worse than Michigan average

Michigan average: 5.7%

Urinary Tract Infection Info Percent of long-stay residents with a urinary tract infection 0.5%
73% better than Michigan average

Michigan average: 1.7%

Lost Too Much Weight Info Percent of long-stay residents who lose too much weight 5.9%
In line with Michigan average

Michigan average: 5.7%

Depressive Symptoms Info Percent of long-stay residents who have depressive symptoms 0.0%
100% better than Michigan average

Michigan average: 3.9%

Antipsychotic Use Info Percent of long-stay residents who received an antipsychotic medication 9.1%
39% better than Michigan average

Michigan average: 15.0%

Pneumococcal Vaccine Info Percent of long-stay residents assessed and appropriately given the pneumococcal vaccine 100.0%
5% better than Michigan average

Michigan average: 94.9%

Influenza Vaccine Info Percent of long-stay residents assessed and appropriately given the seasonal influenza vaccine 94.7%
In line with Michigan average

Michigan average: 95.0%

Short-stay resident measures
Pneumococcal Vaccine Info Percent of short-stay residents assessed and appropriately given the pneumococcal vaccine 98.9%
20% better than Michigan average

Michigan average: 82.5%

Antipsychotic medication increase Info Percent of short-stay residents who newly received an antipsychotic medication 1.3%
14% better than Michigan average

Michigan average: 1.4%

Influenza Vaccine Info Percent of short-stay residents assessed and appropriately given the seasonal influenza vaccine 47.3%
41% worse than Michigan average

Michigan average: 79.5%

Breakdown by payment type

Medicare

65% of new residents, usually for short-term rehab.

Typical stay 18 days

Private pay

29% of new residents, often for short stays.

Typical stay 2 - 3 months

Medicaid

6% of new residents, often for long-term daily care.

Typical stay 6 - 7 years

Facility Characteristics

Source: CMS Long-Term Care Facility Characteristics (Data as of Jan 2026)

Total residents 61
Medicare
6
9.8% of residents
Medicaid
46
75.4% of residents
Private pay or other
9
14.8% of residents
Programs & Services
Residents Group

Residents meet regularly to discuss policies, care quality, and activities

Active Resident Council

Organized group of residents that meets regularly to discuss facility policies, quality of life, and activities.

Finances and operations

Based on CMS SNF Cost Report for fiscal year ending in 12/2023.

Government
Operated by federal authorities.
Net patient revenue Info Net patient revenue — what the home actually collects for resident care, after contractual allowances, bad debt and discounts are subtracted from its gross charges (CMS cost report, Worksheet G-3). It covers resident care only; money the home earns from other sources is shown separately as "Other income."
$9.2M
Net patient income Info Net patient income: net patient revenue minus the home's total operating expenses. A positive figure means it earns more from resident care than it spends to deliver it; a negative figure means the opposite. It excludes non-operating "other income."
-$3.7M
Government Operated by federal authorities.
Net patient revenue Info Net patient revenue — what the home actually collects for resident care, after contractual allowances, bad debt and discounts are subtracted from its gross charges (CMS cost report, Worksheet G-3). It covers resident care only; money the home earns from other sources is shown separately as "Other income."
$9.2M Rank #113 / 143Revenue — State benchmarkedThis home is ranked 113th out of 143 homes in Michigan. Shows this facility's annual revenue compared to the Michigan average. Higher revenue generally means more resources for staffing and capital — read alongside Payroll %.Rankings are based only on facilities in Michigan that report data for that category. Facilities without available data are excluded from the ranking.Click the rank badge to see the full State ranking.Click here to see the full State ranking.
Net patient income Info Net patient income: net patient revenue minus the home's total operating expenses. A positive figure means it earns more from resident care than it spends to deliver it; a negative figure means the opposite. It excludes non-operating "other income."
-$3.7M
Other income Info Money the home earns outside of resident care — such as investments, grants, rentals and other non-operating sources (CMS cost report, Worksheet G-3). It is tracked separately from net patient revenue: it is not part of that figure, and it is not included in net patient income.
$1.7M
Payroll costs Info Staff salaries plus wage-related costs — benefits such as payroll taxes, health insurance and retirement — from the home's own accounting records (CMS cost report, Worksheet A). Contract or agency labor is counted separately, under other operating costs. Rank #43 / 143Payroll — State benchmarkedThis home is ranked 43rd out of 143 homes in Michigan. Shows total annual staff payroll benchmarked to the Michigan average. Higher payroll investment relative to peers often signals better staffing and less reliance on cheaper contract labor.Rankings are based only on facilities in Michigan that report data for that category. Facilities without available data are excluded from the ranking.Click the rank badge to see the full State ranking.Click here to see the full State ranking.
$9.4M 102.2% of net patient revenue Info Payroll as a share of revenue: staff salaries and wage-related benefits divided by net patient revenue. A higher figure means more of each revenue dollar goes to staff pay. Rank #2 / 143Payroll % — State benchmarkedThis home is ranked 2nd out of 143 homes in Michigan. Shows payroll as a percentage of revenue versus the Michigan average. Well-run Michigan facilities typically land around 49–59% — the top third Statewide. Below 25% may signal understaffing or heavy agency use — read with Staffing ratings.Rankings are based only on facilities in Michigan that report data for that category. Facilities without available data are excluded from the ranking.Click the rank badge to see the full State ranking.Click here to see the full State ranking.
Other operating costs Info Everything it costs to run the home apart from payroll — food, utilities, supplies, maintenance, contract labor and administration. Calculated as total operating expense minus payroll (staff salaries and wage-related benefits).
$3.5M
Total costs Info The home's total operating expense for the year — all the costs of running it, salaries included (CMS cost report, Worksheet G-3).
$13.0M

What does this home offer?

Building type icon
Building type icon

Building Type: Single-story

Rehabilitative support icon

Rehabilitative Support

On-site medical care and health services icon

On-site Medical Care and Health Services

Who this home usually serves

TYPE OF STAY

Mostly short-term rehab stays

Most residents typically stay for a few weeks or months before returning home or moving on.

Most new residents arrive under Medicare (65% of admissions), and a typical Medicare stay runs around 18 days.

Admissions
128 total

Coverage residents most often arrive under.

Medicare 65%
Private pay 29%
Medicaid 6%
Discharges
128 total

Coverage residents most often leave under.

Medicare 49%
Private pay 34%
Medicaid 17%

Places of interest near Bay Bluffs Emmet County Medical Care Facility

Address 1.2 miles from city center Info Estimated distance in miles from Harbor Springs's city center to Bay Bluffs Emmet County Medical Care Facility's address, calculated via Google Maps.

Calculate Travel Distance to Bay Bluffs Emmet County Medical Care Facility

Add your location

Address

Compare Nursing Homes around Petoskey

The information below is reported by the Michigan Department of Licensing and Regulatory Affairs (LARA).

2 facilities compared · CMS & MI Dept. of Health data

Bay Bluffs Emmet County Medical Care Facility
NH
HC
MC
NC
Harbor Springs
120
Facility 120
MI AVG 75
Rank #74 / 435
88.1%
Facility 88.1%
MI AVG 75.8%
Rank #41 / 395
+16%
6.16
Facility 6.16
MI AVG 4.30
Rank #2 / 142
+72%+43%
$0
Facility $0
MI AVG $87.6k
Rank #1 / 145
12
Facility 12
MI AVG 33.5
Rank #19 / 144
3.0
Facility 3.0
MI AVG 5.2
Rank #16 / 144
-71-
29
Facility 29
MI AVG 39
Rank #438 / 703
County Of Emmet
$9.2M
Facility $9.2M
MI AVG $15.8M
Rank #113 / 143
$9.4M
Facility $9.4M
MI AVG $5.6M
Rank #43 / 143
102.2%
Facility 102.2%
MI AVG 39%
Rank #2 / 143
235033
Villa at the Bay
NH
AL
IL
MC
Petoskey (Spring Street)
110
Facility 110
MI AVG 75
Rank #99 / 435
65.0%
Facility 65.0%
MI AVG 75.8%
Rank #146 / 395
-14%
3.61
Facility 3.61
MI AVG 4.30
Rank #117 / 142
+15%-16%
$241.5k
Facility $241.5k
MI AVG $87.6k
Rank #143 / 145
59
Facility 59
MI AVG 33.5
Rank #122 / 144
7.4
Facility 7.4
MI AVG 5.2
Rank #116 / 144
475-
48
Facility 48
MI AVG 39
Rank #232 / 703
-
$8.5M
Facility $8.5M
MI AVG $15.8M
Rank #110 / 143
$3.6M
Facility $3.6M
MI AVG $5.6M
Rank #132 / 143
42.4%
Facility 42.4%
MI AVG 39%
Rank #131 / 143
235429

Financial Assistance for
Nursing Home in Michigan

Bay Bluffs Emmet County Medical Care Facility is located in Harbor Springs, Michigan.
Here are the financial assistance programs available to residents in Michigan.

Get Financial aid guidance

MI Choice Waiver

Michigan Medicaid MI Choice Waiver

Age 65+ or disabled
General Michigan resident, Medicaid- eligible, nursing home-level care need.
Income Limits (2025) ~$2,829/month 300% FBR, individual
Asset Limits $2,000 (individual), $3,000 (couple).
MI

Delivered through regional waiver agents; waitlists possible.

Benefits
Personal care (5-7 hours/day) Respite care (240 hours/year) Home modifications ($1,500 avg.) Adult day care ($65/day)

Home Help Program

Michigan Home Help

Age 65+ or disabled
General Michigan resident, Medicaid- eligible or low-income.
Income Limits ~$1,732/month individual, Medicaid threshold
Asset Limits $2,000 individual
MI

Can hire family caregivers; less intensive than waiver.

Benefits
Personal care (up to 60 hours/month) Homemaker services Respite (varies)

Program of All-Inclusive Care for the Elderly (PACE)

Michigan PACE

Age 55+
General Michigan resident, nursing home-level care need, safe with PACE support.
Income Limits (2025) ~$2,829/month (Medicaid-eligible); private pay option available.
Asset Limits $2,000 (individual), $3,000 (couple).
MI

16 PACE centers (e.g., Ingham, Wayne counties); expanding slowly.

Benefits
Personal care (5-7 hours/day) Medical care Meals Transportation Therapy Respite

Medicare Savings Program (MSP)

Michigan Medicare Savings Program

Age 65+ or disabled
General Michigan resident, Medicare Part A/B.
Income Limits (2025) ~$2,510/month (QMB), ~$3,380/month (SLMB), ~$3,598/month (QI)—individual.
Asset Limits $9,430 (individual), $14,130 (couple).
MI

Three tiers; no waitlist; includes Extra Help for Part D.

Benefits
Covers Part B premiums ($174.70/month) Deductibles ($240/year) Copays (~20%)

National Family Caregiver Support Program (NFCSP) Respite

Michigan NFCSP Respite Care

Age
General Caregivers of 60+ needing care or 55+ caregivers of others; Michigan resident; functional needs (2+ ADLs).
Income Limits (2025) Prioritizes ~$24,980/year (individual); no strict cap.
Asset Limits Not assessed; need-based.
MI

16 AAAs; prioritizes low-income, rural caregivers.

Benefits
Respite (4-6 hours/week or 5 days/year) Adult day care ($60/day) Caregiver training

VA Aid and Attendance (A&A) and Housebound Benefits

Michigan VA Aid and Attendance/Housebound

Age 65+ or disabled veteran/spouse
General Michigan resident, wartime service, need for ADL help (A&A) or homebound.
Income Limits (2025) Net income < ~$1,984/month (veteran with dependent, A&A); pension offsets income.
Asset Limits ~$155,356 net worth limit
MI

High veteran demand in urban/rural areas.

Benefits
Cash (~$1,433-$2,642/month veteran, ~$951-$1,318 spouse) for care costs

Frequently Asked Questions about Bay Bluffs Emmet County Medical Care Facility

Is Bay Bluffs Emmet County Medical Care Facility in a walkable area?

Bay Bluffs Emmet County Medical Care Facility has a walk score of 29. Somewhat walkable. A few nearby services may be reachable on foot, but most trips require transportation.

What is the occupancy rate at Bay Bluffs Emmet County Medical Care Facility?

Bay Bluffs Emmet County Medical Care Facility's occupancy is 88.1%.

Is Bay Bluffs Emmet County Medical Care Facility a government-operated facility?

Bay Bluffs Emmet County Medical Care Facility is a government-operated nursing facility.

Are there photos of Bay Bluffs Emmet County Medical Care Facility?

Yes — there is 1 photo of Bay Bluffs Emmet County Medical Care Facility in the photo gallery on this page.

What is the address of Bay Bluffs Emmet County Medical Care Facility?

Bay Bluffs Emmet County Medical Care Facility is located at 750 E Main St, Harbor Springs, MI 49740.

What is the phone number of Bay Bluffs Emmet County Medical Care Facility?

(231) 526-2161 will put you in contact with the team at Bay Bluffs Emmet County Medical Care Facility.

Is Bay Bluffs Emmet County Medical Care Facility Medicare or Medicaid certified?

Yes — Bay Bluffs Emmet County Medical Care Facility is a CMS-certified provider of Medicare and Medicaid.

Guides for Better Senior Living

Care Cost Calculator: See Prices in Your Area

Nursing Home Data Explorer

Don’t Wait Too Long: 7 Red Flag Signs Your Parent Needs Assisted Living Now

The True Cost of Assisted Living in 2025 – And How Families Are Paying For It

Understanding Senior Living Costs: Pricing Models, Discounts & Financial Assistance