Explore Open Rooms

1 Contact details
2 What type of senior care service are you looking for?
3 What budget do you have in mind for senior care?
4 How soon do you need to find care?
5 Additional details

Thank you for your interest!

Our team will be in touch shortly to help with next steps.

Nursing Home in Petoskey

CMS overall rating Info The Overall CMS Rating combines results from health inspections, staffing levels and quality measures. Health inspections carry the most weight. Staffing and quality scores can increase or decrease the final rating based on performance compared to state and national standards.

Villa at the Bay

1500 Spring St, Petoskey, MI 49770 View map
Overview of Villa at the Bay

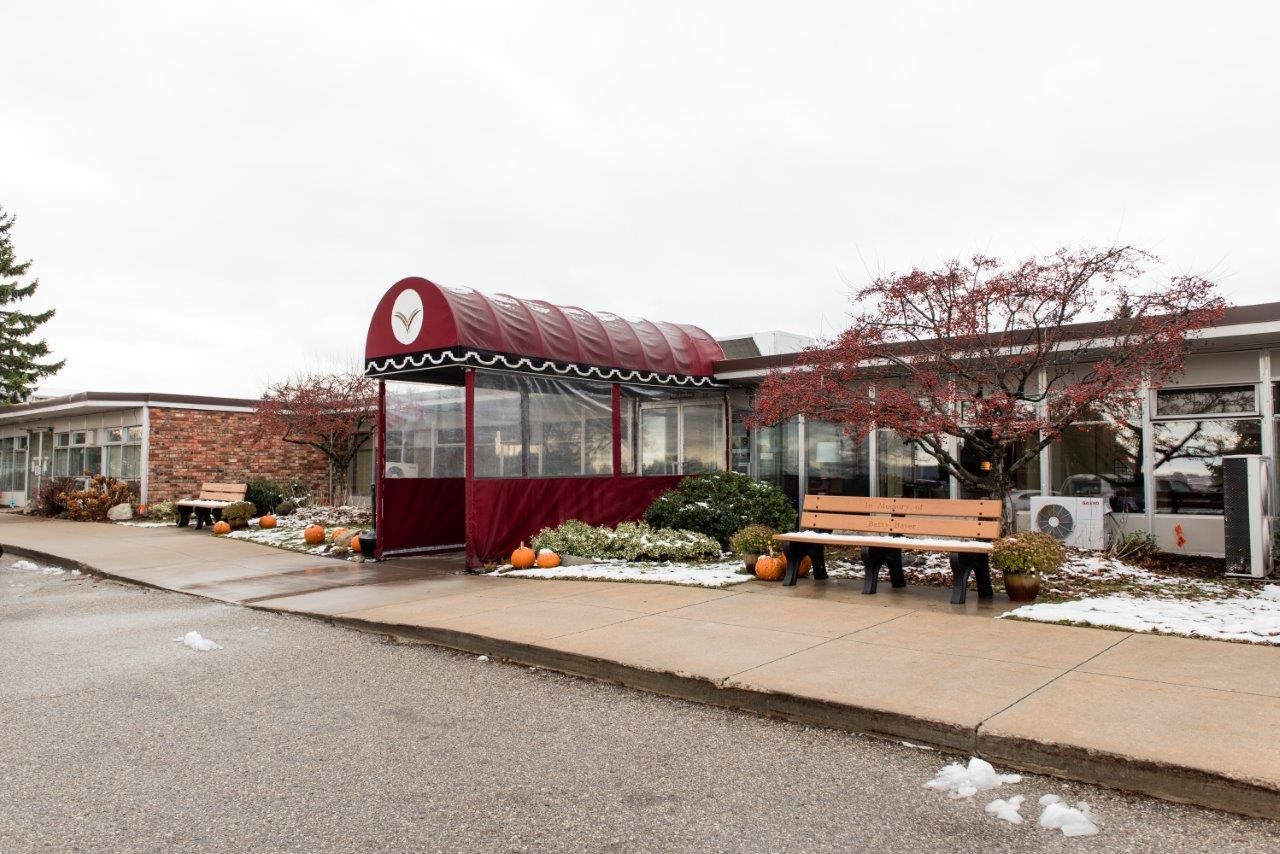
Situated on the serene grounds of Spring Street, Petoskey, MI, is the astounding senior living community of Villa at the Bay, offering long-term care and post-acute rehabilitation. With its commitment to improving seniors’ quality of life, the community provides evidence-based clinical programs with a team of compassionate and licensed professionals. Comfort and convenience are not a problem with cozy and specially designed amenities and dedicated care around the clock.

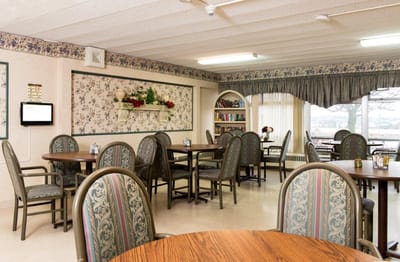
A jam-packed calendar of enriching activities and engaging events accompanies residents as they try out new things and gain meaningful experiences. Meals are important to keep residents’ well-being, hence, the community serves delectable and healthy meals that accommodate their dietary needs and preferences. Villa at the Bay is a safe place for seniors to experience retirement without worries.

(831) 655-1962

Quality ratings

Measured by Centers for Medicare & Medicaid Services (CMS)

Overall rating Info The Overall CMS Rating combines results from health inspections, staffing levels and quality measures. Health inspections carry the most weight. Staffing and quality scores can increase or decrease the final rating based on performance compared to state and national standards.
1/5
Michigan average: 3.1/5
Health Inspection Info Based on the results of the facility's three most recent standard inspections and any complaint investigations. CMS reviews the number, scope, and severity of deficiencies, with more recent findings weighted more heavily.
1/5
Michigan average: 2.8/5
Staffing Info Measures average nursing staff hours per resident per day, including Registered Nurses (RNs) and total nursing staff. Ratings are adjusted based on the level of care residents require and are compared to state and national benchmarks.
2/5
Michigan average: 3.5/5
Quality Measures Info Based on clinical and physical health indicators reported to CMS, such as hospital readmissions, falls, pressure ulcers, and improvements in mobility. These measures reflect how well residents' health needs are being managed.
4/5
Michigan average: 3.8/5

Nursing care per resident

Info This shows how many total hours of nursing staff time are available per resident each day. Higher numbers usually mean more staff support.
3h 37m per day

This home provides 16% less nursing time per resident than the Michigan average.

Michigan average: 4h 18m per day

Staffing hours breakdown

Info Hours of care per resident per day, broken down by staff type. Data from CMS Medicare.
Staff type Facility State avg National avg
Registered Nurse (RN) Info Registered nurse hours per resident per day. 29m per day 46m per day 41m per day
Nurse Aide Info Nurse aide hours per resident per day. 2h 2m per day 2h 23m per day 2h 21m per day
Total Nursing (Weekend) Info Total number of nurse staff hours per resident per day on weekends. 3h 6m per day 3h 31m per day 3h 26m per day
Physical Therapist Info Physical therapist staff hours per resident per day. 3m per day 4m per day 4m per day
RN (Weekend) Info Registered nurse hours per resident per day on weekends. 17m per day 29m per day 29m per day

Capacity and availability

Medium-capacity home

Offers a balance of services and community atmosphere.

Total beds 110

This home usually has availability

Lower occupancy suggests more openings may be available.

Lower demand than the Michigan average
Occupancy rate 65%
Residents per day (avg) 78
Occupancy rate
65%
Residents per day (avg)
78

Who this home usually serves

TYPE OF STAY

Mix of rehab and long-term care

This home supports both short-term rehab and long-term care, with residents staying for a wide range of durations.

Breakdown by payment type

Medicare

38% of new residents, usually for short-term rehab.

Typical stay 23 days

Private pay

56% of new residents, often for short stays.

Typical stay 2 - 3 months

Medicaid

6% of new residents, often for long-term daily care.

Typical stay 4 - 5 years

Finances and operations

Privately-owned community
Operated by a business corporation.
Home revenue
$11.6M
Operating loss
-$1.7M
Privately-owned community Operated by a business corporation.
Home revenue
$11,599,978.00
Operating loss
$-1,707,335.00
Payroll costs Info The portion of the home's budget spent on staff, including nurses, caregivers, and other employees who support care and operations.
$3.1M
27% of revenue
Other operating costs Info All remaining costs needed to run the home, such as food, utilities, building maintenance, supplies and administrative expenses.
$10.2M
Total costs $13.3M

What does this home offer?

Accepts Medicaid icon

Accept Medicaid: Yes, Accept

Total residents icon

Total Residents: 110 Residents

Housing options icon

Housing Options: Private / Semi-Private Rooms

Building type icon
Building type icon

Building Type: Single-story

Fitness and recreation icon

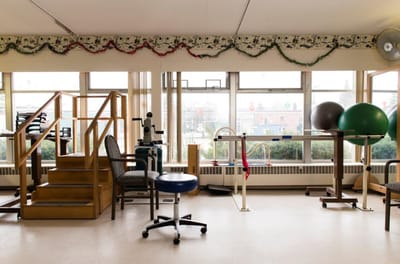
Fitness and Recreation

Transportation services icon

Transportation Services

Types of Care at Villa at the Bay

Nursing Home
Contact Villa at the Bay

Health Inspection History

Inspections
Total health inspections 8

Michigan average 6.5


Last Health inspection on May 2025

Total health citations 59

Michigan average 33.5

Citations per inspection
7.38

Michigan average 5.18


Health citations are formal notices following inspections when they fail to comply with safety and care standards.

43 of 59 citations resulted from standard inspections; 12 of 59 resulted from complaint investigations; and 4 of 59 came from combined inspections (standard and complaint).

Breakdown of citation severity (last 3 years)
Critical Health citations More info 0
100% better than Michigan average

Michigan average: 0.3


Serious Health citations More info 4
111% worse than Michigan average

Michigan average: 1.9

0 critical citations More info Michigan average: 0.3

4 serious citations More info Michigan average: 1.9

55 moderate citations More info Michigan average: 30.8

0 minor citations More info Michigan average: 0.5
Citations history (last 3 years)
Environmental moderate citation Info Issues related to building safety, cleanliness, maintenance, and overall living conditions. May 22, 2025
Corrected

Environmental moderate citation Info Issues related to building safety, cleanliness, maintenance, and overall living conditions. May 22, 2025
Corrected

Infection Control moderate citation Info Issues related to preventing and controlling infections, including hygiene practices and safety protocols. May 22, 2025
Corrected

Nutrition moderate citation Info Issues related to food quality, meal service, and resident's nutritional needs. May 22, 2025
Corrected

Compare Nursing Homes around Petoskey The information below is reported by the Michigan Department of Licensing and Regulatory Affairs (LARA).

2 facilities compared · CMS & MI Dept. of Health data · Updated Apr 2026

Filter by care type
Villa at the Bay
AL

Assisted Living A licensed, long-term care setting for seniors or individuals with disabilities who need help with daily activities — like bathing, dressing, and medication management — but not 24-hour skilled nursing. Offers housing, meals, and around-the-clock support while aiming to maximize resident independence.

IL

Independent Living Lifestyle-focused communities for older adults offering dining, activities, and transportation with minimal personal care. Best for active, independent seniors who want community without medical support.

MC

Memory Care Secured, specialized care for people living with Alzheimer's or dementia. Staff trained in cognitive impairment, with higher staff-to-resident ratios and an environment designed to reduce confusion and wandering risk.

NH

Nursing Home Licensed facility providing 24/7 skilled nursing care for residents with complex, ongoing medical needs. Staffed by RNs, LPNs, and CNAs. Inspected and star-rated annually by CMS. Accepts Medicare (short-term rehab) and Medicaid (long-term care).

Petoskey
110
65.0%
-14%
3.61
+8%
-16%
1
59
7.4
4
78
48
$11.1M
$3.1M
28.1%
235429
Private / Semi-Private Rooms
Bay Bluffs Emmet County Medical Care Facility
-
MC

Memory Care Secured, specialized care for people living with Alzheimer's or dementia. Staff trained in cognitive impairment, with higher staff-to-resident ratios and an environment designed to reduce confusion and wandering risk.

NH

Nursing Home Licensed facility providing 24/7 skilled nursing care for residents with complex, ongoing medical needs. Staffed by RNs, LPNs, and CNAs. Inspected and star-rated annually by CMS. Accepts Medicare (short-term rehab) and Medicaid (long-term care).

Harbor Springs
-
-
-
-
-
-
-
-
-
0
0
0.0
0
-
-
-
-
-
-
Private / Semi-Private Rooms

Places of interest near Villa at the Bay

Address 1.6 miles from city center

Address 1500 Spring St, Petoskey, MI 49770

Calculate Travel Distance to Villa at the Bay

Add your location

Address

Staffing Data (Q2 2025)

This data corresponds to Q2 2025 and is based on CMS Payroll-Based Journal.

Total staff 102
Employees 67
Contractors 35
Staff to resident ratio 1.24:1
29% worse than Michigan average

Michigan average ratio: 1.75:1

Avg staff/day 35
Average shift 8.7 hours
10% better than Michigan average

Michigan average: 7.9 hours

Total staff hours (quarter) 27,792
Nursing staff breakdown
Registered Nurse

Manages medical care and health needs.

Total count 11
Average shift length Info Average shift length. Calculated as total hours divided by days worked and average staff per day. 9.8 hours

No contractors work on this role.

Licensed Practical Nurse

Assists with medical care and medications.

Total count 21
Average shift length Info Average shift length. Calculated as total hours divided by days worked and average staff per day. 9.9 hours

This role is partially covered by contractors.

Certified Nursing Assistant

Helps with daily care and mobility.

Total count 41
Average shift length Info Average shift length. Calculated as total hours divided by days worked and average staff per day. 9 hours

This role is partially covered by contractors.

Contractor staffing

Total hours from contractors

30.6%

8,500 contractor hours this quarter

Licensed Practical Nurse: 13 Certified Nursing Assistant: 10 Physical Therapy Assistant: 4 Qualified Social Worker: 3 Physical Therapy Aide: 2 Respiratory Therapy Technician: 2 Speech Language Pathologist: 1
Staff by category
Certified Nursing Assistant 31 10 41 13,844 91 100% 9
Licensed Practical Nurse 8 13 21 5,727 91 100% 9.9
Registered Nurse 11 0 11 3,145 91 100% 9.8
Other Dietary Services Staff 9 0 9 1,499 81 89% 6.9
Physical Therapy Aide 0 2 2 873 66 73% 7.3
Clinical Nurse Specialist 3 0 3 706 64 70% 7.9
Administrator 1 0 1 512 64 70% 8
Occupational Therapy Aide 1 0 1 496 62 68% 8
Nurse Practitioner 2 0 2 432 54 59% 8
Respiratory Therapy Technician 0 2 2 318 60 66% 5.3
Physical Therapy Assistant 0 4 4 109 44 48% 2.2
Qualified Social Worker 0 3 3 70 29 32% 2.4
Dental Services Staff 1 0 1 57 8 9% 7.1
Speech Language Pathologist 0 1 1 4 1 1% 3.9
41 Certified Nursing Assistant
% of Days 100%
21 Licensed Practical Nurse
% of Days 100%
11 Registered Nurse
% of Days 100%
9 Other Dietary Services Staff
% of Days 89%
2 Physical Therapy Aide
% of Days 73%
3 Clinical Nurse Specialist
% of Days 70%
1 Administrator
% of Days 70%
1 Occupational Therapy Aide
% of Days 68%
2 Nurse Practitioner
% of Days 59%
2 Respiratory Therapy Technician
% of Days 66%
4 Physical Therapy Assistant
% of Days 48%
3 Qualified Social Worker
% of Days 32%
1 Dental Services Staff
% of Days 9%
1 Speech Language Pathologist
% of Days 1%

Facility Characteristics

Source: CMS Long-Term Care Facility Characteristics (Data as of Jan 2026)

Total census
82 residents
Residents by payment source
Medicare
14 residents (17.1%)
Medicaid
48 residents (58.5%)
Private pay or other
20 residents (24.4%)
Programs & Services
Residents' Group

Residents meet regularly to discuss policies, care quality, and activities

Active Resident Council

Organized group of residents that meets regularly to discuss facility policies, quality of life, and activities.

Quality of care over time

These measures show how residents usually do over time at this home, based on health outcomes and preventive care.

High-risk clinical events score Info A composite score based on pressure ulcers, falls with injury, weight loss, walking ability decline, and activities of daily living decline. 8.7
In line with Michigan average

Michigan average: 8.4

Functional decline score Info A composite score based on activities of daily living decline, walking ability decline, and incontinence. 15.9
In line with Michigan average

Michigan average: 16.3

Long-stay resident measures
Significantly above average Michigan avg: 4.2 Info CMS star rating based on long-stay quality measure performance. 5 stars = significantly above average, 1 star = significantly below average.
Need for Help with Daily Activities Increased Info Percent of long-stay residents whose need for help with daily activities has increased 9.6%
23% better than Michigan average

Michigan average: 12.5%

Walking Ability Worsened Info Percent of long-stay residents whose ability to move independently worsened 12.9%
16% better than Michigan average

Michigan average: 15.3%

Low Risk Residents with Bowel/Bladder Incontinence Info Percent of low risk long-stay residents who lose control of their bowels or bladder 25.3%
20% worse than Michigan average

Michigan average: 21.0%

Falls with Major Injury Info Percent of long-stay residents experiencing one or more falls with major injury 5.5%
74% worse than Michigan average

Michigan average: 3.2%

High Risk Residents with Pressure Ulcers Info Percent of long-stay high risk residents with pressure ulcers 8.8%
53% worse than Michigan average

Michigan average: 5.7%

Urinary Tract Infection Info Percent of long-stay residents with a urinary tract infection 0.8%
53% better than Michigan average

Michigan average: 1.7%

Lost Too Much Weight Info Percent of long-stay residents who lose too much weight 6.9%
22% worse than Michigan average

Michigan average: 5.7%

Depressive Symptoms Info Percent of long-stay residents who have depressive symptoms 22.8%
490% worse than Michigan average

Michigan average: 3.9%

Antipsychotic Use Info Percent of long-stay residents who received an antipsychotic medication 16.6%
11% worse than Michigan average

Michigan average: 15.0%

Pneumococcal Vaccine Info Percent of long-stay residents assessed and appropriately given the pneumococcal vaccine 96.9%
In line with Michigan average

Michigan average: 94.9%

Influenza Vaccine Info Percent of long-stay residents assessed and appropriately given the seasonal influenza vaccine 98.6%
In line with Michigan average

Michigan average: 95.0%

Hospitalizations per 1,000 days Info Number of hospitalizations per 1,000 long-stay resident days. 1.28
26% better than Michigan average

Michigan average: 1.74

ED visits per 1,000 days Info Number of outpatient emergency department visits per 1,000 long-stay resident days. 0.95
38% better than Michigan average

Michigan average: 1.54

Short-stay resident measures
Above average Michigan avg: 3.1 Info CMS star rating based on short-stay quality measure performance. 5 stars = much above average, 1 star = much below average.
Pneumococcal Vaccine Info Percent of short-stay residents assessed and appropriately given the pneumococcal vaccine 97.1%
18% better than Michigan average

Michigan average: 82.5%

Antipsychotic medication increase Info Percent of short-stay residents who newly received an antipsychotic medication 0.0%
100% better than Michigan average

Michigan average: 1.4%

Influenza Vaccine Info Percent of short-stay residents assessed and appropriately given the seasonal influenza vaccine 81.4%
In line with Michigan average

Michigan average: 79.5%

Re-hospitalized after SNF stay Info Percentage of short-stay residents who were re-hospitalized after their nursing home admission. 17.9%
26% better than Michigan average

Michigan average: 24.2%

Emergency department visits Info Percentage of short-stay residents who had an outpatient emergency department visit. 11.7%
In line with Michigan average

Michigan average: 11.5%

Falls with major injury Info Percentage of SNF residents who experience falls with major injury during their stay. 0.0%
100% better than Michigan average

Michigan average: 0.8%

Ability to care for self at discharge Info Percentage of residents at or above expected ability to care for themselves at discharge. 48.7%
9% worse than Michigan average

Michigan average: 53.7%

Successful return to home or community Info Rate of successful return to home or community from a skilled nursing facility. 44.1%
13% worse than Michigan average

Michigan average: 50.6%

Penalties and fines

Federal penalties imposed by CMS for regulatory violations, including civil money penalties (fines) and denials of payment for new Medicare/Medicaid admissions.

Source: CMS Penalties Database (Data as of Jan 2026)

Total fines amount $170K
123% higher than Michigan average

Michigan average: $76K

Number of fines 1
51% fewer fines than Michigan average

Michigan average: 2.0

Payment Denials Info Serious action where Medicare and/or Medicaid temporarily stops payments for new residents until issues are fixed. 3
256% more payment denials than Michigan average

Michigan average: 0.8

Fines amount comparison
This facility $170K
Michigan average $76K
Penalty History

Penalties are imposed by CMS for violations of federal nursing home regulations.

Civil Money Penalty Info Fines imposed for noncompliance, which can be assessed per day or per instance of violation. May 22, 2025
$170K
Payment Denial Info Serious action where Medicare and/or Medicaid temporarily stops payments for new residents until issues are fixed. May 22, 2025
29 days
Payment Denial Info Serious action where Medicare and/or Medicaid temporarily stops payments for new residents until issues are fixed. Feb 20, 2025
18 days
Payment Denial Info Serious action where Medicare and/or Medicaid temporarily stops payments for new residents until issues are fixed. Jul 17, 2024
26 days

Last updated: Jan 2026

Guides for Better Senior Living

Care Cost Calculator: See Prices in Your Area

Nursing Home Data Explorer

Don’t Wait Too Long: 7 Red Flag Signs Your Parent Needs Assisted Living Now

The True Cost of Assisted Living in 2025 – And How Families Are Paying For It

Understanding Senior Living Costs: Pricing Models, Discounts & Financial Assistance

Financial Aid for Michigan Seniors

Get financial aid guidance

MI Choice Waiver

Michigan Medicaid MI Choice Waiver

Age 65+ or disabled, Michigan resident, Medicaid- eligible, nursing home-level care need.

~$2,829/month (300% FBR, individual).

$2,000 (individual), $3,000 (couple).

Delivered through regional waiver agents; waitlists possible.

Home Help Program

Michigan Home Help

Age 65+ or disabled, Michigan resident, Medicaid- eligible or low-income.

~$1,732/month (individual, Medicaid threshold).

$2,000 (individual).

Can hire family caregivers; less intensive than waiver.

Program of All-Inclusive Care for the Elderly (PACE)

Michigan PACE

Age 55+, Michigan resident, nursing home-level care need, safe with PACE support.

~$2,829/month (Medicaid-eligible); private pay option available.

$2,000 (individual), $3,000 (couple).

16 PACE centers (e.g., Ingham, Wayne counties); expanding slowly.

Medicare Savings Program (MSP)

Michigan Medicare Savings Program

Age 65+ or disabled, Michigan resident, Medicare Part A/B.

~$2,510/month (QMB), ~$3,380/month (SLMB), ~$3,598/month (QI)—individual.

$9,430 (individual), $14,130 (couple).

Three tiers; no waitlist; includes Extra Help for Part D.

National Family Caregiver Support Program (NFCSP) Respite

Michigan NFCSP Respite Care

Caregivers of 60+ needing care or 55+ caregivers of others; Michigan resident; functional needs (2+ ADLs).

Prioritizes ~$24,980/year (individual); no strict cap.

Not assessed; need-based.

16 AAAs; prioritizes low-income, rural caregivers.

Senior Community Service Employment Program (SCSEP)

Michigan SCSEP

Age 55+, unemployed, low-income, Michigan resident.

~$1,983/month (125% FPL).

Not specified; income-focused.

Priority for veterans, rural residents; Operation ABLE partnership.

VA Aid and Attendance (A&A) and Housebound Benefits

Michigan VA Aid and Attendance/Housebound

Age 65+ or disabled veteran/spouse, Michigan resident, wartime service, need for ADL help (A&A) or homebound.

Net income < ~$1,984/month (veteran with dependent, A&A); pension offsets income.

~$155,356 (net worth limit).

High veteran demand in urban/rural areas.

Tour Icon
Planning a tour? Check our touring checklist.
Chat Icon
Thinking of living here? We can help you speak to a current resident