Bayleigh Chase

Assisted Living in Easton

CMS overall rating Info The Overall CMS Rating is scored from 1 to 5 stars and combines results from health inspections, staffing levels, and quality measures. Health inspections carry the most weight. Staffing and quality scores can increase or decrease the final rating based on performance compared to state and national standards.
Calculator: See prices in your area
Bayleigh Chase accepts Medicare, Medicaid, and private pay.

Overview of Bayleigh Chase

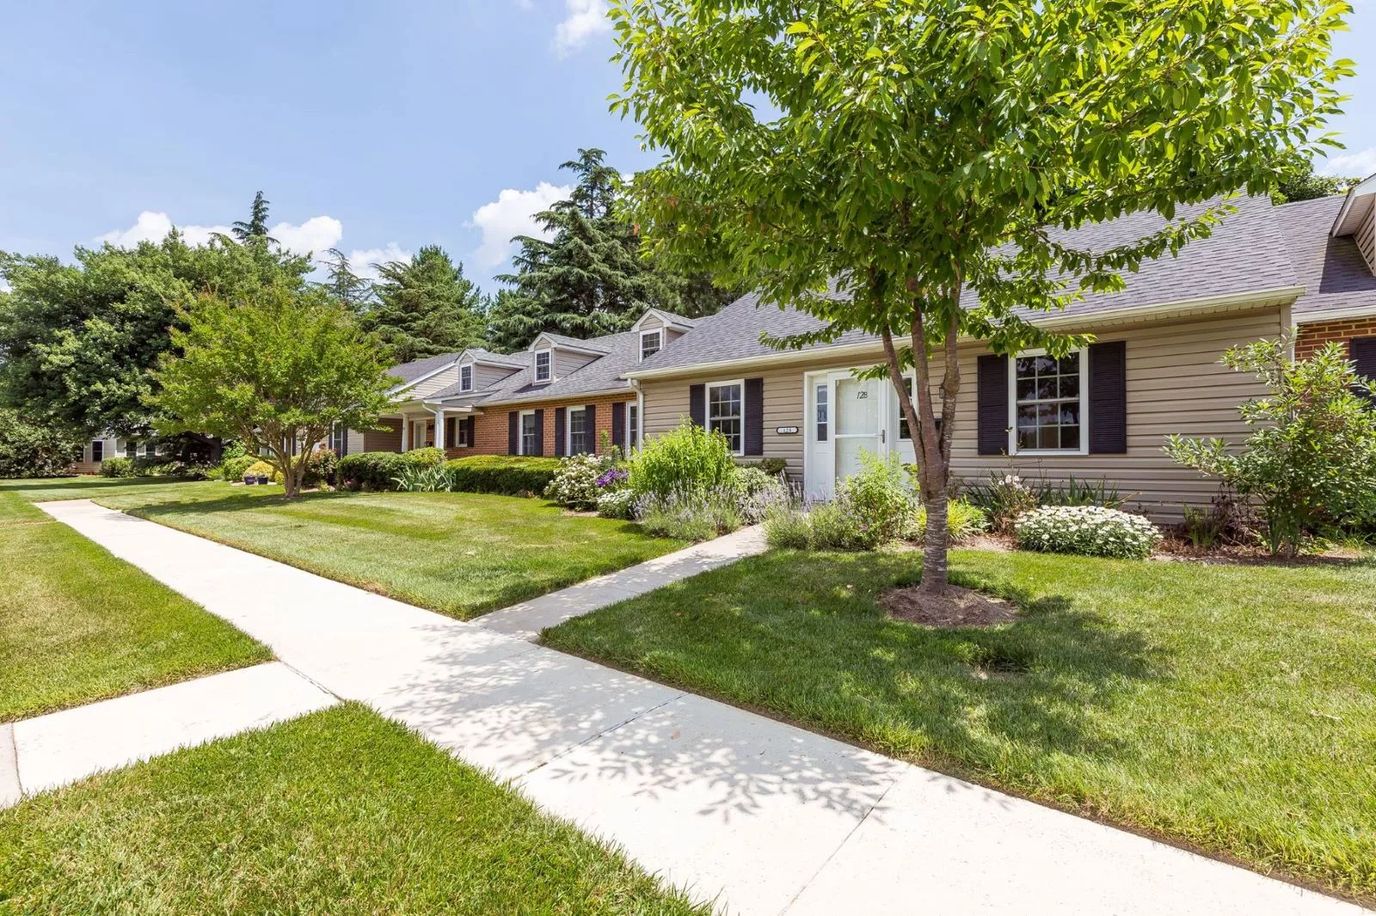
Nestled in Easton, Maryland’s historic town, Bayleigh Chase stands as a vibrant senior living community on the Eastern Shore, sprawled across a picturesque 35-acre landscaped haven. Embracing diverse lifestyles, the community presents an array of living choices, from expansive cottages and villas to inviting apartments. Whether seeking ultimate independence or convenient healthcare accessibility, Bayleigh Chase accommodates various preferences with personalized care. At the heart of Bayleigh Chase is a commitment to enriching lives through health-focused activities and tailored programs, nurturing well-being and vitality for each resident. The memory care services offer private suites adorned with amenities such as cable TV, private baths, and emergency call systems, ensuring comfort and security. Welcoming individuals aged 62 and above, Bayleigh Chase beckons those seeking a fulfilling retirement lifestyle while preserving control over their investments in a nurturing and engaging community. Residents savor three nutritious meals daily, accompanied by round-the-clock snacks, all supported by a dedicated professional team available 24/7.
As a member of the Acts Retirement-Life Communities, Bayleigh Chase harmonizes the warmth of a close-knit local community with the expertise of a seasoned retirement organization. Infusing vitality into residents’ lives, the community presents a lively array of activities and social engagements, fostering mental, physical, and spiritual well-being. Bayleigh Chase provides a carefree lifestyle bolstered by abundant life-enhancing amenities and healthcare services, encompassing assisted living, skilled nursing care, therapy, and support with daily activities.

(667) 358-1884

Quality ratings

Measured by Centers for Medicare & Medicaid Services (CMS)

Overall rating Info The Overall CMS Rating combines results from health inspections, staffing levels and quality measures. Health inspections carry the most weight. Staffing and quality scores can increase or decrease the final rating based on performance compared to state and national standards.
2/5 ▼ 1.0 Maryland average: 3.0/5
Health Inspection Info Based on the results of the facility's three most recent standard inspections and any complaint investigations. CMS reviews the number, scope, and severity of deficiencies, with more recent findings weighted more heavily.
2/5 ▼ 0.8 Maryland average: 2.8/5
Staffing Info Measures average nursing staff hours per resident per day, including Registered Nurses (RNs) and total nursing staff. Ratings are adjusted based on the level of care residents require and are compared to state and national benchmarks.
4/5 ▲ 1.0 Maryland average: 3.0/5
Quality Measures Info Based on clinical and physical health indicators reported to CMS, such as hospital readmissions, falls, pressure ulcers, and improvements in mobility. These measures reflect how well residents' health needs are being managed.
3/5 ▼ 0.7 Maryland average: 3.7/5

Staffing hours breakdown

Info Daily nursing hours per resident by staff type, reported to CMS. Higher is generally better — compare this facility to state and national averages to see where staffing stands.

Hours per resident per day — compared to Maryland state averages

Total nursing care / resident Info This home is ranked 28th out of 106 homes in Maryland.

Total adjusted nursing hours per resident per day, combining RN, LPN, and aide time. CMS adjusts this for case-mix so facilities can be fairly compared.
3h 54m per day
Rank #28 / 106Nurse hours — state benchmarkedThis home is ranked 28th out of 106 homes in Maryland.Shows adjusted nurse hours per resident per day benchmarked to the Maryland average, with a ranking across 106 Maryland SNFs. More hours mean more direct care. The national average is about 3.5 hrs; below 3.0 is a red flag.
This facility Maryland avg (3h 46m per day)
vs Maryland avg
+3%
Staff typeHours / dayvs state avg
Total Nursing (Weekend) Info Combined nursing hours (RN + LPN + Nurse Aide) per resident per day on weekends. Staffing often drops on weekends — this figure reveals whether the facility maintains adequate coverage outside of weekday hours. 3h 21m per day

Capacity and availability

This home usually has availability

Occupancy lower than 85% suggests more openings may be available.

Lower occupancy than the Maryland average: 82.4%
Occupancy rate 60.6% Rank #96 / 109Occupancy rate — state benchmarkedThis home is ranked 96th out of 109 homes in Maryland.Shows this facility's occupancy rate versus the Maryland average, with its statewide rank out of 109. Higher occupancy signals strong local demand and financial stability.
Avg. Length of Stay 152 days
Occupancy rate
60.6% Rank #96 / 109Occupancy rate — state benchmarkedThis home is ranked 96th out of 109 homes in Maryland.Shows this facility's occupancy rate versus the Maryland average, with its statewide rank out of 109. Higher occupancy signals strong local demand and financial stability.
Avg. Length of Stay
152 days

Who this home usually serves

TYPE OF STAY

Mostly short-term rehab stays

Most residents typically stay for a few weeks or months before returning home or moving on.

Breakdown by payment type

Medicare

59% of new residents, usually for short-term rehab.

Typical stay 1 - 2 months

Private pay

37% of new residents, often for short stays.

Typical stay 4 - 5 months

Medicaid

4% of new residents, often for long-term daily care.

Typical stay 6 years

Finances and operations

Voluntary non-profit community
Home revenue
$22.3M
Surplus of revenue
$420.0K
Voluntary non-profit community
Home revenue
$22.3M Rank #34 / 109Revenue — state benchmarkedThis home is ranked 34th out of 109 homes in Maryland.Shows this facility's annual revenue compared to the Maryland SNF average. Higher revenue generally means more resources for staffing and capital — read alongside Payroll %.
Surplus of revenue
$420.0K
Payroll costs Info The portion of the home's budget spent on staff, including nurses, caregivers, and other employees who support care and operations. Rank #13 / 109Payroll — state benchmarkedThis home is ranked 13th out of 109 homes in Maryland.Shows total annual staff payroll benchmarked to the Maryland average. Higher payroll investment relative to peers often signals better staffing and less reliance on cheaper contract labor.
$11.9M
53.5% of revenue Rank #10 / 109Payroll % — state benchmarkedThis home is ranked 10th out of 109 homes in Maryland.Shows payroll as a percentage of revenue versus the Maryland average. Well-run SNFs often land around 55–65%. Below 25% may signal understaffing or heavy agency use — read with Staffing ratings.
Other operating costs Info All remaining costs needed to run the home, such as food, utilities, building maintenance, supplies and administrative expenses.
$9.9M
Total costs $21.9M
Walk Score
Walk Score: 38 / 100 Rank #57 / 91Walk Score — state benchmarkedThis home is ranked 57th out of 91 homes in Maryland.Shows how walkable this facility's neighborhood is compared to the average Walk Score across Maryland SNFs. Higher scores benefit residents, families, and staff.
Somewhat walkable. A few nearby services may be reachable on foot, but most trips require transportation.

Types of Care at Bayleigh Chase

Assisted Living Nursing Home

Contact Bayleigh Chase

Health Inspection History

Inspections
Total health inspections 3

Maryland average 3.9


Last Health inspection on Jan 2025

Total health citations
38 Rank #46 / 108Health citations — state benchmarkedThis home is ranked 46th out of 108 homes in Maryland.Shows this facility's total health deficiency citations benchmarked to the Maryland state average, with a ranking across all 108 MD SNFs. Lower citation counts earn a better rank.

Maryland average 49.9

Citations per inspection
12.67 Rank #61 / 108Citations per inspection — state benchmarkedThis home is ranked 61st out of 108 homes in Maryland.Shows average deficiency citations per CMS inspection for this facility versus the Maryland mean across 108 SNFs with citation data. Lower is better.

Maryland average 12.81


Health citations are formal notices following inspections when they fail to comply with safety and care standards.

29 of 38 citations resulted from standard inspections; 5 of 38 resulted from complaint investigations; and 4 of 38 came from combined inspections (standard and complaint).

Breakdown of citation severity (last 3 years)
Critical Health citations More info
1
100% worse than Maryland average

Maryland average: 0.5


Serious Health citations More info 1
67% worse than Maryland average

Maryland average: 0.6

1 critical citation More info Maryland average: 0.5

1 serious citation More info Maryland average: 0.6

36 moderate citations More info Maryland average: 47.2

0 minor citations More info Maryland average: 1.7
Citations history (last 3 years)
Abuse/Neglect critical citation Info Issues related to protecting resident's from harm, including abuse, neglect, or mistreatment. Jan 17, 2025
Corrected

Abuse/Neglect moderate citation Info Issues related to protecting resident's from harm, including abuse, neglect, or mistreatment. Jan 17, 2025
Corrected

Abuse/Neglect moderate citation Info Issues related to protecting resident's from harm, including abuse, neglect, or mistreatment. Jan 17, 2025
Corrected

Abuse/Neglect moderate citation Info Issues related to protecting resident's from harm, including abuse, neglect, or mistreatment. Jan 17, 2025
Corrected

Financial Assistance for
Assisted Living in Maryland

Bayleigh Chase is located in Easton, Maryland.
Here are the financial assistance programs available to residents in Maryland.

Get Financial aid guidance

Community Options Waiver

Maryland Medicaid Community Options Waiver

Age 65+ or disabled
General Maryland resident, Medicaid- eligible, nursing home-level care need.
Income Limits (2025) ~$2,829/month 300% FBR, individual
Asset Limits $2,000 (individual), $3,000 (couple) (excludes home, car).
MD

High urban demand; rural outreach efforts.

Benefits
Personal care (5-7 hours/day, e.g., bathing, dressing) Respite care (up to 240 hours/year) Adult day care ($70/day) Home modifications ($1,500 avg.)

Senior Care Program

Maryland Senior Care

Age 65+
General Maryland resident, at risk of nursing home placement.
Income Limits ~$2,000/month individual, varies by county
Asset Limits $11,000 individual
MD

Limited funding; waitlists common in high-demand areas.

Benefits
In-home care (3-5 hours/week) Respite care (up to 10 days/year) Meals (~$6/meal) Transportation (~5 trips/month) Case management

Maryland Nursing Home Medicaid

Maryland Medical Assistance (Medicaid) Nursing Home Program

Age 65+
General Maryland resident, Medicaid-eligible, requires nursing home-level care.
Income Limits (2025) $943/month (individual); most income applied to care costs.
Asset Limits $2,500 (individual), $3,000 (couple); spousal protections up to $155,356.
MD

Home equity limit $636,000; estate recovery applies post-55.

Benefits
24/7 nursing care Meals Therapy Medications (unlimited per medical need)

Senior Assisted Living Subsidy Program

Maryland Senior Assisted Living Group Home Subsidy

Age 62+
General Maryland resident, in or moving to approved assisted living, low/moderate income.
Income Limits (2025) ~$34,000/year individual, varies by county
Asset Limits Not strict; prioritizes low-income.
MD

Not available statewide; facility must be licensed by MDH.

Benefits
Personal care Meals 24-hour supervision (up to $1,500/month subsidy typical)

Veterans Aid and Attendance (A&A) Benefit

Maryland VA Aid and Attendance

Age
General Wartime veteran/spouse, age 65+ or disabled, needs ADL help, Maryland resident.
Income Limits (2025) Net income minus medical expenses < $1,984/month individual with A&A
Asset Limits $155,356 net worth limit
MD

High veteran population in suburban/rural areas.

Benefits
Cash benefit ($1,478-$2,471/month, varies by status) for care costs

Senior Prescription Drug Assistance Program (SPDAP)

Maryland Senior Prescription Drug Assistance Program

Age 65+
General Maryland resident (6+ months), Medicare Part D enrolled.
Income Limits (2025) $48,560/year individual, 300% FPL
Asset Limits None specified.
MD

Supplements Medicare Part D; annual enrollment required.

Benefits
Up to $40/month premium subsidy Reducing drug costs

Medicare Savings Programs (MSP)

Maryland Medicare Savings Programs

Age 65+
General Maryland resident, Medicare Part A/B enrollee.
Income Limits (2025) $2,014/month (QMB), $2,706/month (SLMB/QI, individual).
Asset Limits $9,090 (individual), $13,630 (couple).
MD

Includes QMB, SLMB, QI categories.

Benefits
Covers premiums (up to $174.70/month Part B) Co-pays Deductibles

Community Personal Assistance Services (CPAS)

Maryland Medicaid Community Personal Assistance Services

Age 65+
General Maryland resident, Medicaid-eligible, needs ADL assistance.
Income Limits (2025) $943/month (individual); spend-down available.
Asset Limits $2,500 (individual), $3,000 (couple).
MD

Consumer-directed option allows hiring family caregivers.

Benefits
Personal care (hours vary, typically 20-30/week) Chores Nurse supervision

Places of interest near Bayleigh Chase

Address 1.4 miles from city center Info Estimated distance in miles from Easton's city center to Bayleigh Chase's address, calculated via Google Maps. — 0.12 miles to nearest hospital (DaVita Easton Dialysis Center)

Calculate Travel Distance to Bayleigh Chase

Add your location

Address

Staffing Data (Q2 2025)

This data corresponds to Q2 2025 and is based on CMS Payroll-Based Journal.

Total staff 92
Employees 91
Contractors 1
Staff to resident ratio 1.67:1
7% worse than Maryland average

Maryland average ratio: 1.81:1

Avg staff/day 40
Average shift 7.3 hours
9% worse than Maryland average

Maryland average: 8 hours

Total staff hours (quarter) 26,395
Nursing staff breakdown
Registered Nurse

Manages medical care and health needs.

Total count 16
Average shift length Info Average shift length. Calculated as total hours divided by days worked and average staff per day. 7.5 hours

No contractors work on this role.

Licensed Practical Nurse

Assists with medical care and medications.

Total count 9
Average shift length Info Average shift length. Calculated as total hours divided by days worked and average staff per day. 8.4 hours

No contractors work on this role.

Certified Nursing Assistant

Helps with daily care and mobility.

Total count 40
Average shift length Info Average shift length. Calculated as total hours divided by days worked and average staff per day. 7.5 hours

No contractors work on this role.

Contractor staffing

Total hours from contractors

0.1%

18 contractor hours this quarter

Occupational Therapy Assistant: 1
Staff by category
Certified Nursing Assistant4004011,06791100%7.5
Registered Nurse160164,76391100%7.5
Licensed Practical Nurse9093,02491100%8.4
Other Dietary Services Staff3031,0998189%7.5
Speech Language Pathologist4048656875%5.4
Physical Therapy Aide3038106673%6.5
Respiratory Therapy Technician4047957380%6.4
Clinical Nurse Specialist1014806066%8
RN Director of Nursing1014806976%7
Mental Health Service Worker1014796268%7.7
Dietitian1014746268%7.7
Occupational Therapy Aide1014405560%8
Administrator1014325459%8
Nurse Practitioner1014245358%8
Physical Therapy Assistant1014135864%7.1
Qualified Social Worker1012765459%5.1
Medical Director202484347%1.1
Occupational Therapy Assistant1122933%9.5
40 Certified Nursing Assistant
% of Days 100%
16 Registered Nurse
% of Days 100%
9 Licensed Practical Nurse
% of Days 100%
3 Other Dietary Services Staff
% of Days 89%
4 Speech Language Pathologist
% of Days 75%
3 Physical Therapy Aide
% of Days 73%
4 Respiratory Therapy Technician
% of Days 80%
1 Clinical Nurse Specialist
% of Days 66%
1 RN Director of Nursing
% of Days 76%
1 Mental Health Service Worker
% of Days 68%
1 Dietitian
% of Days 68%
1 Occupational Therapy Aide
% of Days 60%
1 Administrator
% of Days 59%
1 Nurse Practitioner
% of Days 58%
1 Physical Therapy Assistant
% of Days 64%
1 Qualified Social Worker
% of Days 59%
2 Medical Director
% of Days 47%
2 Occupational Therapy Assistant
% of Days 3%

Facility Characteristics

Source: CMS Long-Term Care Facility Characteristics (Data as of Jan 2026)

Total residents 55
Medicare
5
9.1% of residents
Medicaid
28
50.9% of residents
Private pay or other
22
40% of residents
Programs & Services
Residents Group

Residents meet regularly to discuss policies, care quality, and activities

CCRC

Part of a Continuing Care Retirement Community offering multiple care levels

Active Resident Council

Organized group of residents that meets regularly to discuss facility policies, quality of life, and activities.

Quality of care over time

These measures show how residents usually do over time at this home, based on health outcomes and preventive care.

High-risk clinical events score Info A composite score based on pressure ulcers, falls with injury, weight loss, walking ability decline, and activities of daily living decline. 13.6
5% worse than Maryland average

Maryland average: 12.9

Functional decline score Info A composite score based on activities of daily living decline, walking ability decline, and incontinence. 20.0
22% better than Maryland average

Maryland average: 25.7

Long-stay resident measures
Need for Help with Daily Activities Increased Info Percent of long-stay residents whose need for help with daily activities has increased 22.0%
7% better than Maryland average

Maryland average: 23.7%

Walking Ability Worsened Info Percent of long-stay residents whose ability to move independently worsened 20.1%
27% better than Maryland average

Maryland average: 27.7%

Low Risk Residents with Bowel/Bladder Incontinence Info Percent of low risk long-stay residents who lose control of their bowels or bladder 17.9%
31% better than Maryland average

Maryland average: 25.9%

Falls with Major Injury Info Percent of long-stay residents experiencing one or more falls with major injury 4.2%
85% worse than Maryland average

Maryland average: 2.3%

High Risk Residents with Pressure Ulcers Info Percent of long-stay high risk residents with pressure ulcers 12.8%
97% worse than Maryland average

Maryland average: 6.5%

Urinary Tract Infection Info Percent of long-stay residents with a urinary tract infection 1.1%
32% better than Maryland average

Maryland average: 1.6%

Lost Too Much Weight Info Percent of long-stay residents who lose too much weight 9.0%
56% worse than Maryland average

Maryland average: 5.8%

Depressive Symptoms Info Percent of long-stay residents who have depressive symptoms 0.0%
100% better than Maryland average

Maryland average: 20.2%

Antipsychotic Use Info Percent of long-stay residents who received an antipsychotic medication 17.7%
37% worse than Maryland average

Maryland average: 12.9%

Pneumococcal Vaccine Info Percent of long-stay residents assessed and appropriately given the pneumococcal vaccine 98.4%
7% better than Maryland average

Maryland average: 92.0%

Influenza Vaccine Info Percent of long-stay residents assessed and appropriately given the seasonal influenza vaccine 100.0%
In line with Maryland average

Maryland average: 96.6%

Short-stay resident measures
Pneumococcal Vaccine Info Percent of short-stay residents assessed and appropriately given the pneumococcal vaccine 87.9%
12% better than Maryland average

Maryland average: 78.4%

Antipsychotic medication increase Info Percent of short-stay residents who newly received an antipsychotic medication 0.0%
100% better than Maryland average

Maryland average: 1.4%

Influenza Vaccine Info Percent of short-stay residents assessed and appropriately given the seasonal influenza vaccine 89.4%
11% better than Maryland average

Maryland average: 80.6%

Penalties and fines

Federal penalties imposed by CMS for regulatory violations, including civil money penalties (fines) and denials of payment for new Medicare/Medicaid admissions.

Source: CMS Penalties Database

Penalty History

Penalties are imposed by CMS for violations of federal nursing home regulations.

No penalties in the past 3 years

No civil money penalties or payment denials were reported in the last 3 years.

Compare Assisted Living around Easton The information below is reported by the Maryland Department of Health, Office of Health Care Quality.

Filter by care type
Bayleigh Chase
NH

Nursing Home Licensed facility providing 24/7 skilled nursing care for residents with complex, ongoing medical needs. Staffed by RNs, LPNs, and CNAs. Inspected and star-rated annually by CMS. Accepts Medicare (short-term rehab) and Medicaid (long-term care).

AL

Assisted Living A licensed, long-term care setting for seniors or individuals with disabilities who need help with daily activities — like bathing, dressing, and medication management — but not 24-hour skilled nursing. Offers housing, meals, and around-the-clock support while aiming to maximize resident independence.

Easton (South Pennsfield)99No 38 -----------
Brookdale Olney
AL

Assisted Living A licensed, long-term care setting for seniors or individuals with disabilities who need help with daily activities — like bathing, dressing, and medication management — but not 24-hour skilled nursing. Offers housing, meals, and around-the-clock support while aiming to maximize resident independence.

MC

Memory Care Secured, specialized care for people living with Alzheimer's or dementia. Staff trained in cognitive impairment, with higher staff-to-resident ratios and an environment designed to reduce confusion and wandering risk.

Olney (Olney Estates)94Yes 16 Studio / 1 Bed / 2 Bed13
33%

Male Residents — State Benchmarked 33% of residents are male, compared to the Maryland average of 31%. This facility caters to a majority female resident pool (67% female), consistent with the broader assisted living trend where women significantly outnumber men.

67%

Female Residents — State Benchmarked 67% of residents are female, compared to the Maryland average of 69%. Women comprise the large majority, consistent with national assisted living demographics where women live longer and enter care facilities at higher rates.

94%

White Residents — State Benchmarked 94% of residents are reported as White, compared to the Maryland average of 81%. A higher White share than is typical for assisted living in Maryland in this dataset — compare with peer facilities for local context.

3%

African American Residents — State Benchmarked 3% of residents are reported as African American or Black, compared to the Maryland average of 12%. A lower African American share than is typical in Maryland; local markets still vary widely.

3%

Other Ethnicity Residents — State Benchmarked 3% of residents fall into categories other than White or African American (combined), compared to the Maryland average of 7%. This column aggregates Hispanic, Asian, multiracial, and any other labeled groups that are not classified as White or African American. Reported subgroups in this total: Asian (3%).

8%

Residents Age 65–74 — State Benchmarked 8% of residents are 65–74, compared to the Maryland average of 12%. Fewer younger seniors suggests the resident population skews older, likely requiring higher acuity care and more hands-on support.

39%

Residents Age 75–84 — State Benchmarked 39% of residents are 75–84, compared to the Maryland average of 31%. A high concentration in this mid-range bracket, where residents typically need moderate support with daily activities.

22%

Residents Age 85–94 — State Benchmarked 22% of residents are 85–94, compared to the Maryland average of 44%. The population here skews younger than the statewide norm, which may indicate a more active, lower-acuity community.

28%

Residents Age 95+ — State Benchmarked 28% of residents are 95 or older, compared to the Maryland average of 16%. A high proportion of the oldest-old suggests strong end-of-life care experience and very-high-acuity capabilities.

Candle Light Cove
AL

Assisted Living A licensed, long-term care setting for seniors or individuals with disabilities who need help with daily activities — like bathing, dressing, and medication management — but not 24-hour skilled nursing. Offers housing, meals, and around-the-clock support while aiming to maximize resident independence.

MC

Memory Care Secured, specialized care for people living with Alzheimer's or dementia. Staff trained in cognitive impairment, with higher staff-to-resident ratios and an environment designed to reduce confusion and wandering risk.

Easton (West Earle Avenue)64Yes 50 Private Rooms21
27%

Male Residents — State Benchmarked 27% of residents are male, compared to the Maryland average of 31%. This facility caters to a majority female resident pool (73% female), consistent with the broader assisted living trend where women significantly outnumber men.

73%

Female Residents — State Benchmarked 73% of residents are female, compared to the Maryland average of 69%. Women comprise the large majority, consistent with national assisted living demographics where women live longer and enter care facilities at higher rates.

100%

White Residents — State Benchmarked 100% of residents are reported as White, compared to the Maryland average of 81%. A higher White share than is typical for assisted living in Maryland in this dataset — compare with peer facilities for local context.

0%

African American Residents — State Benchmarked 0% of residents are reported as African American or Black, compared to the Maryland average of 12%. A lower African American share than is typical in Maryland; local markets still vary widely.

0%

Other Ethnicity Residents — State Benchmarked 0% of residents fall into categories other than White or African American (combined), compared to the Maryland average of 7%. This column aggregates Hispanic, Asian, multiracial, and any other labeled groups that are not classified as White or African American.

2%

Residents Age 65–74 — State Benchmarked 2% of residents are 65–74, compared to the Maryland average of 12%. Fewer younger seniors suggests the resident population skews older, likely requiring higher acuity care and more hands-on support.

38%

Residents Age 75–84 — State Benchmarked 38% of residents are 75–84, compared to the Maryland average of 31%. A high concentration in this mid-range bracket, where residents typically need moderate support with daily activities.

48%

Residents Age 85–94 — State Benchmarked 48% of residents are 85–94, compared to the Maryland average of 44%. This is typically the most common age bracket in assisted living — this facility is in line with the statewide norm.

12%

Residents Age 95+ — State Benchmarked 12% of residents are 95 or older, compared to the Maryland average of 16%. In line with the statewide profile for the oldest resident bracket.

The Dixon House
AL

Assisted Living A licensed, long-term care setting for seniors or individuals with disabilities who need help with daily activities — like bathing, dressing, and medication management — but not 24-hour skilled nursing. Offers housing, meals, and around-the-clock support while aiming to maximize resident independence.

Easton19No 80 Private Rooms-
25%

Male Residents — State Benchmarked 25% of residents are male, compared to the Maryland average of 31%. This facility caters to a majority female resident pool (75% female), consistent with the broader assisted living trend where women significantly outnumber men.

75%

Female Residents — State Benchmarked 75% of residents are female, compared to the Maryland average of 69%. Women comprise the large majority, consistent with national assisted living demographics where women live longer and enter care facilities at higher rates.

100%

White Residents — State Benchmarked 100% of residents are reported as White, compared to the Maryland average of 81%. A higher White share than is typical for assisted living in Maryland in this dataset — compare with peer facilities for local context.

0%

African American Residents — State Benchmarked 0% of residents are reported as African American or Black, compared to the Maryland average of 12%. A lower African American share than is typical in Maryland; local markets still vary widely.

0%

Other Ethnicity Residents — State Benchmarked 0% of residents fall into categories other than White or African American (combined), compared to the Maryland average of 7%. This column aggregates Hispanic, Asian, multiracial, and any other labeled groups that are not classified as White or African American.

19%

Residents Age 65–74 — State Benchmarked 19% of residents are 65–74, compared to the Maryland average of 12%. A higher share of younger seniors often signals a more independent, active resident community with lower acuity care needs.

6%

Residents Age 75–84 — State Benchmarked 6% of residents are 75–84, compared to the Maryland average of 31%. Below the state norm — the resident mix may skew either younger or older than this typical middle bracket.

63%

Residents Age 85–94 — State Benchmarked 63% of residents are 85–94, compared to the Maryland average of 44%. A high concentration of very elderly residents signals a higher-acuity facility with experience caring for advanced age-related needs.

13%

Residents Age 95+ — State Benchmarked 13% of residents are 95 or older, compared to the Maryland average of 16%. In line with the statewide profile for the oldest resident bracket.

Arcadia of Easton
AL

Assisted Living A licensed, long-term care setting for seniors or individuals with disabilities who need help with daily activities — like bathing, dressing, and medication management — but not 24-hour skilled nursing. Offers housing, meals, and around-the-clock support while aiming to maximize resident independence.

Easton (South Pennsfield)-No------------

Guides for Better Senior Living

Care Cost Calculator: See Prices in Your Area

Nursing Home Data Explorer

Don’t Wait Too Long: 7 Red Flag Signs Your Parent Needs Assisted Living Now

The True Cost of Assisted Living in 2025 – And How Families Are Paying For It

Understanding Senior Living Costs: Pricing Models, Discounts & Financial Assistance

Explore Open Rooms
1 Contact details
2 What type of senior care service are you looking for?
3 What budget do you have in mind for senior care?
4 How soon do you need to find care?
5 Additional details

Thank you for your interest!

Our team will be in touch shortly to help with next steps.