Bayshore Residence and Rehabilitation

Nursing Home
Overview of Bayshore Residence and Rehabilitation

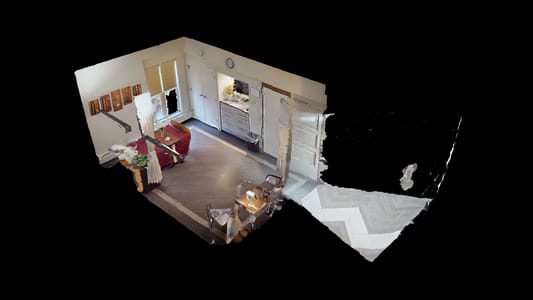
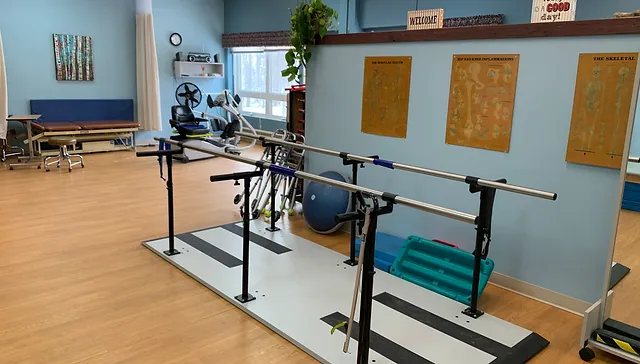
Bayshore Residence & Rehabilitation Center located in Duluth, MN, is a skilled nursing and rehabilitation facility specializing in transitional care services, and long term and memory care. Their accommodation offers spacious rooms that are inviting and comfortable, as well as highly customizable depending on the residents’ preference. The residents are encouraged to design their living spaces in a way that they may feel most at home in them. As part of their care services, each resident is provided 24/7 skilled nursing care, and are also offered additional care as needed such as wound and pain management.

Bayshore Residences values the role of food in keeping the residents healthy and happy. Offering an order anytime menu, residents may enjoy healthy choices prepared by the in-house chef, cooked to meet the residents dietary needs as well as personal preferences. Additionally, this nursing facility offers a number of amenities including Wi-Fi, well equipped recreation room, beauty salon, and safe and secured outdoor areas for engaging activities.

(218) 727-8651

Quality ratings

Measured by Centers for Medicare & Medicaid Services (CMS)

Overall rating Info Official CMS rating based on health inspections, staffing and quality measures.
2/5
Minnesota average: 3.2/5
Health Inspection Info Official CMS rating based on deficiencies found during state health inspections.
2/5
Minnesota average: 2.8/5
Staffing Info Official CMS rating based on nurse staffing hours per resident per day.
4/5
Minnesota average: 4.1/5
Quality Measures Info Official CMS rating based on clinical outcomes for residents.
2/5
Minnesota average: 3.1/5

Nursing care per resident

Info Average daily nursing hours per resident (adjusted for acuity). Higher values indicate more nursing time per resident.
4h 35m per day

This home provides 4% less nursing time per resident than the state average.

Minnesota average: 4h 46m per day

Staffing hours breakdown

Info Hours of care per resident per day, broken down by staff type. Data from CMS Medicare.
Staff type Facility State avg National avg
Registered Nurse (RN) Info Registered nurse hours per resident per day. 54m per day 1h 4m per day 41m per day
LPN / LVN Info Licensed Practical Nurse / Licensed Vocational Nurse hours per resident per day. 14m per day 37m per day 52m per day
Nurse Aide Info Nurse aide hours per resident per day. 2h 40m per day 2h 33m per day 2h 21m per day
Total Nursing (Weekend) Info Total number of nurse staff hours per resident per day on weekends. 3h 11m per day 3h 41m per day 3h 26m per day
Physical Therapist Info Physical therapist staff hours per resident per day. 2m per day 4m per day 4m per day
RN (Weekend) Info Registered nurse hours per resident per day on weekends. 32m per day 41m per day 29m per day

Capacity and availability

Medium-capacity home

Offers a balance of services and community atmosphere.

Total beds 140

This home usually has availability

Lower occupancy suggests more openings may be available.

Lower demand than the Minnesota average
Occupancy rate 65.9%
Residents per day (avg) 87
Occupancy rate
65.9%
Residents per day (avg)
87

Who this home usually serves

TYPE OF STAY

Mostly long-term care residents

Most residents stay for extended periods and receive ongoing daily care.

Might be optimal for
Long-term daily care Ongoing support needs

Breakdown by payment type

Medicare

21% of new residents, usually for short-term rehab.

Typical stay 1 months

Private pay

18% of new residents, often for short stays.

Typical stay 2 - 3 months

Medicaid

61% of new residents, often for long-term daily care.

Typical stay 5 - 6 months

Finances and operations

Proprietary home
Partnership
Home revenue
$13.0M
Operating loss
-$1.2M
Proprietary home Partnership
Home revenue
$13,005,237.00
Operating loss
$-1,194,232.00
Payroll costs Info The portion of the home's budget spent on staff, including nurses, caregivers, and other employees who support care and operations.
$4.4M
34.2% of revenue
Other operating costs Info All remaining costs needed to run the home, such as food, utilities, building maintenance, supplies and administrative expenses.
$9.8M
Total costs $14.2M
Walk Score
Walk Score: 8 / 100
Car-dependent. Most errands require a car, with limited nearby walkable options.

What does this home offer?

Building type icon
Building type icon

Building Type: Two-story

Types of Care at Bayshore Residence and Rehabilitation

Nursing Home
Contact Bayshore Residence and Rehabilitation

Compare Nursing Homes around Duluth

The information below is reported by the Minnesota Department of Health, Health Regulation Division.
Southview Acres
SNF

Nursing Homes 24/7 care needed

West St Paul
231
No
-
40
BOGEY HOLDINGS, LLC
72.4%
$23,273,894.00
$10,056,852.00
43.2%
165.70
2/5
4.6362
2/5
4/5
3/5
1
46
2
-10%
-3%
-9%
Bayshore Residence and Rehabilitation
SNF

Nursing Homes 24/7 care needed

Duluth
140
No
-
8
CBAY BAYSHORE HOLDINGS LLC
65.9%
$12,682,430.00
$4,446,749.00
35.1%
87.00
2/5
4.5836
2/5
4/5
2/5
2
37
3
-33%
-4%
-17%
South Shore Care Center
SNF

Nursing Homes 24/7 care needed

Worthington
65
No
-
5
CBAY WORTHINGTON HOLDINGS LLC
49.4%
$4,491,464.00
$1,487,381.00
33.1%
53.90
1/5
3.9150
1/5
4/5
2/5
5
56
4
+14%
-18%
-38%
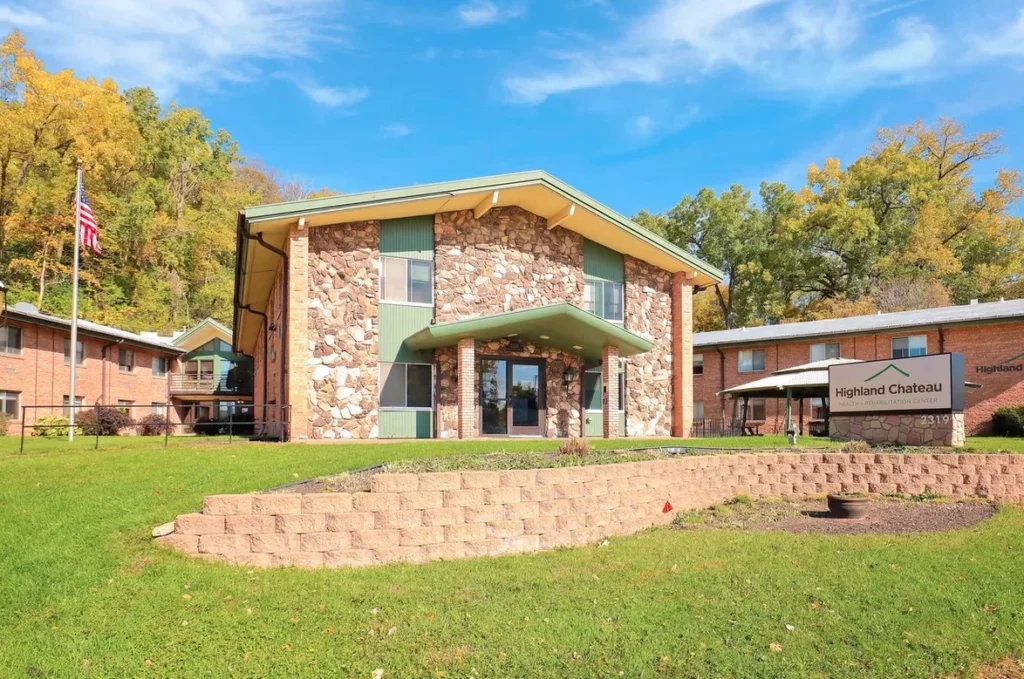
Highland Chateau Health + Rehabilitation Clinic
SNF

Nursing Homes 24/7 care needed

St Paul (Highland Park)
64
No
A+
59
PARENCE, MARCUS
84.0%
$10,357,765.00
$3,581,912.00
34.6%
50.50
-
4.1526
-
-
-
4
113
6
+25%
-13%
+5%
Crossroads Care Center
SNF

Nursing Homes 24/7 care needed

Worthington
52
No
-
66
#N/A
59.9%
$3,931,472.00
$1,840,658.00
46.8%
-
-
-
-
-
-
-
-
-
-
-
-25%

Video

Get to know the community with a high-definition video tour
Video thumbnail
Watch this video about life at Bayshore Residence and Rehabilitation
icon

Matterport

Experience a digital walkthrough
Loading tour...

Places of interest near Bayshore Residence and Rehabilitation

Address 1.8 miles from city center — 1.3 miles to nearest hospital (Midwest Podiatry Centers Duluth)

Address 1601 St Louis Ave, Duluth, MN 55802

Calculate Travel Distance to Bayshore Residence and Rehabilitation

Add your location

Address

Staffing Data

Source: CMS Payroll-Based Journal (Q2 2025)

119
Total Staff
70
Employees
49
Contractors
36,416
Total Hours (Quarter)
46
Avg Staff/Day
8.7
Avg Shift (hrs)
Nursing Staff Breakdown
Role Count Avg Shift (hrs) Uses Contractors?
Registered Nurse119.1 Yes
Licensed Practical Nurse88.8 Yes
Certified Nursing Assistant509.3 Yes
Staff by Category
Administration
1 staff
7.9hs shift avg
Nursing Staff
90 staff
9.2hs shift avg
Physicians & Practitioners
8 staff
7.8hs shift avg
Therapy Services
15 staff
6.8hs shift avg
Activities & Recreation
0 staff
0hs shift avg
Social Services
0 staff
0hs shift avg
Dietary Services
3 staff
7.9hs shift avg
Other Services
2 staff
7.9hs shift avg
Contractor Analysis
45.1%
of total hours from contractors
16,429 contractor hours this quarter
Certified Nursing Assistant: 29 Registered Nurse: 4 Medication Aide/Technician: 11 Licensed Practical Nurse: 5
Role Employees Contractors Total Staff Total Hours Days Worked % of Days Avg Shift (hrs)
Certified Nursing Assistant21295016,69291100%9.3
Medication Aide/Technician1011215,22891100%9
Registered Nurse74114,03491100%9.1
Clinical Nurse Specialist7072,9227886%7.8
Physical Therapy Aide100101,8686571%7.4
Licensed Practical Nurse3581,7868998%8.8
Mental Health Service Worker2029866571%7.9
Other Dietary Services Staff2027116470%7.9
Dietitian1014886167%8
Physical Therapy Assistant2024876875%7.1
Nurse Practitioner1014645864%8
Administrator1014605864%7.9
Respiratory Therapy Technician3032916167%4.1

Health Inspection History

Inspections
Total health inspections 7

Minnesota average 6


Last Health inspection on Apr 2025

Total health citations 37
Citations per inspection
5.29

Health citations are formal notices following inspections when they fail to comply with safety and care standards.

31 of 37 citations resulted from standard inspections; 5 of 37 resulted from complaint investigations; and 1 of 37 came from combined inspections (standard and complaint).

Breakdown of citation severity (last 3 years)
Critical Health citations More info 3
329% worse than Minnesota average

Minnesota average: 0.7


Serious Health citations More info 0
100% better than Minnesota average

Minnesota average: 0.5

3 critical citations More info Minnesota average: 0.7

0 serious citations More info Minnesota average: 0.5

33 moderate citations More info Minnesota average: 21.2

1 minor citation More info Minnesota average: 0.8
Citations history (last 3 years)
Environmental moderate citation Apr 17, 2025
Corrected

Infection Control moderate citation Apr 17, 2025
Corrected

Pharmacy moderate citation Apr 17, 2025
Corrected

Pharmacy moderate citation Apr 17, 2025
Corrected

Facility Characteristics

Source: CMS Long-Term Care Facility Characteristics (Data as of Jan 2026)

Ownership: For-Profit LLC
Resident Census by Payment Source
87 Total Residents
Medicare 7 (8%)
Medicaid 69 (79.3%)
Private Pay/Other 11 (12.6%)
Specialized Care Beds
50 Total Specialty Beds
35.7% of Bed Capacity
16
Alzheimer's / Dementia Beds
11.4%
34
Disabled Children / Young Adult Beds
24.3%
Programs & Services
Residents' Group
Family Member Group
Family Engagement

Active councils help families stay involved in care decisions and facility operations.

Quality of care over time

These measures show how residents usually do over time at this home, based on health outcomes and preventive care.

High-risk clinical events score Info A composite score based on pressure ulcers, falls with injury, weight loss, walking ability decline, and activities of daily living decline. 8.1
27% better than Minnesota average

Minnesota average: 11.1

Functional decline score Info A composite score based on activities of daily living decline, walking ability decline, and incontinence. 17.7
22% better than Minnesota average

Minnesota average: 22.6

Long-stay resident measures
Need for Help with Daily Activities Increased Info Percent of long-stay residents whose need for help with daily activities has increased 12.3%
35% better than Minnesota average

Minnesota average: 18.9%

Walking Ability Worsened Info Percent of long-stay residents whose ability to move independently worsened 16.9%
29% better than Minnesota average

Minnesota average: 23.8%

Low Risk Residents with Bowel/Bladder Incontinence Info Percent of low risk long-stay residents who lose control of their bowels or bladder 23.9%
In line with Minnesota average

Minnesota average: 25.0%

Falls with Major Injury Info Percent of long-stay residents experiencing one or more falls with major injury 1.8%
53% better than Minnesota average

Minnesota average: 3.7%

High Risk Residents with Pressure Ulcers Info Percent of long-stay high risk residents with pressure ulcers 7.9%
45% worse than Minnesota average

Minnesota average: 5.4%

Urinary Tract Infection Info Percent of long-stay residents with a urinary tract infection 1.2%
56% better than Minnesota average

Minnesota average: 2.7%

Lost Too Much Weight Info Percent of long-stay residents who lose too much weight 1.7%
60% better than Minnesota average

Minnesota average: 4.1%

Depressive Symptoms Info Percent of long-stay residents who have depressive symptoms 6.7%
54% worse than Minnesota average

Minnesota average: 4.4%

Antipsychotic Use Info Percent of long-stay residents who received an antipsychotic medication 26.6%
55% worse than Minnesota average

Minnesota average: 17.2%

Pneumococcal Vaccine Info Percent of long-stay residents assessed and appropriately given the pneumococcal vaccine 98.8%
In line with Minnesota average

Minnesota average: 97.3%

Influenza Vaccine Info Percent of long-stay residents assessed and appropriately given the seasonal influenza vaccine 98.9%
In line with Minnesota average

Minnesota average: 96.0%

Hospitalizations per 1,000 days Info Number of hospitalizations per 1,000 long-stay resident days. 2.51
50% worse than Minnesota average

Minnesota average: 1.67

ED visits per 1,000 days Info Number of outpatient emergency department visits per 1,000 long-stay resident days. 2.93
47% worse than Minnesota average

Minnesota average: 1.99

Short-stay resident measures
Pneumococcal Vaccine Info Percent of short-stay residents assessed and appropriately given the pneumococcal vaccine 84.1%
5% worse than Minnesota average

Minnesota average: 88.9%

Antipsychotic medication increase Info Percent of short-stay residents who newly received an antipsychotic medication 10.7%
458% worse than Minnesota average

Minnesota average: 1.9%

Influenza Vaccine Info Percent of short-stay residents assessed and appropriately given the seasonal influenza vaccine 92.3%
12% better than Minnesota average

Minnesota average: 82.6%

Re-hospitalized after SNF stay Info Percentage of short-stay residents who were re-hospitalized after their nursing home admission. 29.8%
29% worse than Minnesota average

Minnesota average: 23.1%

Emergency department visits Info Percentage of short-stay residents who had an outpatient emergency department visit. 27.5%
96% worse than Minnesota average

Minnesota average: 14.0%

Falls with major injury Info Percentage of SNF residents who experience falls with major injury during their stay. 0.0%
100% better than Minnesota average

Minnesota average: 0.8%

Ability to care for self at discharge Info Percentage of residents at or above expected ability to care for themselves at discharge. 46.9%
13% worse than Minnesota average

Minnesota average: 53.7%

Successful return to home or community Info Rate of successful return to home or community from a skilled nursing facility. 61.2%
21% better than Minnesota average

Minnesota average: 50.6%

Penalties and fines

Federal penalties imposed by CMS for regulatory violations, including civil money penalties (fines) and denials of payment for new Medicare/Medicaid admissions.

Source: CMS Penalties Database (Data as of Jan 2026)

Total fines amount $132K
198% higher than Minnesota average

Minnesota average: $44K

Number of fines 2
In line with Minnesota average

Minnesota average: 2.0

Payment Denials Info Serious action where Medicare and/or Medicaid temporarily stops payments for new residents until issues are fixed. 1
130% more payment denials than Minnesota average

Minnesota average: 0.4

Fines amount comparison
This facility $132K
Minnesota average $44K
Penalty History

Penalties are imposed by CMS for violations of federal nursing home regulations.

Civil Money Penalty Info Fines imposed for noncompliance, which can be assessed per day or per instance of violation. May 28, 2024
$122K
Payment Denial Info Serious action where Medicare and/or Medicaid temporarily stops payments for new residents until issues are fixed. May 28, 2024
10 days
Civil Money Penalty Info Fines imposed for noncompliance, which can be assessed per day or per instance of violation. Apr 20, 2024
$10K

Last updated: Jan 2026

Guides for Better Senior Living

Care Cost Calculator: See Prices in Your Area

Nursing Home Data Explorer

Don’t Wait Too Long: 7 Red Flag Signs Your Parent Needs Assisted Living Now

The True Cost of Assisted Living in 2025 – And How Families Are Paying For It

Understanding Senior Living Costs: Pricing Models, Discounts & Financial Assistance

Financial Aid for Minnesota Seniors

Get financial aid guidance

Elderly Waiver

Minnesota Medicaid EW

Age 65+, Minnesota resident, Medicaid-eligible, nursing home-level care need.

~$2,829/month (300% FBR, individual).

$3,000 (individual, higher than most states).

Higher asset limit; rural access focus.

Essential Community Supports (ECS)

Minnesota ECS

Age 65+, Minnesota resident, at risk of decline but not nursing home level.

~$1,732/month (individual, varies).

$3,000 (individual).

Bridges gap for those ineligible for waivers.

Alternative Care (AC) Program

Minnesota Alternative Care Program

Age 65+, Minnesota resident, NFLOC, not MA-eligible.

~$1,255-$2,829/month (100%-300% FPL); sliding scale copays.

$3,000 (individual); home equity limit $713,000.

CDCS option; statewide via counties.

Minnesota Senior Health Options (MSHO)

Minnesota Senior Health Options

Age 65+, Minnesota resident, eligible for MA and Medicare Parts A/B.

~$1,255/month (100% FPL for MA); spenddown allowed.

$3,000 (individual), $6,000 (couple).

7 health plans (e.g., UCare, HealthPartners); care coordinator assigned.

Minnesota Senior Care Plus (MSC+)

Minnesota Senior Care Plus

Age 65+, Minnesota resident, MA-eligible, not on Medicare.

~$1,255/month (100% FPL); spenddown allowed.

$3,000 (individual), $6,000 (couple).

Includes EW services; 7 health plans available.

Consumer Support Grant (CSG)

Minnesota Consumer Support Grant

Age 65+ or disabled, Minnesota resident, eligible for MA personal care but opts for grant.

~$1,255/month (MA-eligible); spenddown allowed.

$3,000 (individual).

Can hire family; statewide via counties.

Medicare Savings Program (MSP)

Minnesota Medicare Savings Program

Age 65+ or disabled, Minnesota resident, Medicare Part A/B.

~$2,510/month (QMB), ~$3,380/month (SLMB), ~$3,598/month (QI)—individual.

$9,430 (individual), $14,130 (couple).

Three tiers; no waitlist; includes Extra Help for Part D.

VA Aid and Attendance (A&A) and Housebound Benefits

Minnesota VA Aid and Attendance/Housebound

Age 65+ or disabled veteran/spouse, Minnesota resident, wartime service, need for ADL help (A&A) or homebound.

Net income < ~$1,984/month (veteran with dependent, A&A); pension offsets income.

~$155,356 (net worth limit).

High veteran demand in rural/urban areas.

Who we are

Your Senior Care Partner, Every Step of the Way

We help families find affordable senior communities and unlock same day discounts, Medicaid, and Medicare options tailored to your needs.

Contact us Today