


Total staff
83
Employees
55
Contractors
28
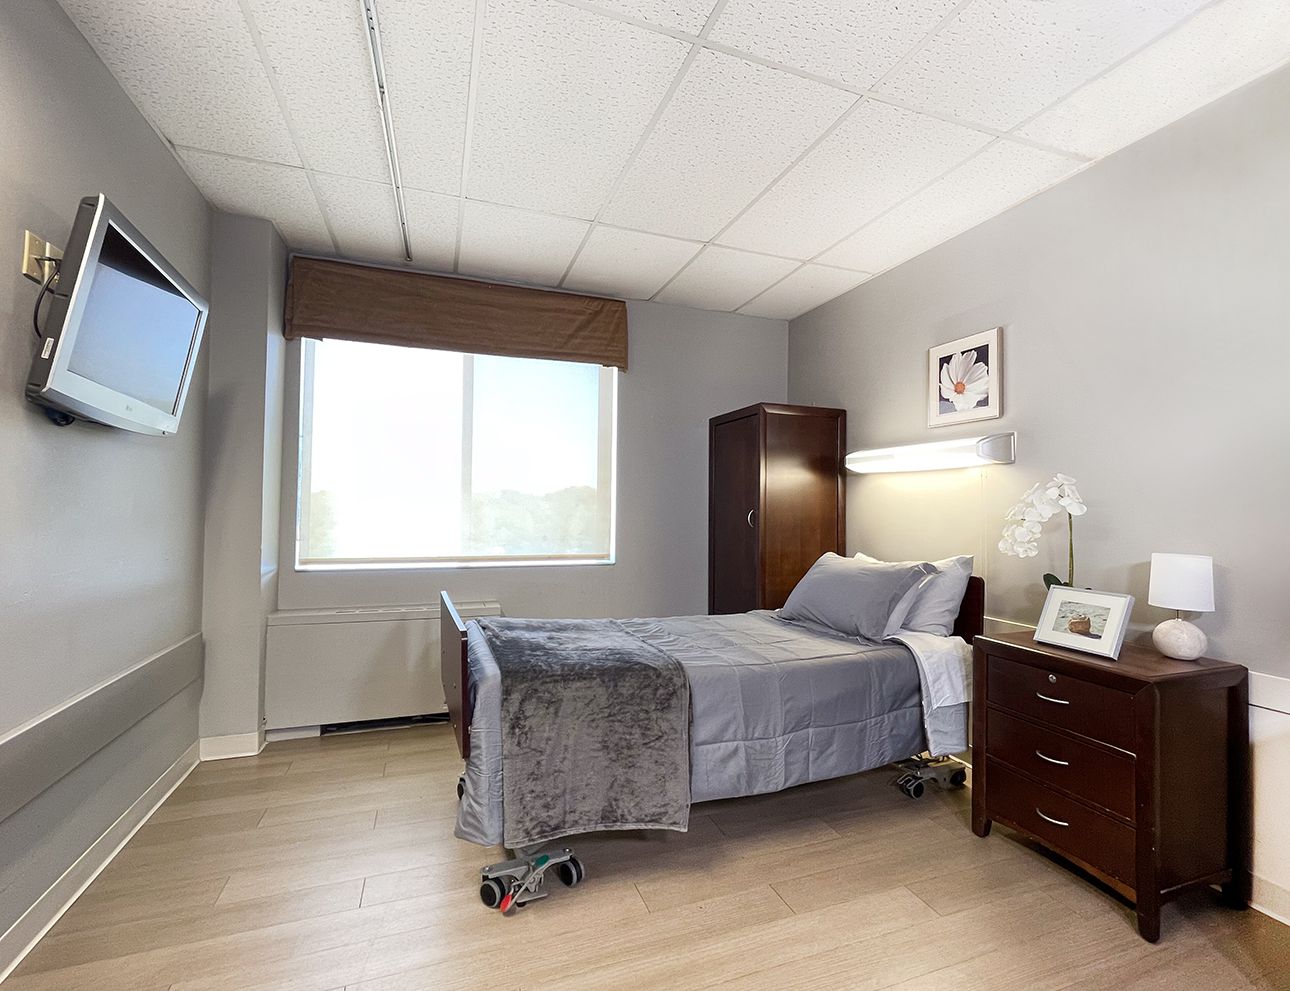


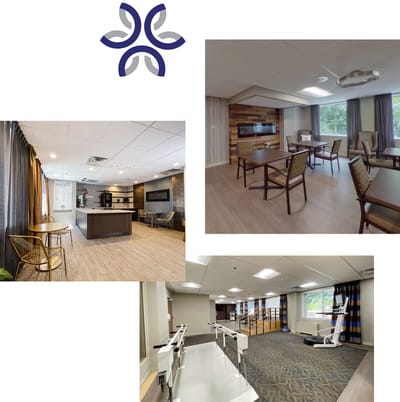


South Shore Care Center is a community in Worthington, Minnesota, that provides transitional care, rehabilitation, long-term care, memory care, respite care, and hospice services for older adults. Owned by Cbay Worthington Holdings LLC, it is located about a mile from Sanford Worthington Medical Center and accepts Medicare, Medicaid, and private pay.
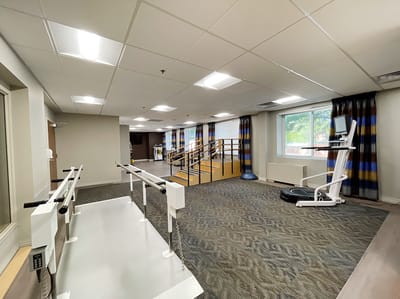
The community has 69 beds and operates at about 49 percent occupancy, with an average resident stay of 126 days. Registered nurses, licensed nurses, and nurse aides provide nearly four hours of nursing care per resident each day, supported by rehabilitation and other specialized clinical services.
A secured unit with exit-alert systems helps protect residents who are at risk of wandering. This added safety measure extends beyond the memory care program, providing additional security throughout the community. The surrounding neighborhood has a Walk Score of 5, making most errands and visits best completed by car.
| Staff type | Hours / Day / Resident | vs state avg |
|---|---|---|
|
Registered Nurse (RN)
| 1h 3m per day | ■ Avg State avg: 1h 4m per day · National avg: 41m per day |
|
LPN / LVN
| 25m per day | ▼ 32% State avg: 37m per day · National avg: 52m per day |
|
Nurse Aide
| 2h 11m per day | ▼ 15% State avg: 2h 33m per day · National avg: 2h 21m per day |
|
Weekend Total Nursing
| 3h 27m per day | ▼ 6% State avg: 3h 41m per day · National avg: 3h 26m per day |
|
Physical Therapist
| 3m per day | ▼ 29% State avg: 4m per day · National avg: 4m per day |
|
Weekend RN
| 44m per day | ▲ 7% State avg: 41m per day · National avg: 29m per day |
Reporting period: October 1 – December 31, 2025 (Q4 2025). Source: CMS Payroll-Based Journal report.
Manages medical care and health needs.
Assists with medical care and medications.
Helps with daily care and mobility.
Total hours from contractors
6,342 contractor hours this quarter
| Certified Nursing Assistant | 25 | 13 | 38 | 10,502 | 92 | 100% | 8.1 |
| Registered Nurse | 4 | 11 | 15 | 4,107 | 92 | 100% | 10.3 |
| Licensed Practical Nurse | 5 | 4 | 9 | 2,020 | 92 | 100% | 7.6 |
| Other Dietary Services Staff | 10 | 0 | 10 | 888 | 91 | 99% | 5.2 |
| Administrator | 1 | 0 | 1 | 512 | 64 | 70% | 8 |
| Nurse Practitioner | 1 | 0 | 1 | 500 | 63 | 68% | 7.9 |
| Dietitian | 1 | 0 | 1 | 497 | 63 | 68% | 7.9 |
| Clinical Nurse Specialist | 1 | 0 | 1 | 483 | 61 | 66% | 7.9 |
| Dental Services Staff | 1 | 0 | 1 | 466 | 54 | 59% | 8.6 |
| Respiratory Therapy Technician | 3 | 0 | 3 | 228 | 33 | 36% | 6.2 |
| Medication Aide/Technician | 1 | 0 | 1 | 19 | 3 | 3% | 6.4 |
| Speech Language Pathologist | 1 | 0 | 1 | 12 | 4 | 4% | 3 |
| Qualified Social Worker | 1 | 0 | 1 | 11 | 7 | 8% | 1.5 |
Includes penalties issued in 2023-2024
Federal penalties imposed by CMS for regulatory violations, including civil money penalties (fines) and denials of payment for new Medicare/Medicaid admissions.
Source: CMS Penalties Database (Data as of Jan 2026)
Minnesota average: $44K
Minnesota average: 2.0
Minnesota average: 0.4
Penalties are imposed by CMS for violations of federal nursing home regulations.
5 penalties in the past 3 years
Multiple penalties were reported in the last 3 years.
Last updated: Jan 2026
These measures show how residents usually do over time at this home, based on health outcomes and preventive care.
Minnesota average: 11.1
Minnesota average: 22.6
Minnesota average: 18.9%
Minnesota average: 23.8%
Minnesota average: 25.0%
Minnesota average: 3.7%
Minnesota average: 5.4%
Minnesota average: 2.7%
Minnesota average: 4.1%
Minnesota average: 4.4%
Minnesota average: 17.2%
Minnesota average: 97.3%
Minnesota average: 96.0%
Minnesota average: 88.9%
Minnesota average: 1.9%
Minnesota average: 82.6%
Minnesota average: 23.1%
Minnesota average: 14.0%
Minnesota average: 0.8%
Minnesota average: 50.6%
Quality measures are calculated from Minimum Data Set (MDS) assessments. For most measures, lower percentages indicate better care quality.
32% of new residents, usually for short-term rehab.
50% of new residents, often for short stays.
18% of new residents, often for long-term daily care.
Source: CMS Long-Term Care Facility Characteristics (Data as of Jan 2026)
Residents meet regularly to discuss policies, care quality, and activities
Organized group of residents that meets regularly to discuss facility policies, quality of life, and activities.
Data sourced from CMS Long-Term Care Facility Characteristics quarterly report. Payer mix reflects the current resident census by primary payment source.
Historical financial and operational data for South Shore Care Center from 2011–2023, based on CMS SNF Cost Reports.
Key figures below are for fiscal year ending in 12/2023.
Based on CMS SNF Cost Report for fiscal year ending in 12/2023.
This home supports both short-term rehab and long-term care, with residents staying for a wide range of durations.
Most new residents arrive under private pay (50% of admissions), and a typical private pay stay runs around 3 - 4 months.
Coverage residents most often arrive under.
Coverage residents most often leave under.
![]() 1.2 miles from city center
1.2 miles from city center
![]() Estimated distance in miles from Worthington's city center to South Shore Care Center's address, calculated via Google Maps.
— 1.08 miles to nearest hospital (Sanford Worthington Medical Center)
Estimated distance in miles from Worthington's city center to South Shore Care Center's address, calculated via Google Maps.
— 1.08 miles to nearest hospital (Sanford Worthington Medical Center)
Add your location
Info below is compiled from CMS reports & the MN Dept. of Health, senior community websites & trusted data sources such as Walk Score & BBB.
Communities are listed from highest to lowest based on our ranking methodology.
| South Shore Care Center | NH HOS MC RC SNF | Worthington | 69
Facility
69
MN AVG
61
Rank
#206 / 528 |
76.1%
Facility
76.1%
MN AVG
72.9
Rank
#150 / 282 | +4% | 3.92
Facility
3.92
MN AVG
4.77
Rank
#51 / 67 | +28% | -18% | $269.1k
Facility
$269.1k
MN AVG
$47.9k
Rank
#66 / 67 | 56
Facility
56
MN AVG
23.2
Rank
#62 / 67 | 6.2
Facility
6.2
MN AVG
3.8
Rank
#60 / 67 | 4 | 53 | - |
5
Facility
5
MN AVG
43
Rank
#581 / 632 | Cbay Worthington Holdings LLC | $4.2MFiscal year ending 12/2023
Facility
$4.2MFiscal year ending 12/2023
MN AVG
$9.9M
Rank
#60 / 67 | $1.8MFiscal year ending 12/2023
Facility
$1.8MFiscal year ending 12/2023
MN AVG
$4.9M
Rank
#64 / 67 | 42.3%Fiscal year ending 12/2023
Facility
42.3%Fiscal year ending 12/2023
MN AVG
50.7%
Rank
#29 / 67 | 245596 | ||||
| Crossroads Care Center | - | NH AL IL MC PC RC SNF | Worthington | 52
Facility
52
MN AVG
61
Rank
#248 / 528 | - | - | - | - | - | - | - | - | - | - | - | - | - | - |
66
Facility
66
MN AVG
43
Rank
#132 / 632 | $3.6MFiscal year ending 12/2023
Facility
$3.6MFiscal year ending 12/2023
MN AVG
$9.9M
Rank
#66 / 67 | $2.2MFiscal year ending 12/2023
Facility
$2.2MFiscal year ending 12/2023
MN AVG
$4.9M
Rank
#63 / 67 | 59.4%Fiscal year ending 12/2023
Facility
59.4%Fiscal year ending 12/2023
MN AVG
50.7%
Rank
#6 / 67 | 245395 |
South Shore Care Center is located in Worthington, Minnesota.
Here are the financial assistance programs available to residents in Minnesota.
South Shore Care Center has a walk score of 5. Car-dependent. Most errands require a car, with limited nearby walkable options.
South Shore Care Center's occupancy is 49.4%.
No, South Shore Care Center has a no-pet policy.
South Shore Care Center is registered as a for-profit.
Yes — there are 24 photos of South Shore Care Center in the photo gallery on this page.
South Shore Care Center is located at 1307 S Shore Dr, Worthington, MN 56187.
(507) 376-3175 will put you in contact with the team at South Shore Care Center.
Care Cost Calculator: See Prices in Your Area
Nursing Home Data Explorer
Don’t Wait Too Long: 7 Red Flag Signs Your Parent Needs Assisted Living Now
The True Cost of Assisted Living in 2025 – And How Families Are Paying For It
Understanding Senior Living Costs: Pricing Models, Discounts & Financial Assistance


