Highland Chateau Health + Rehabilitation Clinic
Nursing Home, Hospice Care, Memory Care & Respite Care · St Paul, MN

Highland Chateau Health + Rehabilitation Clinic

Nursing Home, Hospice Care, Memory Care & Respite Care · St Paul, MN
Calculator: See prices in your area
Highland Chateau Health + Rehabilitation Clinic accepts Medicare, Medicaid, and private pay.

Overview of Highland Chateau Health + Rehabilitation Clinic

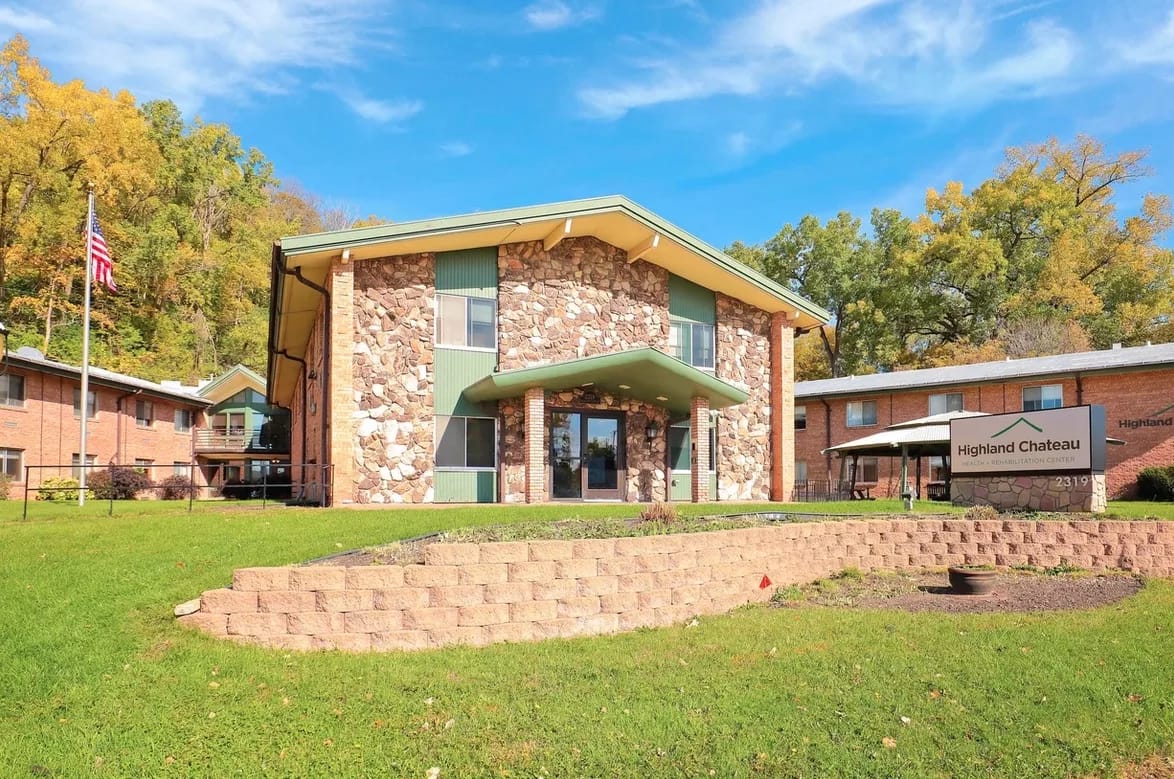
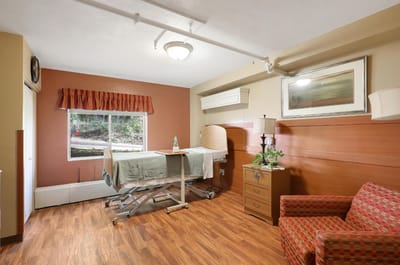
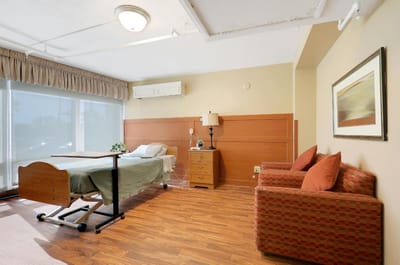
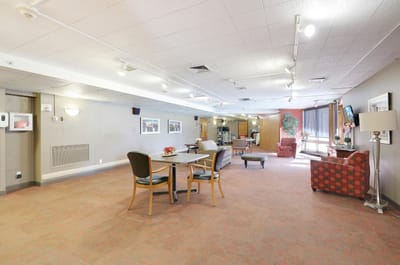
Highland Chateau Health + Rehabilitation Clinic is a private 64-bed skilled nursing facility located in St Paul, MN. This premier community offers both short-term and long-term care. Additionally, each resident is provided private accommodation where they can relax and feel at home, without having to worry about housekeeping or laundry.

The staff at Highland Chateau provides each resident with 24/7 care, rehabilitation therapies, as well as meal provisions. A barber and beauty salon is also available on-site for beauty and grooming services. Furthermore, the residents are offered wound and pain management services, in case they need specialized care after a surgery or major operation.

Staffing hours breakdown

Info Daily nursing hours per resident by staff type, reported to CMS. Higher is generally better — compare this facility to state and national averages to see where staffing stands.

Hours per resident per day — compared to Minnesota state averages

Total nursing care / resident Info This home is ranked 59th out of 89 homes in Minnesota for nurse hours. Total adjusted nursing hours per resident per day, combining RN, LPN, and aide time. CMS adjusts this for case-mix so facilities can be fairly compared.
4h 9m per day
Rank #59 / 89Nurse hours — State benchmarkedThis home is ranked 59th out of 89 homes in Minnesota. Shows adjusted nurse hours per resident per day benchmarked to the Minnesota average, with a ranking across 89 Minnesota facilities. More hours mean more direct care. The national average is about 3.5 hrs; below 3.0 is a red flag.Rankings are based only on facilities in Minnesota that report data for that category. Facilities without available data are excluded from the ranking.Click the rank badge to see the full State ranking.Click here to see the full State ranking.
This facility Minnesota avg (4h 46m per day)
vs Minnesota avg
-13%

1 of 6 metrics below state avg

Standout metric Physical Therapist is +86% above state avg
Staff typeHours / Day / Residentvs state avg
Registered Nurse (RN) Info RNs hold the highest nursing license and can assess residents, interpret test results, and direct care plans. More RN hours per day often signals stronger clinical oversight and faster response to health changes. 1h 14m per day ▲ 16% State avg: 1h 4m per day · National avg: 41m per day
LPN / LVN Info Licensed Practical Nurses (LPNs) or Licensed Vocational Nurses (LVNs) deliver routine hands-on care — medication administration, wound dressing, and monitoring vital signs. They work under RN supervision and make up a large share of daily bedside care. 41m per day ▲ 11% State avg: 37m per day · National avg: 52m per day
Nurse Aide Info Certified Nurse Aides (CNAs) provide the most direct day-to-day assistance: bathing, dressing, feeding, and mobility. Nurse aide hours are typically the largest staffing category and directly affect residents' quality of life. 2h 16m per day ▼ 11% State avg: 2h 33m per day · National avg: 2h 21m per day
Weekend Total Nursing Info Combined nursing hours (RN + LPN + Nurse Aide) per resident per day on weekends. Staffing often drops on weekends — this figure reveals whether the facility maintains adequate coverage outside of weekday hours. 3h 41m per day ■ Avg State avg: 3h 41m per day · National avg: 3h 26m per day
Physical Therapist Info Hours per resident per day provided by licensed Physical Therapists (PTs) or PT Assistants. PT services help residents recover mobility after injury or illness and are especially important for post-acute (short-stay) rehabilitation. 7m per day ▲ 86% State avg: 4m per day · National avg: 4m per day
Weekend RN Info Registered nurse hours specifically on weekends. Facilities sometimes reduce RN presence on Saturdays and Sundays — a low weekend RN figure compared to weekday hours can indicate reduced clinical oversight when most administrative staff are absent. 45m per day ▲ 11% State avg: 41m per day · National avg: 29m per day

Capacity and availability

This home usually has availability

Higher occupancy than the Minnesota average: 79.7%
Occupancy rate
84.4% Rank #120 / 331Occupancy rate — State benchmarkedThis home is ranked 120th out of 331 homes in Minnesota. Shows this facility's occupancy rate versus the Minnesota average, with its Statewide rank out of 331. Higher occupancy signals strong local demand and financial stability.Rankings are based only on facilities in Minnesota that report data for that category. Facilities without available data are excluded from the ranking.Click the rank badge to see the full State ranking.Click here to see the full State ranking.
Avg. Length of Stay
78 days
Bed community size
64-bed community Rank #219 / 532Bed count — State benchmarkedThis home is ranked 219th out of 532 homes in Minnesota. Shows this facility's certified or reported bed count compared to other Minnesota facilities. Larger communities may offer more amenities, programs, and on-site services for residents and families.Rankings are based only on facilities in Minnesota that report data for that category. Facilities without available data are excluded from the ranking.Click the rank badge to see the full State ranking.Click here to see the full State ranking.
A moderately sized community that may balance personal attention with shared amenities and social activities.
Years in operation
36 years in operation Rank #15 / 137Years in operation — State benchmarkedThis home is ranked 15th out of 137 homes in Minnesota. Shows how long this facility has been in operation compared to other Minnesota facilities. Longer operating histories may benefit residents, families, and staff.Rankings are based only on facilities in Minnesota that report data for that category. Facilities without available data are excluded from the ranking.Click the rank badge to see the full State ranking.Click here to see the full State ranking.
A longer operating history, which may indicate experience navigating regulations and delivering ongoing care.
Walk Score
Walk Score: 59 / 100 Rank #185 / 632Walk Score — State benchmarkedThis home is ranked 185th out of 632 homes in Minnesota. Shows how walkable this facility's neighborhood is compared to the average Walk Score across Minnesota facilities. Higher scores benefit residents, families, and staff.Rankings are based only on facilities in Minnesota that report data for that category. Facilities without available data are excluded from the ranking.Click the rank badge to see the full State ranking.Click here to see the full State ranking.
Moderately walkable. Some errands can be accomplished on foot, with a mix of nearby amenities.
BBB Rating
BBB Rating: A+ (Not Accredited)
An independent rating from the Better Business Bureau based on factors such as complaint history, transparency, and business practices.
How BBB ratings work

Staffing

Key information about the people who lead and staff this community.

Leadership

ContactMarybeth Lacina, Administrator

Therapy & Rehabilitation

3 services
Rehabilitation Services
Respite Care
Short-Term Rehab

Staffing & Medical

1 service
24-Hour Staffing

Additional Services

1 service
Short-Term Rehabilitation

Amenities & Lifestyle

Comfortable Accommodations
Salon And Spa Services
Reliable Transportation Services
Engaging Programs For Body And Mind
Fine Dining Options
Comfortable Common Areas

Contact Highland Chateau Health + Rehabilitation Clinic

Inspection History

In Minnesota, the Department of Health, Health Regulation Division is the primary authority for conducting onsite inspections and reporting on the quality of care in residential facilities.

Since 2023 · 3 years of data 99 deficiencies

Inspection Scorecard Info This scorecard compares key inspection, deficiency, and complaint metrics at this facility against the Minnesota state average. Metrics rated ≥15% worse than average are highlighted in red; those ≥15% better are highlighted in green.

Since 2023 vs. Minnesota state average
Overall vs. MN average 2 Worse Metrics worse than Minnesota average:
• Total deficiencies (890% above)
• Deficiencies per year (900% above)
0 Better No metrics in this bucket.
Latest Inspection December 30, 2025 Annual Inspection

Deficiencies Info Deficiencies are formal regulatory issues recorded during state inspections.

This FacilityMN Averagevs. MN Avg
Total deficiencies Info Formal regulatory issues recorded by inspectors across all inspection types. 9910 This facility has 890% more total deficiencies than a typical Minnesota nursing home (99 vs. MN avg 10).↑ 890% worse
Deficiencies per year Info Average deficiencies per year since 2023. 333.3 This facility has 900% more deficiencies per year than a typical Minnesota nursing home (33 vs. MN avg 3.3).↑ 900% worse

Inspection Reports Summary Info An editor-reviewed summary of the themes and findings across this facility's recent inspection reports.

  • The December 30, 2025 annual inspection found 2 deficiencies related to care plan updates and nursing leadership but no harm-level citations or complaints.
  • The September 19, 2025 routine inspection identified 18 deficiencies including immediate jeopardy for unsafe smoking with oxygen, medication errors, infection control lapses, staffing shortages, and ineffective pest control.
  • Multiple complaint investigations from 2023 to 2025 substantiated issues with pest control, inadequate pain management causing harm, medication self-administration oversight, and failure to protect residents from neglect and abuse.

Health Inspection History

Inspections since 2025
Total health inspections 16

Minnesota average 6


Last Health inspection on Sep 2025

Total health citations
113 Rank #89 / 90Health citations — State benchmarkedThis home is ranked 89th out of 90 homes in Minnesota. Shows this facility's total health deficiency citations benchmarked to the Minnesota State average, with a ranking across all 90 MN facilities. Lower citation counts earn a better rank.Rankings are based only on facilities in Minnesota that report data for that category. Facilities without available data are excluded from the ranking.Click the rank badge to see the full State ranking.Click here to see the full State ranking.

Minnesota average 23.2

Citations per inspection
7.06 Rank #87 / 90Citations per inspection — State benchmarkedThis home is ranked 87th out of 90 homes in Minnesota. Shows average deficiency citations per CMS inspection for this facility versus the Minnesota mean across 90 facilities with citation data. Lower is better.Rankings are based only on facilities in Minnesota that report data for that category. Facilities without available data are excluded from the ranking.Click the rank badge to see the full State ranking.Click here to see the full State ranking.

Minnesota average 3.76


Health citations are formal notices following inspections when they fail to comply with safety and care standards.

71 of 113 citations resulted from standard inspections; 37 of 113 resulted from complaint investigations; and 5 of 113 came from combined inspections (standard and complaint).

Breakdown of citation severity (last 1 year)
Critical health citations
3
329% worse than Minnesota average

Minnesota average: 0.7


Serious health citations
3
500% worse than Minnesota average

Minnesota average: 0.5

3 critical citations Minnesota average: 0.7

3 serious citations Minnesota average: 0.5

103 moderate citations Minnesota average: 21.2

4 minor citations Minnesota average: 0.8
Citations history (last 1 year)
Administration moderate citation Sep 19, 2025
Corrected

Environmental moderate citation Sep 19, 2025
Corrected

Infection Control moderate citation Sep 19, 2025
Corrected

Infection Control moderate citation Sep 19, 2025
Corrected

Staffing Data

Reporting period: October 1 – December 31, 2025 (Q4 2025). Source: CMS Payroll-Based Journal report.

Total staff 118
Employees 68
Contractors 50
Staff to resident ratio 2.88 : 1
32% more staff per resident than Minnesota average
Minnesota average ratio: 2.19 : 1 Minnesota average ratio: 2.19 : 1See full Minnesota ranking
Avg staff/day 28
Average shift 7.4 hours
0% compared with Minnesota average
Minnesota average: 7.5 hours Minnesota average shift: 7.5 hoursSee full Minnesota ranking
Total staff hours (quarter) 19,028

Nursing staff breakdown

Q4 2025 · Oct 1 – Dec 31 More info This data comes from the CMS Payroll-Based Journal report covering October 1 – December 31, 2025.
Registered Nurse

Manages medical care and health needs.

RN Staff Info 29 total: 9 full-time employees and 20 contractors. 29
Average shift length Info Average shift length. Calculated as total hours divided by days worked and average staff per day. 7.6 hours
Licensed Practical Nurse

Assists with medical care and medications.

LPN Staff Info 14 total: 7 full-time employees and 7 contractors. 14
Average shift length Info Average shift length. Calculated as total hours divided by days worked and average staff per day. 7.6 hours
Certified Nursing Assistant

Helps with daily care and mobility.

CNA Staff Info 58 total: 35 full-time employees and 23 contractors. 58
Average shift length Info Average shift length. Calculated as total hours divided by days worked and average staff per day. 7.4 hours

Contractor staffing

Q4 2025 · Oct 1 – Dec 31 More info This data comes from the CMS Payroll-Based Journal report covering October 1 – December 31, 2025.

Total hours from contractors

19.7%

3,758 contractor hours this quarter

Certified Nursing Assistant: 23 Registered Nurse: 20 Licensed Practical Nurse: 7

Staff by category

Q4 2025 · Oct 1 – Dec 31 More info This data comes from the CMS Payroll-Based Journal report covering October 1 – December 31, 2025.
Certified Nursing Assistant3523588,89592100%7.4
Registered Nurse920293,49892100%7.6
Licensed Practical Nurse77142,6839199%7.6
Clinical Nurse Specialist2029156470%7.7
Administrator1015126470%8
Respiratory Therapy Technician2024886470%5.4
Dietitian1014735863%8.2
Mental Health Service Worker1014565863%7.9
Nurse Practitioner1014405560%8
Physical Therapy Aide1012816571%4.3
Physical Therapy Assistant4042404448%5.5
Other Dietary Services Staff1011022325%4.4
Qualified Social Worker303462325%1.9
58 Certified Nursing Assistant
% of Days 100%
29 Registered Nurse
% of Days 100%
14 Licensed Practical Nurse
% of Days 99%
2 Clinical Nurse Specialist
% of Days 70%
1 Administrator
% of Days 70%
2 Respiratory Therapy Technician
% of Days 70%
1 Dietitian
% of Days 63%
1 Mental Health Service Worker
% of Days 63%
1 Nurse Practitioner
% of Days 60%
1 Physical Therapy Aide
% of Days 71%
4 Physical Therapy Assistant
% of Days 48%
1 Other Dietary Services Staff
% of Days 25%
3 Qualified Social Worker
% of Days 25%

Penalties and fines

Includes penalties issued in 2024-2025

Federal penalties imposed by CMS for regulatory violations, including civil money penalties (fines) and denials of payment for new Medicare/Medicaid admissions.

Source: CMS Penalties Database (Data as of Jan 2026)

Total fines amount $101K Rank #77 / 90Federal fines — State benchmarkedThis home is ranked 77th out of 90 homes in Minnesota. Shows this facility's cumulative CMS federal fine dollars versus the Minnesota average among facilities with fines, and where it ranks among 90 facilities in the pool. Lower total dollars mean a better rank.Rankings are based only on facilities in Minnesota that report data for that category. Facilities without available data are excluded from the ranking.Click the rank badge to see the full State ranking.Click here to see the full State ranking.
128% higher than Minnesota average

Minnesota average: $44K

Number of fines 4
99% more fines than Minnesota average

Minnesota average: 2.0

Payment Denials Info Serious action where Medicare and/or Medicaid temporarily stops payments for new residents until issues are fixed. 1
130% more payment denials than Minnesota average

Minnesota average: 0.4

Fines amount comparison
This facility $101K
Minnesota average $44K
Penalty History

Penalties are imposed by CMS for violations of federal nursing home regulations.

2 penalties in the past 3 years

Multiple penalties were reported in the last 3 years.

Civil Money Penalty Info Fines imposed for noncompliance, which can be assessed per day or per instance of violation. Mar 5, 2025
$48K
Civil Money Penalty Info Fines imposed for noncompliance, which can be assessed per day or per instance of violation. Jan 25, 2024
$17K

Last updated: Jan 2026

Quality of care over time

These measures show how residents usually do over time at this home, based on health outcomes and preventive care.

High-risk clinical events score Info A composite score based on pressure ulcers, falls with injury, weight loss, walking ability decline, and activities of daily living decline. 12.9
16% worse than Minnesota average

Minnesota average: 11.1

Functional decline score Info A composite score based on activities of daily living decline, walking ability decline, and incontinence. 27.2
20% worse than Minnesota average

Minnesota average: 22.6

Long-stay resident measures
Need for Help with Daily Activities Increased Info Percent of long-stay residents whose need for help with daily activities has increased 23.2%
22% worse than Minnesota average

Minnesota average: 18.9%

Walking Ability Worsened Info Percent of long-stay residents whose ability to move independently worsened 32.4%
36% worse than Minnesota average

Minnesota average: 23.8%

Low Risk Residents with Bowel/Bladder Incontinence Info Percent of low risk long-stay residents who lose control of their bowels or bladder 26.0%
In line with Minnesota average

Minnesota average: 25.0%

Falls with Major Injury Info Percent of long-stay residents experiencing one or more falls with major injury 0.6%
85% better than Minnesota average

Minnesota average: 3.7%

High Risk Residents with Pressure Ulcers Info Percent of long-stay high risk residents with pressure ulcers 5.9%
9% worse than Minnesota average

Minnesota average: 5.4%

Urinary Tract Infection Info Percent of long-stay residents with a urinary tract infection 0.0%
100% better than Minnesota average

Minnesota average: 2.7%

Lost Too Much Weight Info Percent of long-stay residents who lose too much weight 2.5%
40% better than Minnesota average

Minnesota average: 4.1%

Depressive Symptoms Info Percent of long-stay residents who have depressive symptoms 7.3%
67% worse than Minnesota average

Minnesota average: 4.4%

Antipsychotic Use Info Percent of long-stay residents who received an antipsychotic medication 11.9%
31% better than Minnesota average

Minnesota average: 17.2%

Pneumococcal Vaccine Info Percent of long-stay residents assessed and appropriately given the pneumococcal vaccine 82.0%
16% worse than Minnesota average

Minnesota average: 97.3%

Influenza Vaccine Info Percent of long-stay residents assessed and appropriately given the seasonal influenza vaccine 82.1%
14% worse than Minnesota average

Minnesota average: 96.0%

Short-stay resident measures
Pneumococcal Vaccine Info Percent of short-stay residents assessed and appropriately given the pneumococcal vaccine 68.4%
23% worse than Minnesota average

Minnesota average: 88.9%

Antipsychotic medication increase Info Percent of short-stay residents who newly received an antipsychotic medication 1.5%
22% better than Minnesota average

Minnesota average: 1.9%

Influenza Vaccine Info Percent of short-stay residents assessed and appropriately given the seasonal influenza vaccine 57.1%
31% worse than Minnesota average

Minnesota average: 82.6%

Re-hospitalized after SNF stay Info Percentage of short-stay residents who were re-hospitalized after their nursing home admission. 30.9%
34% worse than Minnesota average

Minnesota average: 23.1%

Emergency department visits Info Percentage of short-stay residents who had an outpatient emergency department visit. 6.3%
55% better than Minnesota average

Minnesota average: 14.0%

Falls with major injury Info Percentage of SNF residents who experience falls with major injury during their stay. 0.0%
100% better than Minnesota average

Minnesota average: 0.8%

Successful return to home or community Info Rate of successful return to home or community from a skilled nursing facility. 41.8%
17% worse than Minnesota average

Minnesota average: 50.6%

Breakdown by payment type

Medicare

21% of new residents, usually for short-term rehab.

Typical stay 20 days

Private pay

41% of new residents, often for short stays.

Typical stay 1 - 2 months

Medicaid

39% of new residents, often for long-term daily care.

Typical stay 5 - 6 months

Facility Characteristics

Source: CMS Long-Term Care Facility Characteristics (Data as of Jan 2026)

Total residents 41
Medicare
3
7.3% of residents
Medicaid
33
80.5% of residents
Private pay or other
5
12.2% of residents

Finances and operations

Based on CMS SNF Cost Report for fiscal year ending in 12/2023.

For-profit
Operated by a single business entity.
Net patient revenue Info Net patient revenue — what the home actually collects for resident care, after contractual allowances, bad debt and discounts are subtracted from its gross charges (CMS cost report, Worksheet G-3). It covers resident care only; money the home earns from other sources is shown separately as "Other income."
$7.0M
Net patient income Info Net patient income: net patient revenue minus the home's total operating expenses. A positive figure means it earns more from resident care than it spends to deliver it; a negative figure means the opposite. It excludes non-operating "other income."
-$876.7K
For-profit Operated by a single business entity.
Net patient revenue Info Net patient revenue — what the home actually collects for resident care, after contractual allowances, bad debt and discounts are subtracted from its gross charges (CMS cost report, Worksheet G-3). It covers resident care only; money the home earns from other sources is shown separately as "Other income."
$7.0M Rank #56 / 89Revenue — State benchmarkedThis home is ranked 56th out of 89 homes in Minnesota. Shows this facility's annual revenue compared to the Minnesota average. Higher revenue generally means more resources for staffing and capital — read alongside Payroll %.Rankings are based only on facilities in Minnesota that report data for that category. Facilities without available data are excluded from the ranking.Click the rank badge to see the full State ranking.Click here to see the full State ranking.
Net patient income Info Net patient income: net patient revenue minus the home's total operating expenses. A positive figure means it earns more from resident care than it spends to deliver it; a negative figure means the opposite. It excludes non-operating "other income."
-$876.7K
Other income Info Money the home earns outside of resident care — such as investments, grants, rentals and other non-operating sources (CMS cost report, Worksheet G-3). It is tracked separately from net patient revenue: it is not part of that figure, and it is not included in net patient income.
$240.0K
Payroll costs Info Staff salaries plus wage-related costs — benefits such as payroll taxes, health insurance and retirement — from the home's own accounting records (CMS cost report, Worksheet A). Contract or agency labor is counted separately, under other operating costs. Rank #62 / 89Payroll — State benchmarkedThis home is ranked 62nd out of 89 homes in Minnesota. Shows total annual staff payroll benchmarked to the Minnesota average. Higher payroll investment relative to peers often signals better staffing and less reliance on cheaper contract labor.Rankings are based only on facilities in Minnesota that report data for that category. Facilities without available data are excluded from the ranking.Click the rank badge to see the full State ranking.Click here to see the full State ranking.
$4.1M 58.4% of net patient revenue Info Payroll as a share of revenue: staff salaries and wage-related benefits divided by net patient revenue. A higher figure means more of each revenue dollar goes to staff pay. Rank #73 / 89Payroll % — State benchmarkedThis home is ranked 73rd out of 89 homes in Minnesota. Shows payroll as a percentage of revenue versus the Minnesota average. Well-run Minnesota facilities typically land around 61–68% — the top third Statewide. Below 25% may signal understaffing or heavy agency use — read with Staffing ratings.Rankings are based only on facilities in Minnesota that report data for that category. Facilities without available data are excluded from the ranking.Click the rank badge to see the full State ranking.Click here to see the full State ranking.
Other operating costs Info Everything it costs to run the home apart from payroll — food, utilities, supplies, maintenance, contract labor and administration. Calculated as total operating expense minus payroll (staff salaries and wage-related benefits).
$3.8M
Total costs Info The home's total operating expense for the year — all the costs of running it, salaries included (CMS cost report, Worksheet G-3).
$7.9M

What does this home offer?

Building type icon
Building type icon

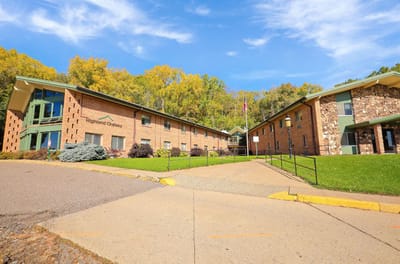
Building Type: Two-story

Who this home usually serves

TYPE OF STAY

Mix of rehab and long-term care

This home supports both short-term rehab and long-term care, with residents staying for a wide range of durations.

New residents most often arrive under private pay (41% of admissions), and a typical private pay stay runs around 1 - 2 months.

Admissions
244 total

Coverage residents most often arrive under.

Medicare 21%
Private pay 41%
Medicaid 39%
Discharges
253 total

Coverage residents most often leave under.

Medicare 13%
Private pay 34%
Medicaid 53%

Video

Get to know the community with a high-definition video tour
Video tour: Highland Chateau Health + Rehabilitation Clinic
Watch this video about life at Highland Chateau Health + Rehabilitation Clinic
icon

Matterport

Experience a digital walkthrough
Loading tour...

Places of interest near Highland Chateau Health + Rehabilitation Clinic

Address 5.1 miles from city center Info Estimated distance in miles from St Paul's city center to Highland Chateau Health + Rehabilitation Clinic's address, calculated via Google Maps. — 1.95 miles to nearest hospital (Minneapolis VA Medical Center)

Calculate Travel Distance to Highland Chateau Health + Rehabilitation Clinic

Add your location

Address

Compare Nursing Homes around St Paul

The information below is reported by the Minnesota Department of Health, Health Regulation Division.

5 facilities compared · CMS & MN Dept. of Health data

Shirley Chapman Sholom Home East
NH
St Paul (West Seventh - Fort Road)
118
Facility 118
MN AVG 61
Rank #80 / 532
77.7%
Facility 77.7%
MN AVG 79.7%
Rank #176 / 331
-3%
5.55
Facility 5.55
MN AVG 4.77
Rank #12 / 89
+11%+16%
$0
Facility $0
MN AVG $47.9k
Rank #1 / 90
26
Facility 26
MN AVG 23.2
Rank #46 / 90
6.5
Facility 6.5
MN AVG 3.8
Rank #85 / 90
189-
73
Facility 73
MN AVG 43
Rank #90 / 632
Lisa Edstrom
$15.1M
Facility $15.1M
MN AVG $9.9M
Rank #18 / 89
$11.5M
Facility $11.5M
MN AVG $4.9M
Rank #12 / 89
76%
Facility 76%
MN AVG 50.7%
Rank #44 / 89
245411
St Anthony Park Home
NH
HC
PC
RC
St Paul (Saint Anthony Park)
84
Facility 84
MN AVG 61
Rank #167 / 532
88.4%
Facility 88.4%
MN AVG 79.7%
Rank #86 / 331
+11%
5.04
Facility 5.04
MN AVG 4.77
Rank #29 / 89
-12%+6%
$8.8k
Facility $8.8k
MN AVG $47.9k
Rank #52 / 90
41
Facility 41
MN AVG 23.2
Rank #73 / 90
10.3
Facility 10.3
MN AVG 3.8
Rank #89 / 90
167-
80
Facility 80
MN AVG 43
Rank #47 / 632
Alan Markowitz
$10.0M
Facility $10.0M
MN AVG $9.9M
Rank #39 / 89
$5.0M
Facility $5.0M
MN AVG $4.9M
Rank #40 / 89
50.3%
Facility 50.3%
MN AVG 50.7%
Rank #59 / 89
245063
Walker Methodist – Westwood Ridge
NH
AL
IL
MC
RC
West St Paul (West Saint Paul)
140
Facility 140
MN AVG 61
Rank #44 / 532
82.9%
Facility 82.9%
MN AVG 79.7%
Rank #133 / 331
+4%
6.74
Facility 6.74
MN AVG 4.77
Rank #4 / 89
-3%+41%
$15.6k
Facility $15.6k
MN AVG $47.9k
Rank #56 / 90
30
Facility 30
MN AVG 23.2
Rank #55 / 90
5.0
Facility 5.0
MN AVG 3.8
Rank #67 / 90
1116-
63
Facility 63
MN AVG 43
Rank #145 / 632
Walker Methodist
$9.0M
Facility $9.0M
MN AVG $9.9M
Rank #46 / 89
$6.5M
Facility $6.5M
MN AVG $4.9M
Rank #44 / 89
72%
Facility 72%
MN AVG 50.7%
Rank #44 / 89
245618
Cerenity Humboldt
NH
AL
HC
MC
RC
St Paul (Concord-Robert)
115
Facility 115
MN AVG 61
Rank #88 / 532
85.0%
Facility 85.0%
MN AVG 79.7%
Rank #106 / 331
+7%
4.21
Facility 4.21
MN AVG 4.77
Rank #59 / 89
+14%-12%
$96.7k
Facility $96.7k
MN AVG $47.9k
Rank #79 / 90
45
Facility 45
MN AVG 23.2
Rank #77 / 90
5.0
Facility 5.0
MN AVG 3.8
Rank #67 / 90
675-
73
Facility 73
MN AVG 43
Rank #90 / 632
Fairview Bethesda Hospital
$11.9M
Facility $11.9M
MN AVG $9.9M
Rank #42 / 89
$5.8M
Facility $5.8M
MN AVG $4.9M
Rank #41 / 89
48.6%
Facility 48.6%
MN AVG 50.7%
Rank #54 / 89
245255
Highland Chateau Health + Rehabilitation Clinic -
NH
HC
MC
RC
St Paul (Highland Park)
64
Facility 64
MN AVG 61
Rank #219 / 532
84.4%
Facility 84.4%
MN AVG 79.7%
Rank #120 / 331
+6%
4.15
Facility 4.15
MN AVG 4.77
Rank #59 / 89
---+74%-13%
$84.5k
Facility $84.5k
MN AVG $47.9k
Rank #77 / 90
113
Facility 113
MN AVG 23.2
Rank #89 / 90
7.1
Facility 7.1
MN AVG 3.8
Rank #87 / 90
654A+
59
Facility 59
MN AVG 43
Rank #185 / 632
Marcus Parence
$7.0M
Facility $7.0M
MN AVG $9.9M
Rank #56 / 89
$4.1M
Facility $4.1M
MN AVG $4.9M
Rank #62 / 89
58.4%
Facility 58.4%
MN AVG 50.7%
Rank #73 / 89
245028

Financial Assistance for
Nursing Home in Minnesota

Highland Chateau Health + Rehabilitation Clinic is located in St Paul, Minnesota.
Here are the financial assistance programs available to residents in Minnesota.

Get Financial aid guidance

Elderly Waiver

Minnesota Medicaid EW

Age 65+
General Minnesota resident, Medicaid-eligible, nursing home-level care need.
Income Limits (2025) ~$2,829/month 300% FBR, individual
Asset Limits $3,000 individual, higher than most states
MN

Higher asset limit; rural access focus.

Benefits
Personal care (5-7 hours/day) Respite (240 hours/year) Adult day care (~$70/day) Home aides

Essential Community Supports (ECS)

Minnesota ECS

Age 65+
General Minnesota resident, at risk of decline but not nursing home level.
Income Limits ~$1,732/month individual, varies
Asset Limits $3,000 individual
MN

Bridges gap for those ineligible for waivers.

Benefits
In-home support (2-4 hours/week) Respite (up to 5 days/year) Transportation (~5 trips/month)

Alternative Care (AC) Program

Minnesota Alternative Care Program

Age 65+
General Minnesota resident, NFLOC, not MA-eligible.
Income Limits (2025) ~$1,255-$2,829/month (100%-300% FPL); sliding scale copays.
Asset Limits $3,000 (individual); home equity limit $713,000.
MN

CDCS option; statewide via counties.

Benefits
Personal care (4-6 hours/day) Respite (~5 days/year) Home health Meals Home mods

Minnesota Senior Health Options (MSHO)

Minnesota Senior Health Options

Age 65+
General Minnesota resident, eligible for MA and Medicare Parts A/B.
Income Limits (2025) ~$1,255/month (100% FPL for MA); spenddown allowed.
Asset Limits $3,000 (individual), $6,000 (couple).
MN

7 health plans (e.g., UCare, HealthPartners); care coordinator assigned.

Benefits
Personal care (5-7 hours/day) Medical care Respite Adult day care Home mods $900/year groceries (some plans)

Minnesota Senior Care Plus (MSC+)

Minnesota Senior Care Plus

Age 65+
General Minnesota resident, MA-eligible, not on Medicare.
Income Limits (2025) ~$1,255/month (100% FPL); spenddown allowed.
Asset Limits $3,000 (individual), $6,000 (couple).
MN

Includes EW services; 7 health plans available.

Benefits
Personal care (5-7 hours/day) Respite Adult day care Home mods Limited nursing home care

Consumer Support Grant (CSG)

Minnesota Consumer Support Grant

Age 65+ or disabled
General Minnesota resident, eligible for MA personal care but opts for grant.
Income Limits (2025) ~$1,255/month (MA-eligible); spenddown allowed.
Asset Limits $3,000 individual
MN

Can hire family; statewide via counties.

Benefits
Cash (~$500-$1,500/month) for personal care Respite Home mods Assistive tech

Medicare Savings Program (MSP)

Minnesota Medicare Savings Program

Age 65+ or disabled
General Minnesota resident, Medicare Part A/B.
Income Limits (2025) ~$2,510/month (QMB), ~$3,380/month (SLMB), ~$3,598/month (QI)—individual.
Asset Limits $9,430 (individual), $14,130 (couple).
MN

Three tiers; no waitlist; includes Extra Help for Part D.

Benefits
Covers Part B premiums ($174.70/month) Deductibles ($240/year) Copays (~20%)

VA Aid and Attendance (A&A) and Housebound Benefits

Minnesota VA Aid and Attendance/Housebound

Age 65+ or disabled veteran/spouse
General Minnesota resident, wartime service, need for ADL help (A&A) or homebound.
Income Limits (2025) Net income < ~$1,984/month (veteran with dependent, A&A); pension offsets income.
Asset Limits ~$155,356 net worth limit
MN

High veteran demand in rural/urban areas.

Benefits
Cash (~$1,433-$2,642/month veteran, ~$951-$1,318 spouse) for care costs (e.g., in-home, assisted living)

Frequently Asked Questions about Highland Chateau Health + Rehabilitation Clinic

What neighborhood is Highland Chateau Health + Rehabilitation Clinic in?

Highland Chateau Health + Rehabilitation Clinic is in the Highland Park neighborhood of St Paul.

Is Highland Chateau Health + Rehabilitation Clinic in a walkable area?

Highland Chateau Health + Rehabilitation Clinic has a walk score of 59. Moderately walkable. Some errands can be accomplished on foot, with a mix of nearby amenities.

What is the occupancy rate at Highland Chateau Health + Rehabilitation Clinic?

Highland Chateau Health + Rehabilitation Clinic's occupancy is 84.0%.

Does Highland Chateau Health + Rehabilitation Clinic operate as a for-profit or non-profit?

Highland Chateau Health + Rehabilitation Clinic is registered as a for-profit in MN.

Are there photos of Highland Chateau Health + Rehabilitation Clinic?

Yes — there are 10 photos of Highland Chateau Health + Rehabilitation Clinic in the photo gallery on this page.

What is the address of Highland Chateau Health + Rehabilitation Clinic?

Highland Chateau Health + Rehabilitation Clinic is located at 2319 7Th St W, St Paul, MN 55116.

What is the phone number of Highland Chateau Health + Rehabilitation Clinic?

(651) 698-0793 will put you in contact with the team at Highland Chateau Health + Rehabilitation Clinic.

Guides for Better Senior Living

Care Cost Calculator: See Prices in Your Area

Nursing Home Data Explorer

Don’t Wait Too Long: 7 Red Flag Signs Your Parent Needs Assisted Living Now

The True Cost of Assisted Living in 2025 – And How Families Are Paying For It

Understanding Senior Living Costs: Pricing Models, Discounts & Financial Assistance