Explore Open Rooms
1 Contact details
2 What type of senior care service are you looking for?
3 What budget do you have in mind for senior care?
4 How soon do you need to find care?
5 Additional details

Thank you for your interest!

Our team will be in touch shortly to help with next steps.

Nursing Home in League City

CMS overall rating Info The Overall CMS Rating combines results from health inspections, staffing levels and quality measures. Health inspections carry the most weight. Staffing and quality scores can increase or decrease the final rating based on performance compared to state and national standards.

Baywind Village Skilled Nursing & Rehabilitation

Overview of Baywind Village Skilled Nursing & Rehabilitation

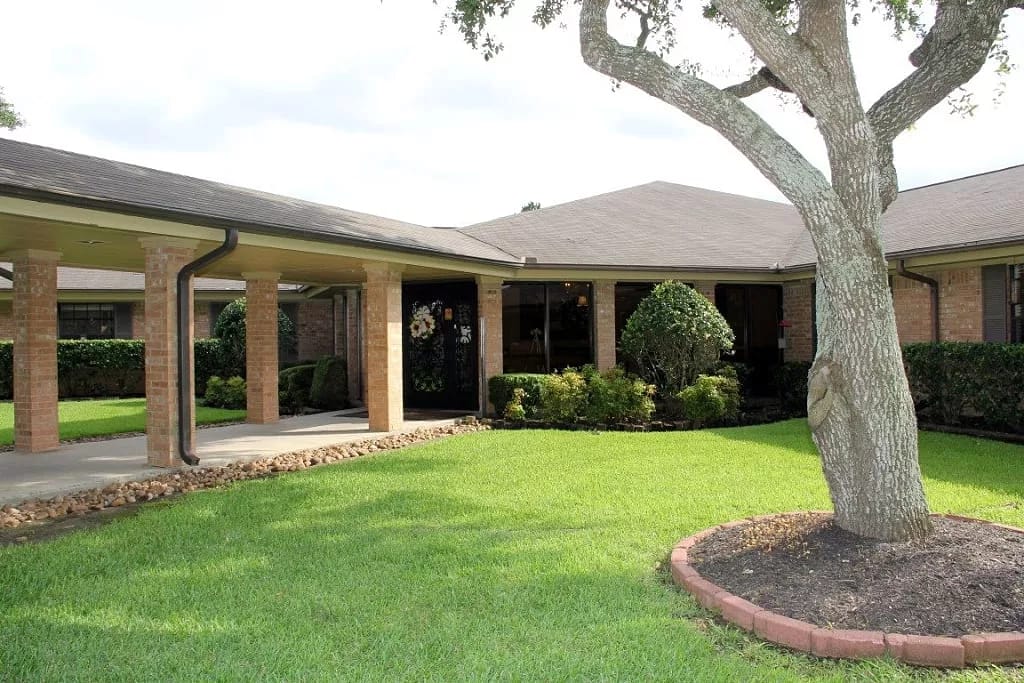
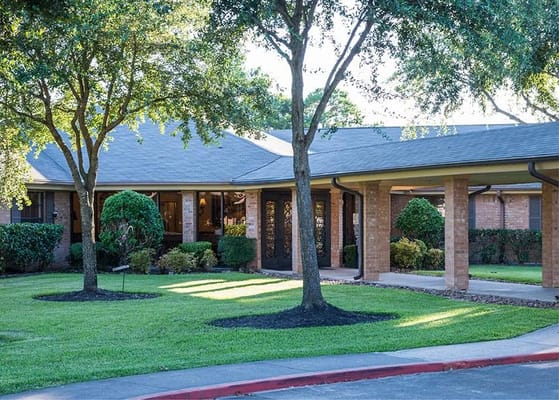
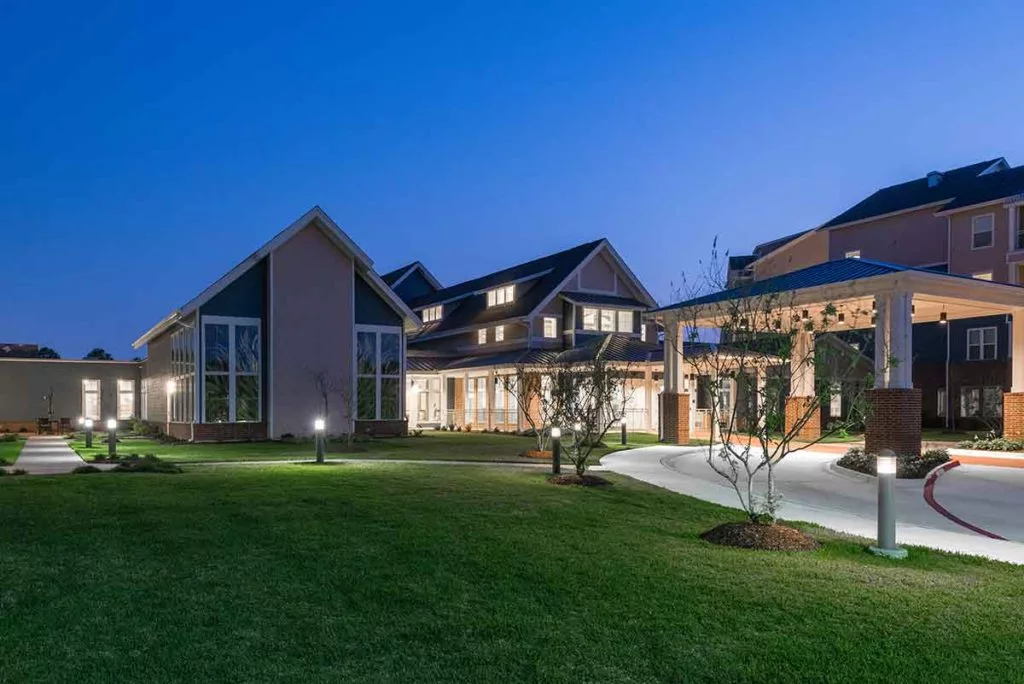
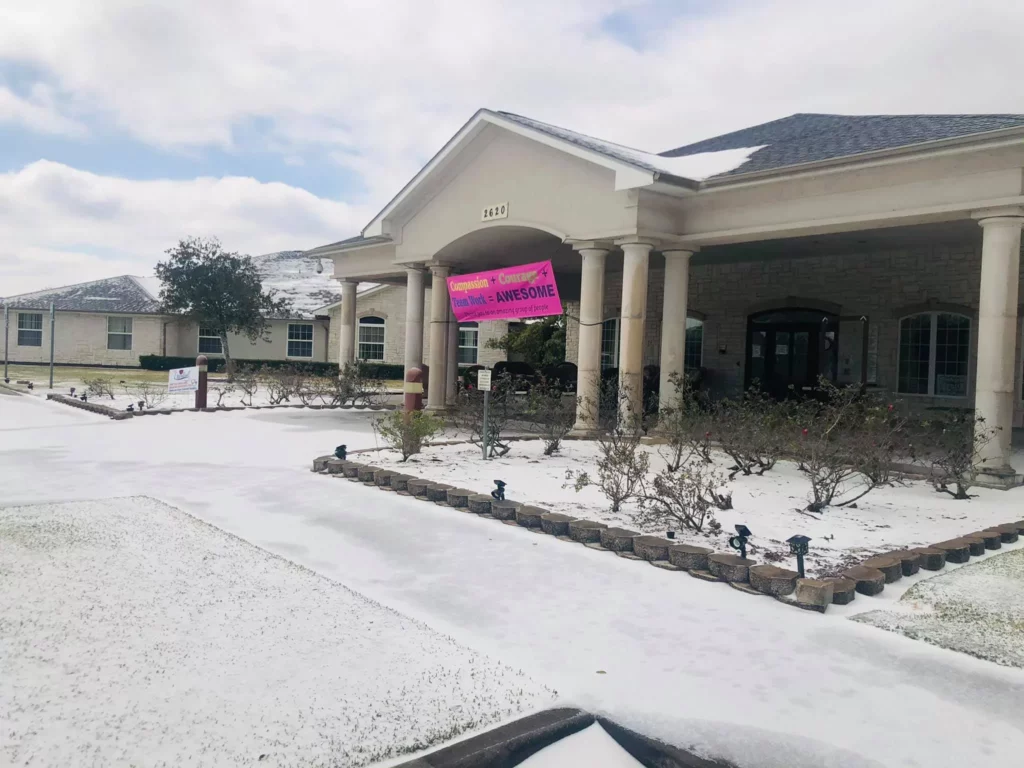
Situated in League City, Baywind Village Skilled Nursing & Rehabilitation is a 107-bed nursing facility, earning accolades for its exceptional services. With a legacy dating back to 1962, this family-owned establishment has consistently delivered quality care. The facility’s dedicated team, comprising skilled professionals such as nurses, therapists, and physicians, operates with commendable expertise, ensuring round-the-clock service. 

Their approach to senior care is highly personalized, offering a spectrum of specialized services including IV therapy, advanced wound care, diabetes management, stroke rehabilitation, respiratory therapy, and more. For those seeking top-tier nursing home facilities in League City and nearby areas, Baywind Village stands as a reputable choice. With its extensive history of providing quality care and a committed team of professionals, it remains a distinguished option for seniors and their families looking for excellence in senior living and nursing home services.

(281) 332-9588

Managed by Chris Barcelo

Licensed Nursing Home Administrator

Chris Barcelo is the Licensed Nursing Home Administrator at Baywind Village Skilled Nursing & Rehabilitation. As a third-generation owner, he actively engages with residents, families, and staff daily, ensuring a high standard of personalized and compassionate care in a safe and welcoming environment.

Quality ratings

Measured by Centers for Medicare & Medicaid Services (CMS)

Overall rating Info The Overall CMS Rating combines results from health inspections, staffing levels and quality measures. Health inspections carry the most weight. Staffing and quality scores can increase or decrease the final rating based on performance compared to state and national standards.
2/5
Texas average: 3.0/5
Health Inspection Info Based on the results of the facility's three most recent standard inspections and any complaint investigations. CMS reviews the number, scope, and severity of deficiencies, with more recent findings weighted more heavily.
2/5
Texas average: 2.9/5
Staffing Info Measures average nursing staff hours per resident per day, including Registered Nurses (RNs) and total nursing staff. Ratings are adjusted based on the level of care residents require and are compared to state and national benchmarks.
4/5
Texas average: 2.4/5
Quality Measures Info Based on clinical and physical health indicators reported to CMS, such as hospital readmissions, falls, pressure ulcers, and improvements in mobility. These measures reflect how well residents' health needs are being managed.
3/5
Texas average: 4.0/5

Nursing care per resident

Info This shows how many total hours of nursing staff time are available per resident each day. Higher numbers usually mean more staff support.
4h 42m per day

This home provides 24% more nursing time per resident than the Texas average.

Texas average: 3h 47m per day

Staffing hours breakdown

Info Hours of care per resident per day, broken down by staff type. Data from CMS Medicare.
Staff type Facility State avg National avg
Registered Nurse (RN) Info Registered nurse hours per resident per day. 1h 4m per day 26m per day 41m per day
Nurse Aide Info Nurse aide hours per resident per day. 2h 49m per day 2h 1m per day 2h 21m per day
Total Nursing (Weekend) Info Total number of nurse staff hours per resident per day on weekends. 4h 20m per day 2h 59m per day 3h 26m per day
Physical Therapist Info Physical therapist staff hours per resident per day. 5m per day 4m per day 4m per day
RN (Weekend) Info Registered nurse hours per resident per day on weekends. 48m per day 21m per day 29m per day

Capacity and availability

Medium-capacity home

Offers a balance of services and community atmosphere.

Total beds 107

This home usually has availability

Lower occupancy suggests more openings may be available.

Lower demand than the Texas average
Occupancy rate 78.3%
Residents per day (avg) 100
Occupancy rate
78.3%
Residents per day (avg)
100

Who this home usually serves

TYPE OF STAY

Primarily short stays

Residents typically stay for brief periods, with frequent admissions and discharges throughout the year.

Might be optimal for
Post-acute recovery Temporary care Transitional stays

Breakdown by payment type

Medicare

24% of new residents, usually for short-term rehab.

Typical stay 22 days

Private pay

72% of new residents, often for short stays.

Typical stay 23 days

Medicaid

4% of new residents, often for long-term daily care.

Typical stay 4 - 5 months

Finances and operations

Governmental community
Operated by state authorities.
Home revenue
$13.1M
Surplus of revenue
$363.0K
Governmental community Operated by state authorities.
Home revenue
$13.1M
Surplus of revenue
$363.0K
Payroll costs Info The portion of the home's budget spent on staff, including nurses, caregivers, and other employees who support care and operations.
$7.1M
54% of revenue
Other operating costs Info All remaining costs needed to run the home, such as food, utilities, building maintenance, supplies and administrative expenses.
$5.7M
Total costs $12.8M
Bed community size
107-bed community
A larger shared setting that may offer more common spaces and organized community services.
Years in operation
44 years in operation
A longer operating history, which may indicate experience navigating regulations and delivering ongoing care.
Walk Score
Walk Score: 52 / 100
Moderately walkable. Some errands can be accomplished on foot, with a mix of nearby amenities.
BBB Rating
BBB Rating: A+ (Not Accredited)
An independent rating from the Better Business Bureau based on factors such as complaint history, transparency, and business practices.
How BBB ratings work

Services

Medicare/medicaid

About this community

License Details

Facility TypeNursing
StatusActive
IssuanceJanuary 5, 2024
ExpirationJanuary 5, 2027
CountyGALVESTON

Additional Licensing Details

License Number308256
Year Opened2/23/1982

Ownership & Operating Entity

Baywind Village Skilled Nursing & Rehabilitation is administrated by Chris L Barcelo.

Management CompanyVILLAGE SKILLED NURSING & REHAB, LLC
OwnerCHAMBERS COUNTY PUBLIC HOSPITAL DISTRICT NO 1
Ownership TypeHOSPITAL DISTRICT/AUTHORITY

Type Of Units

Medicaid and Medicare
107 units
Total beds
107 units

Staffing

Key information about the people who lead and staff this community.

Leadership

ContactMr. Bob Brown

Therapy & Rehabilitation

2 services
Rehabilitation Services
Short-Term Rehab

Staffing & Medical

2 services
Skilled Nursing
24-Hour Staffing

Amenities & Lifestyle

0 amenities
Specific ProgramsIV Therapy, Neuromuscular Therapy, Orthopedic Rehabilitation, Specialized diabetes care, Advanced Wound Care, Post-Surgical Rehabilitation, Respiratory Therapy, Transitional Care, Stroke Rehab

Dining & Nutrition

Food DescriptionDining experience is provided with a focus on quality.

Types of Care at Baywind Village Skilled Nursing & Rehabilitation

Skilled Nursing

Contact Baywind Village Skilled Nursing & Rehabilitation

Inspection History

In Texas, the Health and Human Services Commission (HHSC) is the primary regulatory body that conducts unannounced inspections and publishes quality reports for all long-term care homes.

6 visits/inspections

2 visits/inspections triggered by complaints

2 routine inspections

Results

6 with issues

0 without issues

Latest inspection

Date May 7, 2025
Routine

13 deficiencies

Deficiencies indicate regulatory issues. A higher number implies the facility had several areas requiring improvement.

Texas average: 32 deficiencies

Health Inspection History

Inspections
Total health inspections 8

Texas average 7.4


Last Health inspection on Nov 2025

Total health citations 15

Texas average 25.9

Citations per inspection
1.88

Texas average 3.67


Health citations are formal notices following inspections when they fail to comply with safety and care standards.

2 of 15 citations resulted from standard inspections; 8 of 15 resulted from complaint investigations; and 5 of 15 came from combined inspections (standard and complaint).

Breakdown of citation severity (last 3 years)
Critical Health citations More info 0
100% better than Texas average

Texas average: 2


Serious Health citations More info 1
150% worse than Texas average

Texas average: 0.4

0 critical citations More info Texas average: 2

1 serious citation More info Texas average: 0.4

14 moderate citations More info Texas average: 23

0 minor citations More info Texas average: 0.4
Citations history (last 3 years)
Pharmacy moderate citation Info Issues related to medication management, including how drugs are stored, administered, and monitored. Nov 05, 2025

Quality of Care moderate citation Info Issues related to how well residents receive appropriate treatment and support for their medical and daily care needs. May 07, 2025
Corrected

Care Planning moderate citation Info Issues related to creating and updating personalized care plans for residents based on their needs and conditions. May 07, 2025
Corrected

Abuse/Neglect serious citation Info Issues related to protecting resident's from harm, including abuse, neglect, or mistreatment. Apr 16, 2025
Corrected

Compare Nursing Homes around League City The information below is reported by the Texas Health and Human Services Commission.

4 facilities compared · CMS & TX Dept. of Health data · Updated Apr 2026

Filter by care type
Mrc the Crossings
NH

Nursing Home Licensed facility providing 24/7 skilled nursing care for residents with complex, ongoing medical needs. Staffed by RNs, LPNs, and CNAs. Inspected and star-rated annually by CMS. Accepts Medicare (short-term rehab) and Medicaid (long-term care).

AL

Assisted Living A licensed, long-term care setting for seniors or individuals with disabilities who need help with daily activities — like bathing, dressing, and medication management — but not 24-hour skilled nursing. Offers housing, meals, and around-the-clock support while aiming to maximize resident independence.

League City
48
88.1%
+39%
4.65
+15%
+28%
0
1
1.0
0
41
-
-
Happy Harbor Methodist Home, Inc.
$7.9M
$5.4M
68.2%
676400
The Crossings Retirement Community
AL

Assisted Living A licensed, long-term care setting for seniors or individuals with disabilities who need help with daily activities — like bathing, dressing, and medication management — but not 24-hour skilled nursing. Offers housing, meals, and around-the-clock support while aiming to maximize resident independence.

IL

Independent Living Lifestyle-focused communities for older adults offering dining, activities, and transportation with minimal personal care. Best for active, independent seniors who want community without medical support.

MC

Memory Care Secured, specialized care for people living with Alzheimer's or dementia. Staff trained in cognitive impairment, with higher staff-to-resident ratios and an environment designed to reduce confusion and wandering risk.

NH

Nursing Home Licensed facility providing 24/7 skilled nursing care for residents with complex, ongoing medical needs. Staffed by RNs, LPNs, and CNAs. Inspected and star-rated annually by CMS. Accepts Medicare (short-term rehab) and Medicaid (long-term care).

League City
48
88.1%
+39%
4.65
+15%
+28%
0
1
1.0
0
41
-
55
Happy Harbor Methodist Home, Inc.
$7.9M
$5.4M
68.2%
676400
Regent Care Center
AL

Assisted Living A licensed, long-term care setting for seniors or individuals with disabilities who need help with daily activities — like bathing, dressing, and medication management — but not 24-hour skilled nursing. Offers housing, meals, and around-the-clock support while aiming to maximize resident independence.

NH

Nursing Home Licensed facility providing 24/7 skilled nursing care for residents with complex, ongoing medical needs. Staffed by RNs, LPNs, and CNAs. Inspected and star-rated annually by CMS. Accepts Medicare (short-term rehab) and Medicaid (long-term care).

RC

Respite Care Short-term temporary care — days to weeks — to give family caregivers a break. Full care provided during the stay. Often used after hospitalization or to trial a facility before a permanent placement decision.

League City
-
59.7%
-6%
-
-
-
-
1
0
0.0
0
76
-
25
Robert L. Moody
$7.3M
$3.1M
42.1%
675030
Baywind Village Skilled Nursing & Rehabilitation
AL

Assisted Living A licensed, long-term care setting for seniors or individuals with disabilities who need help with daily activities — like bathing, dressing, and medication management — but not 24-hour skilled nursing. Offers housing, meals, and around-the-clock support while aiming to maximize resident independence.

NH

Nursing Home Licensed facility providing 24/7 skilled nursing care for residents with complex, ongoing medical needs. Staffed by RNs, LPNs, and CNAs. Inspected and star-rated annually by CMS. Accepts Medicare (short-term rehab) and Medicaid (long-term care).

League City
113
78.3%
+23%
4.70
+31%
+29%
1
15
1.9
1
100
A+
52
Village Skilled Nursing & Rehab Care Llc
$13.0M
$7.1M
54.6%
675323

Places of interest near Baywind Village Skilled Nursing & Rehabilitation

Address 1.5 miles from city center — 1.93 miles to nearest hospital (Houston Methodist Clear Lake Hospital)

Calculate Travel Distance to Baywind Village Skilled Nursing & Rehabilitation

Add your location

Address

Staffing Data (Q2 2025)

This data corresponds to Q2 2025 and is based on CMS Payroll-Based Journal.

Total staff 366
Employees 196
Contractors 170
Staff to resident ratio 3.62:1
141% better than Texas average

Texas average ratio: 1.51:1

Avg staff/day 75
Average shift 8.2 hours
0% compared with Texas average

Texas average: 8.1 hours

Total staff hours (quarter) 55,999
Nursing staff breakdown
Registered Nurse

Manages medical care and health needs.

Total count 36
Average shift length Info Average shift length. Calculated as total hours divided by days worked and average staff per day. 8.8 hours

This role is partially covered by contractors.

Licensed Practical Nurse

Assists with medical care and medications.

Total count 94
Average shift length Info Average shift length. Calculated as total hours divided by days worked and average staff per day. 8.1 hours

This role is partially covered by contractors.

Certified Nursing Assistant

Helps with daily care and mobility.

Total count 167
Average shift length Info Average shift length. Calculated as total hours divided by days worked and average staff per day. 8.7 hours

This role is partially covered by contractors.

Contractor staffing

Total hours from contractors

9%

5,051 contractor hours this quarter

Certified Nursing Assistant: 98 Licensed Practical Nurse: 67 Medication Aide/Technician: 3 Registered Nurse: 1 Medical Director: 1
Staff by category
Certified Nursing Assistant699816720,48591100%8.7
Registered Nurse351368,20691100%8.8
Licensed Practical Nurse2767947,87691100%8.1
Medication Aide/Technician133164,58891100%9
RN Director of Nursing7073,2908492%8
Speech Language Pathologist100102,7948088%7.5
Physical Therapy Aide110112,6638796%6.6
Qualified Social Worker5051,1178593%7
Respiratory Therapy Technician50579591100%5.6
Other Dietary Services Staff2026976571%8
Physical Therapy Assistant5056518391%5.7
Administrator1015206571%8
Nurse Practitioner1015206571%8
Clinical Nurse Specialist1015206571%8
Dietitian1015206571%8
Mental Health Service Worker2024225257%8.1
Occupational Therapy Aide1013123943%8
Medical Director011261314%2
167 Certified Nursing Assistant
% of Days 100%
36 Registered Nurse
% of Days 100%
94 Licensed Practical Nurse
% of Days 100%
16 Medication Aide/Technician
% of Days 100%
7 RN Director of Nursing
% of Days 92%
10 Speech Language Pathologist
% of Days 88%
11 Physical Therapy Aide
% of Days 96%
5 Qualified Social Worker
% of Days 93%
5 Respiratory Therapy Technician
% of Days 100%
2 Other Dietary Services Staff
% of Days 71%
5 Physical Therapy Assistant
% of Days 91%
1 Administrator
% of Days 71%
1 Nurse Practitioner
% of Days 71%
1 Clinical Nurse Specialist
% of Days 71%
1 Dietitian
% of Days 71%
2 Mental Health Service Worker
% of Days 57%
1 Occupational Therapy Aide
% of Days 43%
1 Medical Director
% of Days 14%

Facility Characteristics

Source: CMS Long-Term Care Facility Characteristics (Data as of Jan 2026)

Total census
101 residents
Residents by payment source
Medicare
19 residents (18.8%)
Medicaid
11 residents (10.9%)
Private pay or other
71 residents (70.3%)
Programs & Services
Residents' Group

Residents meet regularly to discuss policies, care quality, and activities

Active Resident Council

Organized group of residents that meets regularly to discuss facility policies, quality of life, and activities.

Quality of care over time

These measures show how residents usually do over time at this home, based on health outcomes and preventive care.

High-risk clinical events score Info A composite score based on pressure ulcers, falls with injury, weight loss, walking ability decline, and activities of daily living decline. 12.3
42% worse than Texas average

Texas average: 8.6

Functional decline score Info A composite score based on activities of daily living decline, walking ability decline, and incontinence. 17.0
6% worse than Texas average

Texas average: 16.0

Long-stay resident measures
Significantly above average Texas avg: 4.2 Info CMS star rating based on long-stay quality measure performance. 5 stars = significantly above average, 1 star = significantly below average.
Need for Help with Daily Activities Increased Info Percent of long-stay residents whose need for help with daily activities has increased 11.3%
30% better than Texas average

Texas average: 16.2%

Walking Ability Worsened Info Percent of long-stay residents whose ability to move independently worsened 25.0%
54% worse than Texas average

Texas average: 16.2%

Low Risk Residents with Bowel/Bladder Incontinence Info Percent of low risk long-stay residents who lose control of their bowels or bladder 14.6%
6% better than Texas average

Texas average: 15.7%

Falls with Major Injury Info Percent of long-stay residents experiencing one or more falls with major injury 1.9%
40% better than Texas average

Texas average: 3.2%

High Risk Residents with Pressure Ulcers Info Percent of long-stay high risk residents with pressure ulcers 10.3%
133% worse than Texas average

Texas average: 4.4%

Urinary Tract Infection Info Percent of long-stay residents with a urinary tract infection 0.0%
100% better than Texas average

Texas average: 0.8%

Lost Too Much Weight Info Percent of long-stay residents who lose too much weight 12.7%
266% worse than Texas average

Texas average: 3.5%

Depressive Symptoms Info Percent of long-stay residents who have depressive symptoms 1.4%
52% better than Texas average

Texas average: 2.9%

Antipsychotic Use Info Percent of long-stay residents who received an antipsychotic medication 8.6%
9% worse than Texas average

Texas average: 7.9%

Pneumococcal Vaccine Info Percent of long-stay residents assessed and appropriately given the pneumococcal vaccine 100.0%
In line with Texas average

Texas average: 97.3%

Influenza Vaccine Info Percent of long-stay residents assessed and appropriately given the seasonal influenza vaccine 95.5%
In line with Texas average

Texas average: 97.9%

Short-stay resident measures
Below average Texas avg: 2.9 Info CMS star rating based on short-stay quality measure performance. 5 stars = much above average, 1 star = much below average.
Pneumococcal Vaccine Info Percent of short-stay residents assessed and appropriately given the pneumococcal vaccine 100.0%
11% better than Texas average

Texas average: 90.4%

Antipsychotic medication increase Info Percent of short-stay residents who newly received an antipsychotic medication 1.5%
In line with Texas average

Texas average: 1.4%

Influenza Vaccine Info Percent of short-stay residents assessed and appropriately given the seasonal influenza vaccine 97.2%
10% better than Texas average

Texas average: 88.0%

Re-hospitalized after SNF stay Info Percentage of short-stay residents who were re-hospitalized after their nursing home admission. 23.4%
10% better than Texas average

Texas average: 25.9%

Emergency department visits Info Percentage of short-stay residents who had an outpatient emergency department visit. 11.9%
In line with Texas average

Texas average: 12.0%

Falls with major injury Info Percentage of SNF residents who experience falls with major injury during their stay. 0.7%
8% better than Texas average

Texas average: 0.8%

Ability to care for self at discharge Info Percentage of residents at or above expected ability to care for themselves at discharge. 60.5%
13% better than Texas average

Texas average: 53.7%

Successful return to home or community Info Rate of successful return to home or community from a skilled nursing facility. 48.1%
5% worse than Texas average

Texas average: 50.6%

Penalties and fines

Federal penalties imposed by CMS for regulatory violations, including civil money penalties (fines) and denials of payment for new Medicare/Medicaid admissions.

Source: CMS Penalties Database (Data as of Jan 2026)

Total fines amount $8K
90% lower than Texas average

Texas average: $80K

Number of fines 1
60% fewer fines than Texas average

Texas average: 2.5

Payment Denials Info Serious action where Medicare and/or Medicaid temporarily stops payments for new residents until issues are fixed. 0
100% fewer payment denials than Texas average

Texas average: 0.2

Fines amount comparison
This facility $8K
Texas average $80K
Penalty History

Penalties are imposed by CMS for violations of federal nursing home regulations.

Civil Money Penalty Info Fines imposed for noncompliance, which can be assessed per day or per instance of violation. Apr 16, 2025
$8K

Last updated: Jan 2026

Guides for Better Senior Living

Care Cost Calculator: See Prices in Your Area

Nursing Home Data Explorer

Don’t Wait Too Long: 7 Red Flag Signs Your Parent Needs Assisted Living Now

The True Cost of Assisted Living in 2025 – And How Families Are Paying For It

Understanding Senior Living Costs: Pricing Models, Discounts & Financial Assistance

Financial Aid for Texas Seniors

Get financial aid guidance

Community Care for the Aged and Disabled (CCAD)

TX Medicaid CCAD

Age 65+ or disabled, Texas resident, Medicaid-eligible, care need (not always nursing home level).

~$2,829/month (300% FBR, individual).

$2,000 (individual), $3,000 (couple).

Large state; rural access challenges.

Texas Community Care Services

TX CCS

Age 60+, Texas resident, at risk of decline.

~$2,000/month (individual, varies).

$5,000 (individual).

Limited funding; high demand in urban areas.

Area Agency on Aging (AAA) Services

Texas AAA Services

Age 60+, TX resident; no income/asset limits.

None; donations encouraged.

Not assessed.

28 AAAs; includes Meals on Wheels in some areas.

Medicare Savings Program (MSP)

Texas Medicare Savings Program

Age 65+ or disabled, TX resident, Medicare Part A/B.

~$2,510/month (QMB), ~$3,380/month (SLMB), ~$3,598/month (QI)—individual.

$9,430 (individual), $14,130 (couple).

Includes Extra Help for Part D; no waitlist.

Low-Income Home Energy Assistance Program (LIHEAP)

Texas Comprehensive Energy Assistance Program (CEAP)

Age 60+ prioritized, TX resident, low-income.

~$3,970/month (185% FPL).

Not assessed.

Priority for elderly/disabled; covers gas, electric, propane.

Family Caregiver Support Program (FCSP)

Texas Family Caregiver Support Program

Caregivers of 60+ needing care or 55+ caregivers of others; TX resident; 2+ ADLs.

No strict cap; prioritizes low-income (~$24,980/year).

Not assessed.

High rural demand; includes grandparent caregivers.

Senior Community Service Employment Program (SCSEP)

Texas SCSEP

Age 55+, unemployed, low-income, TX resident.

~$1,983/month (125% FPL).

Not specified.

Priority for veterans, rural residents; AARP partnership.

VA Aid and Attendance (A&A) and Housebound Benefits

Texas VA Aid and Attendance/Housebound

Age 65+ or disabled veteran/spouse, TX resident, wartime service, ADL help (A&A) or homebound.

Net income < ~$1,984/month (veteran with dependent, A&A); pension offsets income.

~$155,356 (net worth).

High veteran population; supports rural/urban needs.

Property Tax Exemption for Seniors

Texas Senior Property Tax Exemption

Age 65+, TX resident, homeowner (homestead).

None; tax-based eligibility.

Not assessed.

$25,000+ exemption; optional freeze in some counties; saves ~$500-$1,000/year.

Senior Farmers’ Market Nutrition Program (SFMNP)

Texas SFMNP

Age 60+, TX resident, low-income.

~$2,322/month (185% FPL).

Not assessed.

Vouchers (~$50/season); serves ~20,000 via 28 AAAs.