


Total staff
78
Employees
77
Contractors
1
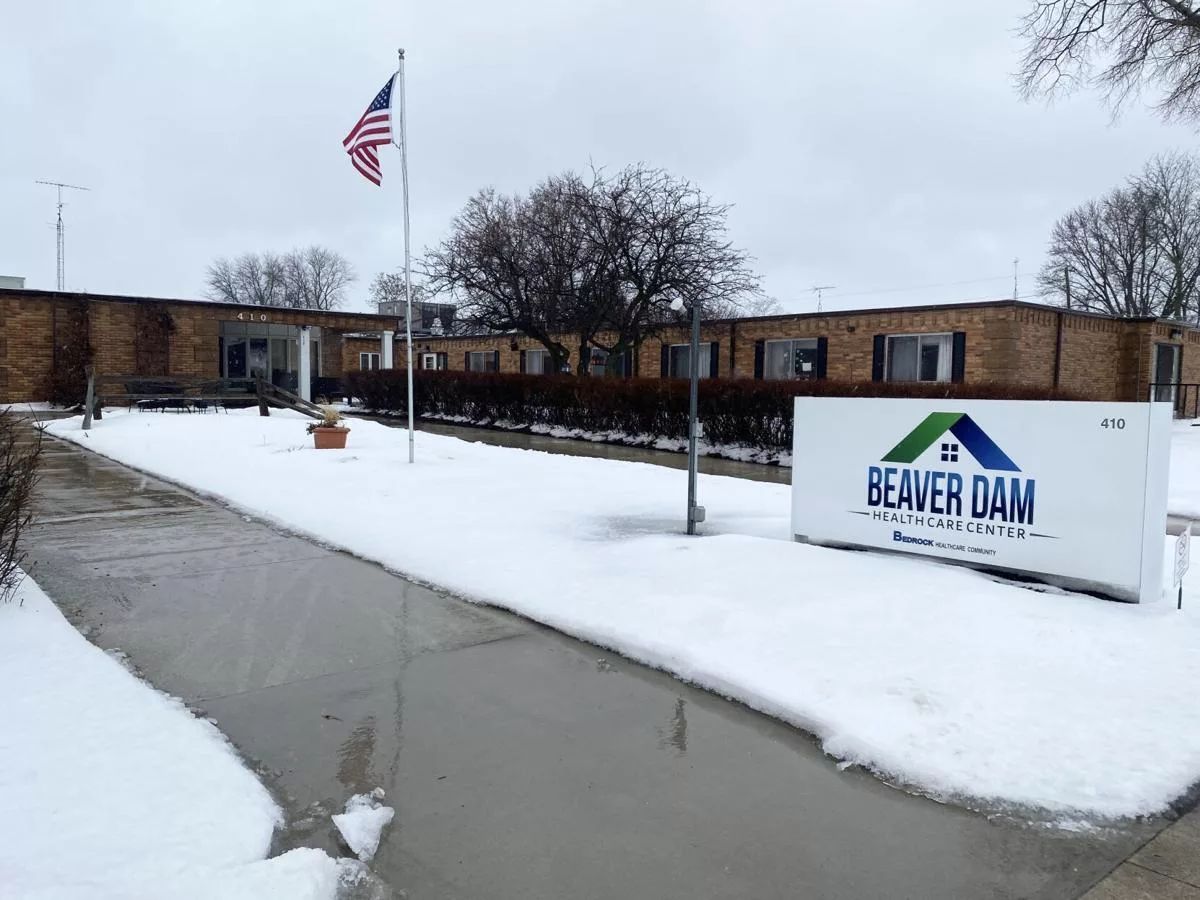


Beaver Dam Health Care Center, found amidst the vibrant Wisconsin, emerges as a close-knit community with 90 beds, radiating a warm and familiar atmosphere. As a proud member of Bedrock Healthcare, their commitment to clinical excellence is evident. They specialize in catering to complex healthcare needs, offering long-term nursing and dementia care services. With Medicare certification and Medicaid assistance, they provide comprehensive post-operative care, wound care, and rehabilitative therapy, offering invaluable support to numerous families and seniors.
Their specialist programming, encompassing pulmonary, orthopedic, cardiac care, and more, ensures that residents receive top-notch attention. Amidst the comforting ambiance, this Medicare nursing home stands as a source of support, offering a secure and supportive environment for long-term care, making it a standout choice in the field of senior healthcare facilities.
| Staff type | Hours / Day / Resident | vs state avg |
|---|---|---|
|
Registered Nurse (RN)
| 28m per day | ▼ 51% State avg: 58m per day · National avg: 41m per day |
|
LPN / LVN
| 31m per day | ▼ 20% State avg: 38m per day · National avg: 52m per day |
|
Nurse Aide
| 1h 52m per day | ▼ 28% State avg: 2h 35m per day · National avg: 2h 21m per day |
|
Weekend Total Nursing
| 2h 30m per day | ▼ 33% State avg: 3h 43m per day · National avg: 3h 26m per day |
|
Physical Therapist
| 0m per day | ▼ 100% State avg: 4m per day · National avg: 4m per day |
|
Weekend RN
| 19m per day | ▼ 51% State avg: 39m per day · National avg: 29m per day |
Reporting period: October 1 – December 31, 2025 (Q4 2025). Source: CMS Payroll-Based Journal report.
Manages medical care and health needs.
Assists with medical care and medications.
Helps with daily care and mobility.
| Certified Nursing Assistant | 47 | 0 | 47 | 11,214 | 92 | 100% | 7.7 |
| Licensed Practical Nurse | 8 | 0 | 8 | 3,302 | 92 | 100% | 10 |
| Registered Nurse | 7 | 0 | 7 | 2,196 | 91 | 99% | 8.1 |
| Medication Aide/Technician | 5 | 0 | 5 | 876 | 74 | 80% | 7.6 |
| Administrator | 2 | 0 | 2 | 688 | 43 | 47% | 8 |
| Clinical Nurse Specialist | 2 | 0 | 2 | 593 | 57 | 62% | 7.9 |
| Physical Therapist | 1 | 0 | 1 | 440 | 56 | 61% | 7.9 |
| Occupational Therapy Aide | 1 | 0 | 1 | 344 | 43 | 47% | 8 |
| Nurse Practitioner | 1 | 0 | 1 | 264 | 33 | 36% | 8 |
| Mental Health Service Worker | 1 | 0 | 1 | 248 | 31 | 34% | 8 |
| Medical Director | 1 | 0 | 1 | 15 | 3 | 3% | 4.8 |
| Occupational Therapy Assistant | 0 | 1 | 1 | 10 | 2 | 2% | 4.8 |
| Respiratory Therapy Technician | 1 | 0 | 1 | 1 | 1 | 1% | 1 |
Includes penalties issued in 2023-2025
Federal penalties imposed by CMS for regulatory violations, including civil money penalties (fines) and denials of payment for new Medicare/Medicaid admissions.
Source: CMS Penalties Database (Data as of Jan 2026)
Wisconsin average: $95K
Wisconsin average: 2.1
Wisconsin average: 0.7
Penalties are imposed by CMS for violations of federal nursing home regulations.
5 penalties in the past 3 years
Multiple penalties were reported in the last 3 years.
Last updated: Jan 2026
These measures show how residents usually do over time at this home, based on health outcomes and preventive care.
Wisconsin average: 10.5
Wisconsin average: 22.1
Wisconsin average: 17.6%
Wisconsin average: 22.8%
Wisconsin average: 26.0%
Wisconsin average: 3.2%
Wisconsin average: 5.4%
Wisconsin average: 3.2%
Wisconsin average: 4.9%
Wisconsin average: 5.0%
Wisconsin average: 16.1%
Wisconsin average: 95.9%
Wisconsin average: 95.0%
Wisconsin average: 87.3%
Wisconsin average: 1.2%
Wisconsin average: 82.2%
Wisconsin average: 22.7%
Wisconsin average: 15.0%
Wisconsin average: 0.8%
Wisconsin average: 53.7%
Wisconsin average: 50.6%
Quality measures are calculated from Minimum Data Set (MDS) assessments. For most measures, lower percentages indicate better care quality.
24% of new residents, usually for short-term rehab.
64% of new residents, often for short stays.
12% of new residents, often for long-term daily care.
Source: CMS Long-Term Care Facility Characteristics (Data as of Jan 2026)
Residents meet regularly to discuss policies, care quality, and activities
Organized group of residents that meets regularly to discuss facility policies, quality of life, and activities.
Data sourced from CMS Long-Term Care Facility Characteristics quarterly report. Payer mix reflects the current resident census by primary payment source.
Historical financial and operational data for Beaver Dam Health Care Center from 2011–2023, based on CMS SNF Cost Reports.
Key figures below are for fiscal year ending in 12/2023.
Based on CMS SNF Cost Report for fiscal year ending in 12/2023.
Residents typically stay for brief periods, with frequent admissions and discharges throughout the year.
Most new residents arrive under private pay (64% of admissions), and a typical private pay stay runs around 2 - 3 months.
Coverage residents most often arrive under.
Coverage residents most often leave under.
![]() 1.4 miles from city center
1.4 miles from city center
![]() Estimated distance in miles from Beaver Dam's city center to Beaver Dam Health Care Center's address, calculated via Google Maps.
Estimated distance in miles from Beaver Dam's city center to Beaver Dam Health Care Center's address, calculated via Google Maps.
Add your location
Beaver Dam Health Care Center is located in Beaver Dam, Wisconsin.
Here are the financial assistance programs available to residents in Wisconsin.
Beaver Dam Health Care Center has a walk score of 35. Somewhat walkable. A few nearby services may be reachable on foot, but most trips require transportation.
Beaver Dam Health Care Center's occupancy is 78.5%.
No, Beaver Dam Health Care Center has a no-pet policy.
Beaver Dam Health Care Center is registered as a for-profit.
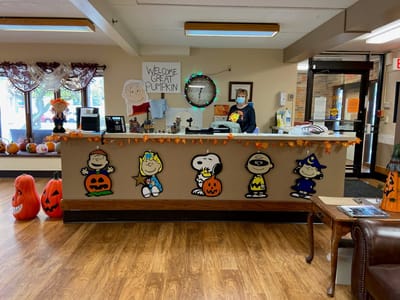
Yes — there are 4 photos of Beaver Dam Health Care Center in the photo gallery on this page.
Beaver Dam Health Care Center is located at 410 Roedl Ct, Beaver Dam, WI 53916.
(920) 887-7191 will put you in contact with the team at Beaver Dam Health Care Center.
Care Cost Calculator: See Prices in Your Area
Nursing Home Data Explorer
Don’t Wait Too Long: 7 Red Flag Signs Your Parent Needs Assisted Living Now
The True Cost of Assisted Living in 2025 – And How Families Are Paying For It
Understanding Senior Living Costs: Pricing Models, Discounts & Financial Assistance


