Explore Open Rooms

1 Contact details
2 What type of senior care service are you looking for?
3 What budget do you have in mind for senior care?
4 How soon do you need to find care?
5 Additional details

Thank you for your interest!

Our team will be in touch shortly to help with next steps.

Independent Living Home

Bedford Court

Independent Living Home

Bedford Court

3701 International Dr, Silver Spring, MD 20906 View map
Overview of Bedford Court

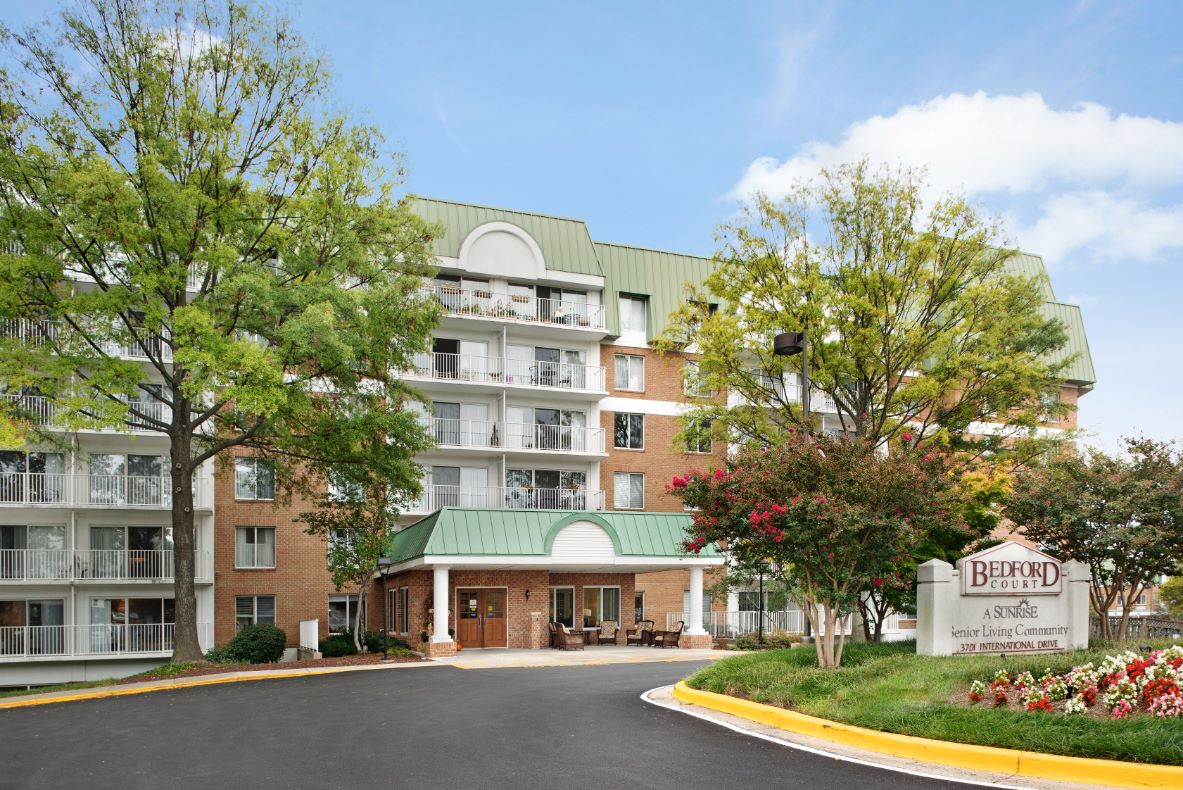
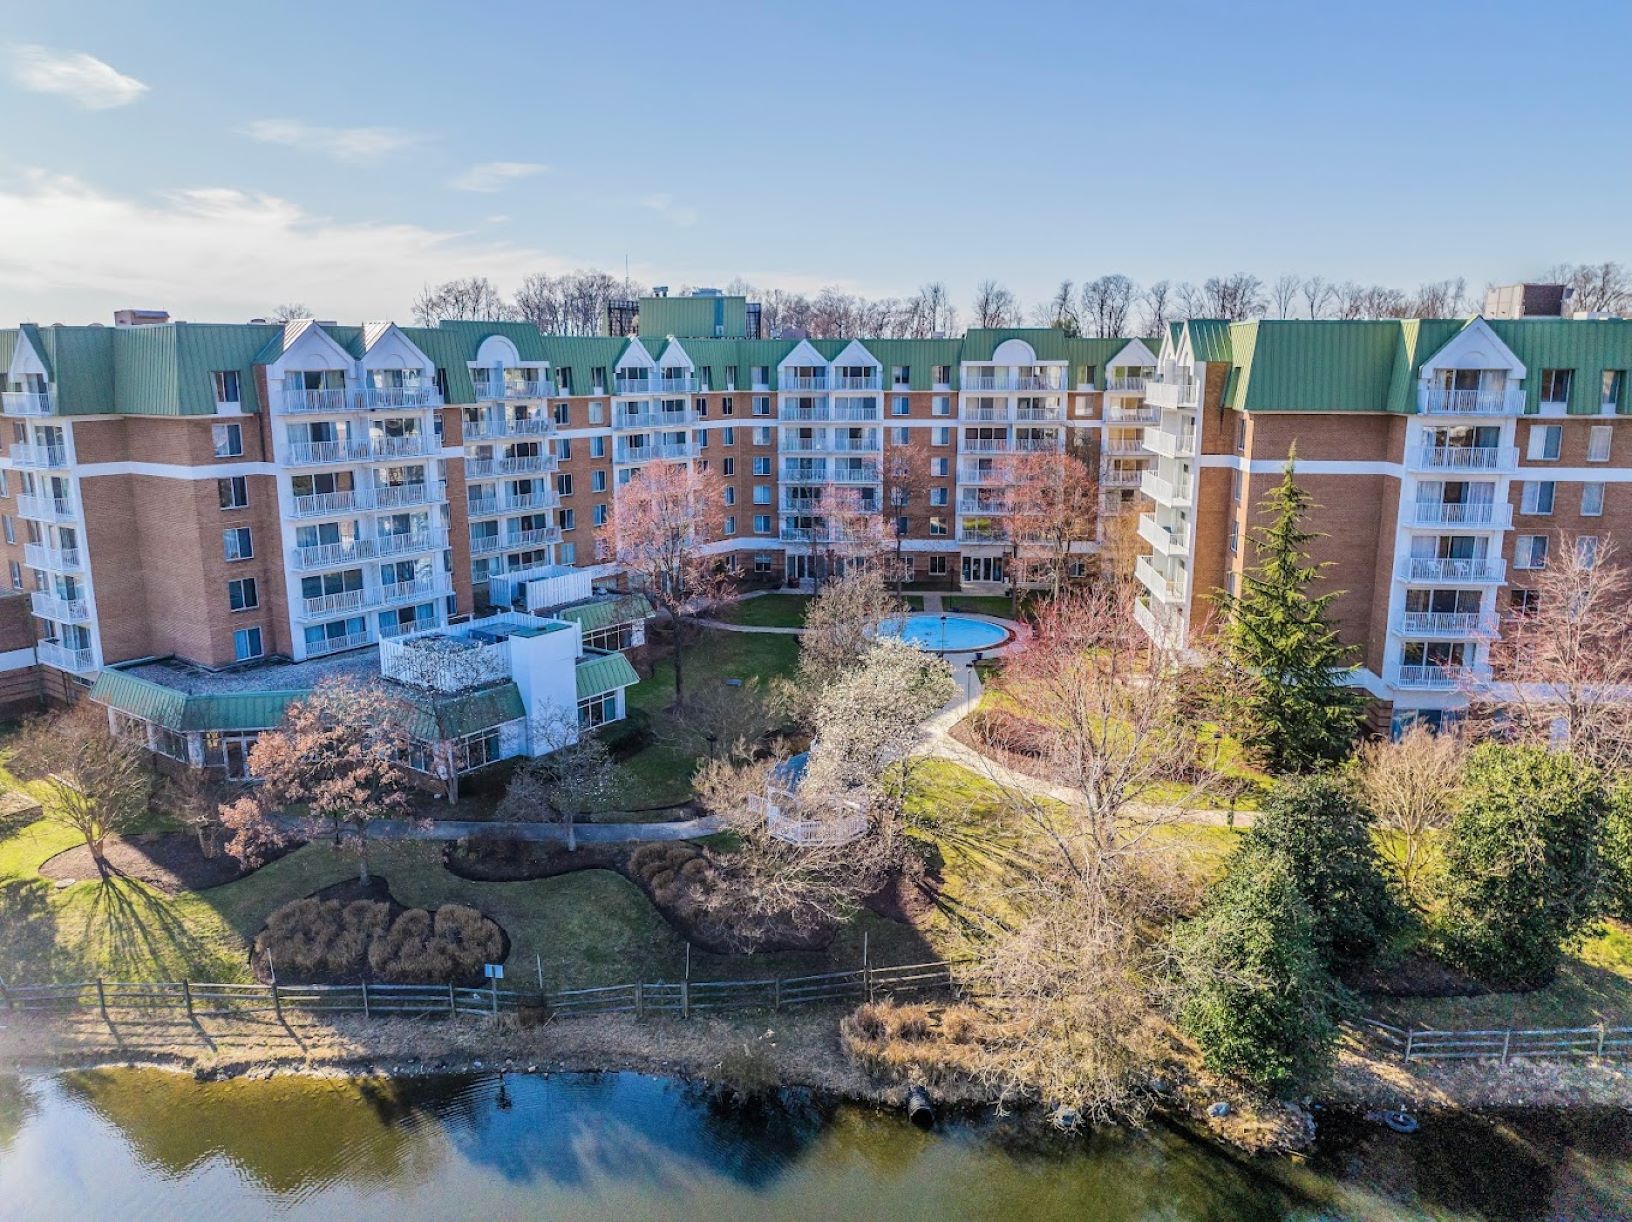
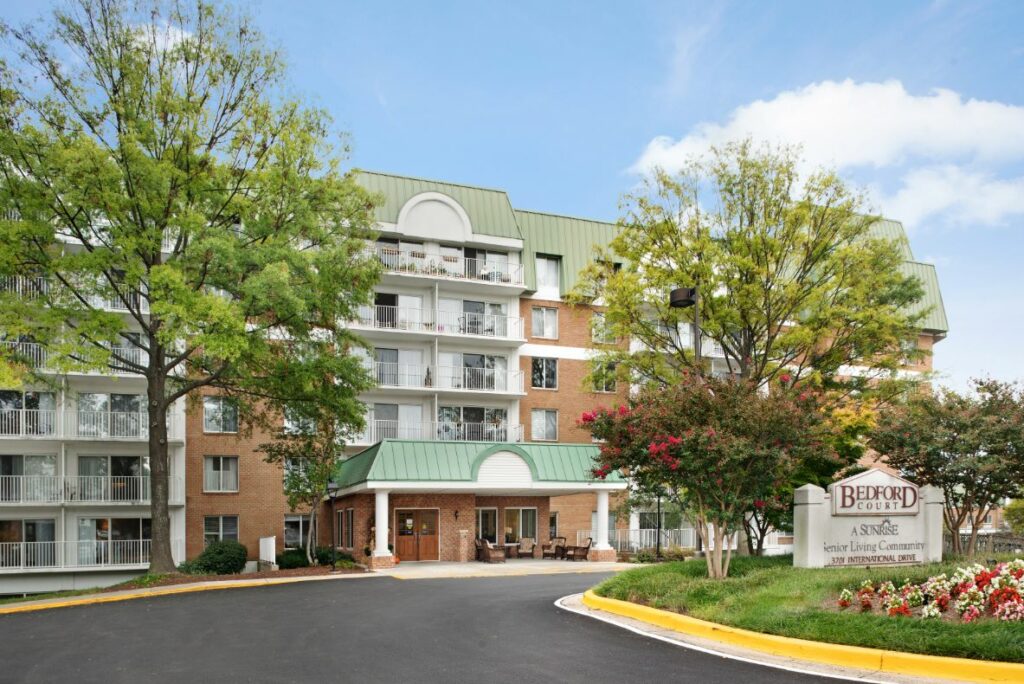
Live a vibrant retirement life with Bedford Court, a blissful senior living community in the serene and beautiful neighborhood of Silver Spring, MD, that strives to provide a welcoming environment filled with warmth and outgoing residents. Here, residents are offered with an active independent living and assisted living lifestyle, as well as skilled nursing and rehabilitation services for those who require assistance in their recovery process. The community provides an array of convenient services, including assistance with daily living activities, medication management, personal care support, and more.

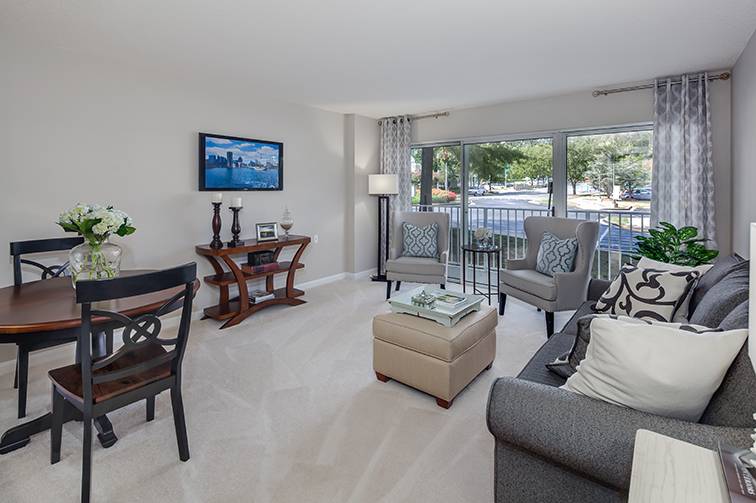
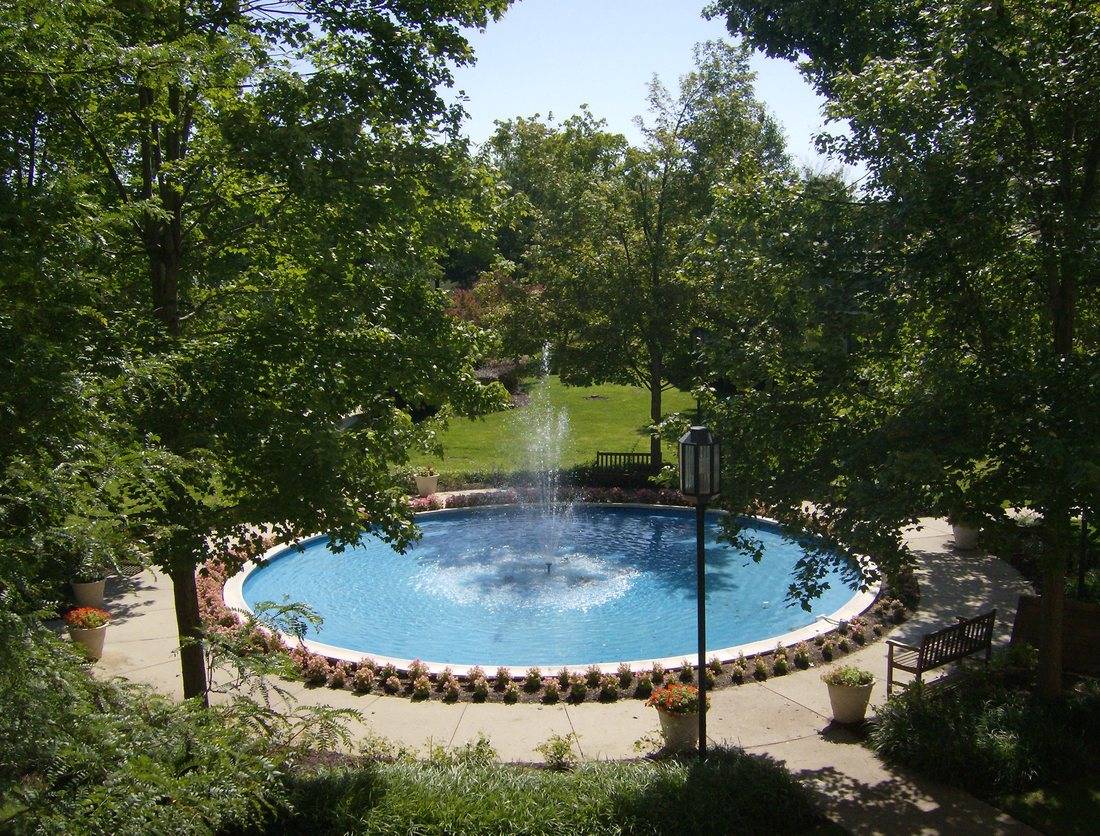
Various conveniences, such as housekeeping, maintenance and concierge services are offered for a maintenance-free living experience. Residents can prepare their own meals or enjoy the community’s restaurant-style dining experience with a great selection of delicately prepared meals served in an elegant dining area. A multitude of hotel-like amenities, such as fitness center, spa, gazebo, activity rooms, a bistro, salon, sun room, and beautiful outdoor spaces are offered to make residents’ living experience more enjoyable.

(440) 232-3420

Quality ratings

Measured by Centers for Medicare & Medicaid Services (CMS)

Overall rating Info The Overall CMS Rating combines results from health inspections, staffing levels and quality measures. Health inspections carry the most weight. Staffing and quality scores can increase or decrease the final rating based on performance compared to state and national standards.
5/5
Maryland average: 3.4/5
Health Inspection Info Based on the results of the facility's three most recent standard inspections and any complaint investigations. CMS reviews the number, scope, and severity of deficiencies, with more recent findings weighted more heavily.
4/5
Maryland average: 3.2/5
Staffing Info Measures average nursing staff hours per resident per day, including Registered Nurses (RNs) and total nursing staff. Ratings are adjusted based on the level of care residents require and are compared to state and national benchmarks.
4/5
Maryland average: 3.5/5
Quality Measures Info Based on clinical and physical health indicators reported to CMS, such as hospital readmissions, falls, pressure ulcers, and improvements in mobility. These measures reflect how well residents' health needs are being managed.
5/5
Maryland average: 3.7/5

Nursing care per resident

Info This shows how many total hours of nursing staff time are available per resident each day. Higher numbers usually mean more staff support.
4h 48m per day

This home provides 12% more nursing time per resident than the Maryland average.

Maryland average: 4h 17m per day

Capacity and availability

Smaller home

May offer a more intimate, personalized care environment.

Total beds 76

This home usually has availability

Lower occupancy suggests more openings may be available.

Lower demand than the Maryland average
Occupancy rate 76.5%
Residents per day (avg) 41
Occupancy rate
76.5%
Residents per day (avg)
41

Who this home usually serves

TYPE OF STAY

Mostly short-term rehab stays

Most residents typically stay for a few weeks or months before returning home or moving on.

Might be optimal for
Short stays Recovery Medicare-covered care

Breakdown by payment type

Medicare

90% of new residents, usually for short-term rehab.

Typical stay 27 days

Private pay

6% of new residents, often for short stays.

Typical stay 15 - 16 years

Medicaid

4% of new residents, often for long-term daily care.

Typical stay 2 years

Finances and operations

Privately-owned community
Operated by a business corporation.
Home revenue
$26.5M
Profit
$145.7K
Privately-owned community Operated by a business corporation.
Home revenue
$26,475,268.00
Profit
$145,671.00
Payroll costs Info The portion of the home's budget spent on staff, including nurses, caregivers, and other employees who support care and operations.
$8.7M
33% of revenue
Other operating costs Info All remaining costs needed to run the home, such as food, utilities, building maintenance, supplies and administrative expenses.
$17.6M
Total costs $26.3M
Bed community size
76-bed community
A larger shared setting that may offer more common spaces and organized community services.
Years in operation
34 years in operation
A longer operating history, which may indicate experience navigating regulations and delivering ongoing care.
Walk Score
Walk Score: 66 / 100
Moderately walkable. Some errands can be accomplished on foot, with a mix of nearby amenities.

Services

24-hour Awake Staff
Alzheimer's Care
Barber Services
Beauty Services
Behavioral Management
Catheter Care
Colostomy Care
Decubitus Care

About this community

Occupancy

Occupancy rate
77%
28% higher than Maryland average

Maryland average: 60%

Occupied beds
58 / 76
Average residents 104 per day

License details

County: Montgomery

Ownership & operating entity

Bedford Court is legally operated by Welltower CCRC Group.

Profit status: true

Room costs

Private Room $300 - $322 per day
Semi-Private Room $150 - $279 per day

Hospice Affiliations

Jewish Social Service Agency Hospice
Montgomery Hospice & Prince George's Hospice

Staffing

Key information about the people who lead and staff this community.

Leadership

CNA Training Program

Care Services

Mild Alzheimer's Level
Moderate Alzheimer's Level
Severe Alzheimer's Level
Nursing Services
Rehabilitation Services
Respite Care
Memory Care
Independent Living
Skilled Nursing
24-Hour Staffing

Additional Policies & Features

Continuing Care Retirement Community (CCRC)

Amenities & Lifestyle

Dining
Social Events
Fitness Classes
Outdoor Spaces

Programs & Activities

Specific Programs
Independent Living, Assisted Living, Memory Care, Skilled Nursing
Operating Hours
Mon-Sun 00:00 - 23:59

Pricing & Financial Information

Starting Price$3,772

Dining & Nutrition

Food Description
Cuisine crafted by a talented culinary team with fresh, seasonal dishes.

What does this home offer?

Pets allowed icon
Pets allowed icon

Pets Allowed: Yes, Pets Allowed

Housing options icon

Housing Options: Studio / 1 Bed / 2 Bed

Building type icon
Building type icon

Building Type: Mid-rise

Transportation services icon

Transportation Services

Fitness and recreation icon

Fitness and Recreation

Types of Care at Bedford Court

Independent Living Assisted Living
Contact Bedford Court

Demographics

Resident demographic information for this facility.

Gender

  • Female 85.5%
  • Male 14.5%

Age Distribution

  • 85-94 64.5%
  • 95+ 25.8%
  • 75-84 8.1%
  • 65-74 1.6%

Ethnicity

  • White 95.2%
  • African American 3.2%
  • Asian 1.6%

Health Inspection History

Inspections
Total health inspections 3

Maryland average 3.9


Last Health inspection on Dec 2024

Total health citations 23

Maryland average 49.9

Citations per inspection
7.67

Maryland average 12.81


Health citations are formal notices following inspections when they fail to comply with safety and care standards.

20 of 23 citations resulted from standard inspections; 2 of 23 resulted from complaint investigations; and 1 of 23 came from combined inspections (standard and complaint).

Breakdown of citation severity (last 3 years)
Critical Health citations More info 0
100% better than Maryland average

Maryland average: 0.5


Serious Health citations More info 0
100% better than Maryland average

Maryland average: 0.6

0 critical citations More info Maryland average: 0.5

0 serious citations More info Maryland average: 0.6

22 moderate citations More info Maryland average: 47.2

1 minor citation More info Maryland average: 1.7
Citations history (last 3 years)
Administration moderate citation Info Issues related to how the facility is managed, including policies, procedures, and compliance with regulations. Dec 12, 2024
Corrected

Environmental moderate citation Info Issues related to building safety, cleanliness, maintenance, and overall living conditions. Dec 12, 2024
Corrected

Nutrition moderate citation Info Issues related to food quality, meal service, and resident's nutritional needs. Dec 12, 2024
Corrected

Nutrition moderate citation Info Issues related to food quality, meal service, and resident's nutritional needs. Dec 12, 2024
Corrected

Compare Independent Living around Silver Spring The information below is reported by the Maryland Department of Health, Office of Health Care Quality.

Bedford Court
AL

Assisted Living A licensed, long-term care setting for seniors or individuals with disabilities who need help with daily activities — like bathing, dressing, and medication management — but not 24-hour skilled nursing. Offers housing, meals, and around-the-clock support while aiming to maximize resident independence.

IL

Independent Living Lifestyle-focused communities for older adults offering dining, activities, and transportation with minimal personal care. Best for active, independent seniors who want community without medical support.

MC

Memory Care Secured, specialized care for people living with Alzheimer's or dementia. Staff trained in cognitive impairment, with higher staff-to-resident ratios and an environment designed to reduce confusion and wandering risk.

NH

Nursing Home Licensed facility providing 24/7 skilled nursing care for residents with complex, ongoing medical needs. Staffed by RNs, LPNs, and CNAs. Inspected and star-rated annually by CMS. Accepts Medicare (short-term rehab) and Medicaid (long-term care).

Silver Spring
354
Yes
66
Studio / 1 Bed / 2 Bed
Wilshire Estates Gracious Retirement Community
IL

Independent Living Lifestyle-focused communities for older adults offering dining, activities, and transportation with minimal personal care. Best for active, independent seniors who want community without medical support.

Silver Spring
-
No
47
Studio / 1 Bed / 2 Bed
Seabury at Springvale Terrace
AL

Assisted Living A licensed, long-term care setting for seniors or individuals with disabilities who need help with daily activities — like bathing, dressing, and medication management — but not 24-hour skilled nursing. Offers housing, meals, and around-the-clock support while aiming to maximize resident independence.

IL

Independent Living Lifestyle-focused communities for older adults offering dining, activities, and transportation with minimal personal care. Best for active, independent seniors who want community without medical support.

Silver Spring
-
Yes
92
Studio / 1 Bed / 2 Bed
Victory Forest
IL

Independent Living Lifestyle-focused communities for older adults offering dining, activities, and transportation with minimal personal care. Best for active, independent seniors who want community without medical support.

Silver Spring (Forest Glen)
-
Yes
33
Studio / 1 Bed / 2 Bed

Places of interest near Bedford Court

Address 8.9 miles from city center — 6.7 miles to nearest hospital (Adventist HealthCare Shady Grove Medical Center)

Address 3701 International Dr, Silver Spring, MD 20906

Calculate Travel Distance to Bedford Court

Add your location

Address

Staffing Data (Q2 2025)

This data corresponds to Q2 2025 and is based on CMS Payroll-Based Journal.

Total staff 81
Employees 57
Contractors 24
Staff to resident ratio 1.84:1
0% compared with Maryland average

Maryland average ratio: 1.81:1

Avg staff/day 33
Average shift 6.8 hours
15% worse than Maryland average

Maryland average: 8 hours

Total staff hours (quarter) 20,523
Nursing staff breakdown
Registered Nurse

Manages medical care and health needs.

Total count 10
Average shift length Info Average shift length. Calculated as total hours divided by days worked and average staff per day. 6.9 hours

No contractors work on this role.

Licensed Practical Nurse

Assists with medical care and medications.

Total count 14
Average shift length Info Average shift length. Calculated as total hours divided by days worked and average staff per day. 7.7 hours

No contractors work on this role.

Certified Nursing Assistant

Helps with daily care and mobility.

Total count 24
Average shift length Info Average shift length. Calculated as total hours divided by days worked and average staff per day. 7.6 hours

No contractors work on this role.

Contractor staffing

Total hours from contractors

13.9%

2,851 contractor hours this quarter

Physical Therapy Assistant: 7 Respiratory Therapy Technician: 4 Physical Therapy Aide: 3 Administrator: 3 Qualified Social Worker: 2 Occupational Therapy Aide: 2 Speech Language Pathologist: 2 Medical Director: 1
Staff by category
Certified Nursing Assistant240249,24891100%7.6
Licensed Practical Nurse140144,86491100%7.7
Registered Nurse100101,6838998%6.9
Nurse Practitioner2029046774%8
Respiratory Therapy Technician0448027886%4.5
Physical Therapy Aide0336996875%7
Physical Therapy Assistant0774947684%5
Mental Health Service Worker1014636066%7.7
Administrator0334285156%8.4
Dietitian1013374448%7.7
Occupational Therapy Aide0222357886%1.9
Medication Aide/Technician5051741112%6.4
Qualified Social Worker0221214246%2.8
Speech Language Pathologist022562123%2.5
Medical Director0111567%2.5
24 Certified Nursing Assistant
% of Days 100%
14 Licensed Practical Nurse
% of Days 100%
10 Registered Nurse
% of Days 98%
2 Nurse Practitioner
% of Days 74%
4 Respiratory Therapy Technician
% of Days 86%
3 Physical Therapy Aide
% of Days 75%
7 Physical Therapy Assistant
% of Days 84%
1 Mental Health Service Worker
% of Days 66%
3 Administrator
% of Days 56%
1 Dietitian
% of Days 48%
2 Occupational Therapy Aide
% of Days 86%
5 Medication Aide/Technician
% of Days 12%
2 Qualified Social Worker
% of Days 46%
2 Speech Language Pathologist
% of Days 23%
1 Medical Director
% of Days 7%

Facility Characteristics

Source: CMS Long-Term Care Facility Characteristics (Data as of Jan 2026)

Total census
44 residents
Residents by payment source
Medicare
15 residents (34.1%)
Medicaid
21 residents (47.7%)
Private pay or other
8 residents (18.2%)
Programs & Services
CCRC

Part of a Continuing Care Retirement Community offering multiple care levels

Quality of care over time

These measures show how residents usually do over time at this home, based on health outcomes and preventive care.

High-risk clinical events score Info A composite score based on pressure ulcers, falls with injury, weight loss, walking ability decline, and activities of daily living decline. 8.1
38% better than Maryland average

Maryland average: 12.9

Functional decline score Info A composite score based on activities of daily living decline, walking ability decline, and incontinence. 22.0
15% better than Maryland average

Maryland average: 25.7

Long-stay resident measures
Need for Help with Daily Activities Increased Info Percent of long-stay residents whose need for help with daily activities has increased 17.8%
25% better than Maryland average

Maryland average: 23.7%

Low Risk Residents with Bowel/Bladder Incontinence Info Percent of low risk long-stay residents who lose control of their bowels or bladder 26.1%
In line with Maryland average

Maryland average: 25.9%

Falls with Major Injury Info Percent of long-stay residents experiencing one or more falls with major injury 0.9%
59% better than Maryland average

Maryland average: 2.3%

High Risk Residents with Pressure Ulcers Info Percent of long-stay high risk residents with pressure ulcers 7.2%
11% worse than Maryland average

Maryland average: 6.5%

Urinary Tract Infection Info Percent of long-stay residents with a urinary tract infection 1.0%
39% better than Maryland average

Maryland average: 1.6%

Lost Too Much Weight Info Percent of long-stay residents who lose too much weight 6.3%
8% worse than Maryland average

Maryland average: 5.8%

Depressive Symptoms Info Percent of long-stay residents who have depressive symptoms 0.0%
100% better than Maryland average

Maryland average: 20.2%

Antipsychotic Use Info Percent of long-stay residents who received an antipsychotic medication 13.0%
In line with Maryland average

Maryland average: 12.9%

Pneumococcal Vaccine Info Percent of long-stay residents assessed and appropriately given the pneumococcal vaccine 82.4%
10% worse than Maryland average

Maryland average: 92.0%

Influenza Vaccine Info Percent of long-stay residents assessed and appropriately given the seasonal influenza vaccine 89.7%
7% worse than Maryland average

Maryland average: 96.6%

Short-stay resident measures
Pneumococcal Vaccine Info Percent of short-stay residents assessed and appropriately given the pneumococcal vaccine 78.8%
In line with Maryland average

Maryland average: 78.4%

Antipsychotic medication increase Info Percent of short-stay residents who newly received an antipsychotic medication 0.0%
100% better than Maryland average

Maryland average: 1.4%

Influenza Vaccine Info Percent of short-stay residents assessed and appropriately given the seasonal influenza vaccine 84.3%
5% better than Maryland average

Maryland average: 80.6%

Guides for Better Senior Living

Care Cost Calculator: See Prices in Your Area

Nursing Home Data Explorer

Don’t Wait Too Long: 7 Red Flag Signs Your Parent Needs Assisted Living Now

The True Cost of Assisted Living in 2025 – And How Families Are Paying For It

Understanding Senior Living Costs: Pricing Models, Discounts & Financial Assistance

Financial Aid for Maryland Seniors

Get financial aid guidance

Community Options Waiver

Maryland Medicaid Community Options Waiver

Age 65+ or disabled, Maryland resident, Medicaid- eligible, nursing home-level care need.

~$2,829/month (300% FBR, individual).

$2,000 (individual), $3,000 (couple) (excludes home, car).

High urban demand; rural outreach efforts.

Senior Care Program

Maryland Senior Care

Age 65+, Maryland resident, at risk of nursing home placement.

~$2,000/month (individual, varies by county).

$11,000 (individual).

Limited funding; waitlists common in high-demand areas.

Maryland Nursing Home Medicaid

Maryland Medical Assistance (Medicaid) Nursing Home Program

Age 65+, Maryland resident, Medicaid-eligible, requires nursing home-level care.

$943/month (individual); most income applied to care costs.

$2,500 (individual), $3,000 (couple); spousal protections up to $155,356.

Home equity limit $636,000; estate recovery applies post-55.

Senior Assisted Living Subsidy Program

Maryland Senior Assisted Living Group Home Subsidy

Age 62+, Maryland resident, in or moving to approved assisted living, low/moderate income.

~$34,000/year (individual, varies by county).

Not strict; prioritizes low-income.

Not available statewide; facility must be licensed by MDH.

Veterans Aid and Attendance (A&A) Benefit

Maryland VA Aid and Attendance

Wartime veteran/spouse, age 65+ or disabled, needs ADL help, Maryland resident.

Net income minus medical expenses < $1,984/month (individual with A&A).

$155,356 (net worth limit).

High veteran population in suburban/rural areas.

Senior Prescription Drug Assistance Program (SPDAP)

Maryland Senior Prescription Drug Assistance Program

Age 65+, Maryland resident (6+ months), Medicare Part D enrolled.

$48,560/year (individual, 300% FPL).

None specified.

Supplements Medicare Part D; annual enrollment required.

Medicare Savings Programs (MSP)

Maryland Medicare Savings Programs

Age 65+, Maryland resident, Medicare Part A/B enrollee.

$2,014/month (QMB), $2,706/month (SLMB/QI, individual).

$9,090 (individual), $13,630 (couple).

Includes QMB, SLMB, QI categories.

Community Personal Assistance Services (CPAS)

Maryland Medicaid Community Personal Assistance Services

Age 65+, Maryland resident, Medicaid-eligible, needs ADL assistance.

$943/month (individual); spend-down available.

$2,500 (individual), $3,000 (couple).

Consumer-directed option allows hiring family caregivers.

Tour Icon
Planning a tour? Check our touring checklist.
Chat Icon
Thinking of living here? We can help you speak to a current resident