


Victory Forest
Assisted Living & Independent Living · Silver Spring, MD

Victory Forest
Assisted Living & Independent Living · Silver Spring, MD
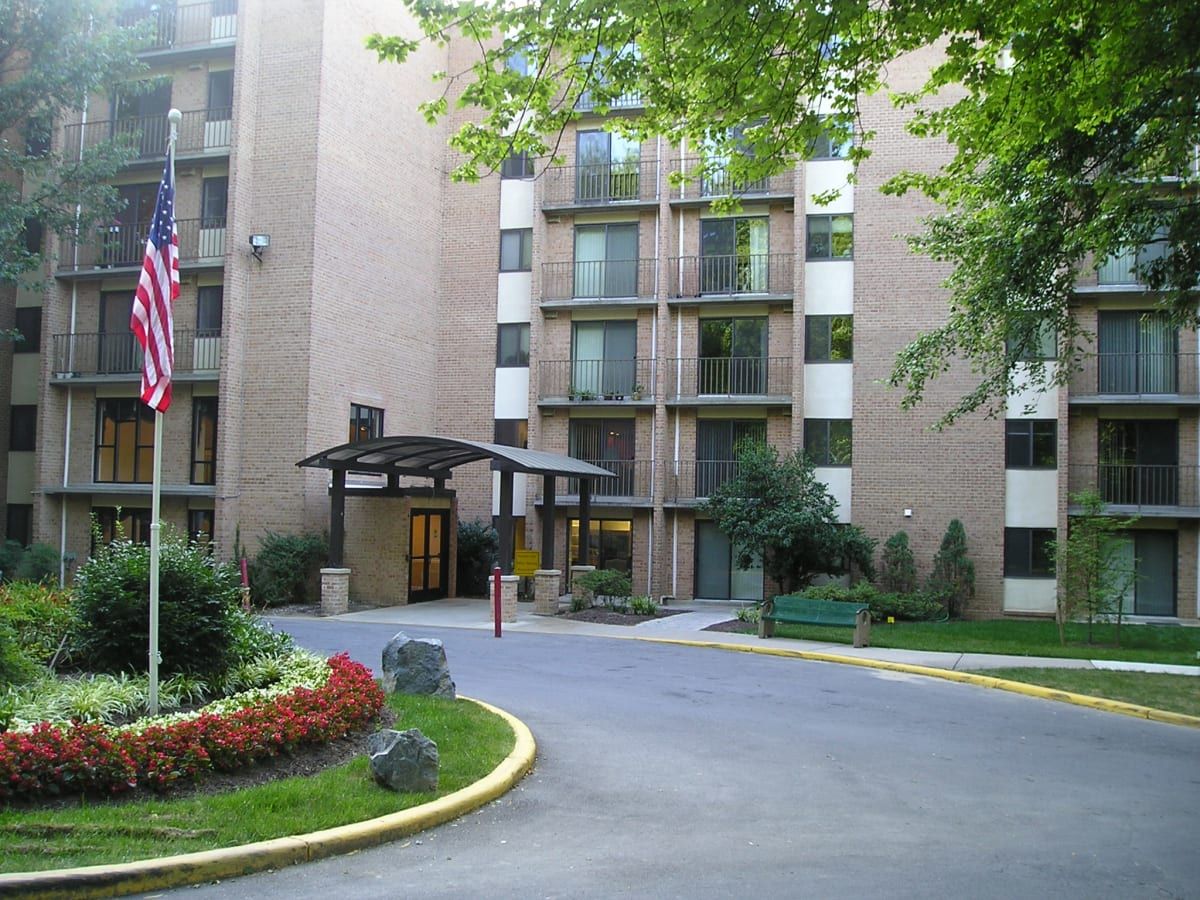
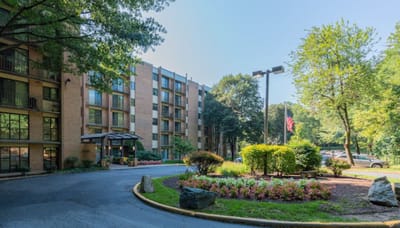
Victory Forest is a budget-friendly senior living community conveniently situated amidst the picturesque landscapes of Silver Spring, Maryland. Nestled within the Capital View neighborhood, Victory Forest presents a haven for those aged 62 and above, offering an array of engaging social events and activities that cater to diverse interests, ensuring an enriching and vibrant lifestyle. Victory Forest’s strategic location brings convenience to the doorstep, with shopping, dining, and entertainment options nearby, coupled with effortless access to major roadways and public transportation. Beyond affordable senior apartments, Victory Forest offers a superior way of life that doesn’t compromise quality.
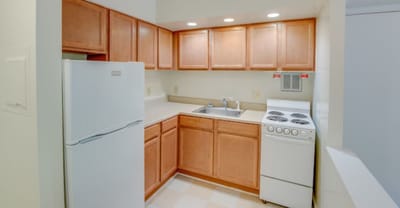
This assisted living community offers spacious apartment homes thoughtfully designed to accommodate every senior resident’s needs, complete with modern amenities. From fully-equipped kitchens to inviting living rooms featuring Juliet balconies, every detail has been considered to provide utmost comfort. Generously appointed with wall-to-wall carpeting, ample closet space, and medical emergency pull cords, these one-bedroom homes offer both convenience and peace of mind. The landscaped surroundings of Victory Forest blend seamlessly with the residential ambiance, featuring a terrace where residents can unwind, barbecue, and soak in the serene atmosphere. Wheelchair accessibility further ensures inclusivity and convenience for all. Experience a high-caliber lifestyle that fits within the budget at Victory Forest.
Walk Score: 33 / 100 Rank #597 / 985Walk Score — State benchmarkedThis home is ranked 597th out of 985 homes in Maryland. Shows how walkable this facility's neighborhood is compared to the average Walk Score across Maryland facilities. Higher scores benefit residents, families, and staff.Click the rank badge to see the full State ranking.Click here to see the full State ranking.
Somewhat walkable. A few nearby services may be reachable on foot, but most trips require transportation.
What does this home offer?
Minimum Age: 62 Years Old
Pets Allowed
Room Sizes: 525 - 550 sq. ft
Housing Options: 1 Bed
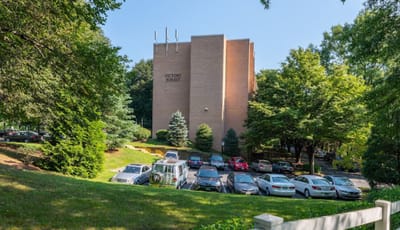
Building Type: Mid-rise
Transportation Services
Fitness and Recreation
Living Spaces & Floor Plans for Victory Forest
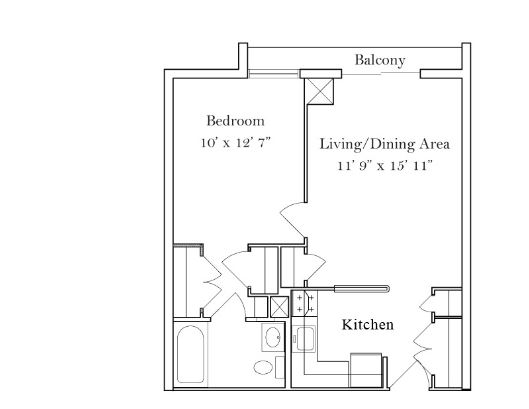
Victory Forest P1
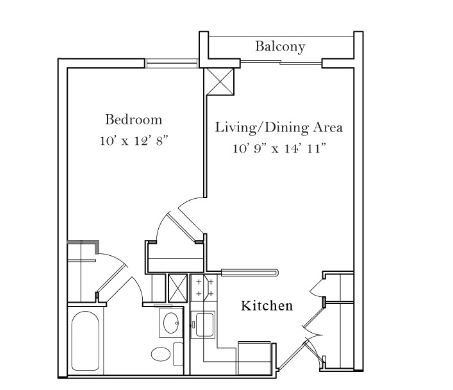
Victory Forest P2
Places of interest near Victory Forest
![]() 7.9 miles from city center
7.9 miles from city center
![]() Estimated distance in miles from Silver Spring's city center to Victory Forest's address, calculated via Google Maps.
— 3.23 miles to nearest hospital (NIH Heart Center)
Estimated distance in miles from Silver Spring's city center to Victory Forest's address, calculated via Google Maps.
— 3.23 miles to nearest hospital (NIH Heart Center)
Calculate Travel Distance to Victory Forest
Add your location
Financial Assistance for
Assisted Living in Maryland
Victory Forest is located in Silver Spring, Maryland.
Here are the financial assistance programs available to residents in Maryland.
Frequently Asked Questions about Victory Forest
What neighborhood is Victory Forest in?
Victory Forest is in the Forest Glen neighborhood.
Is Victory Forest in a walkable area?
Victory Forest has a walk score of 33. Somewhat walkable. A few nearby services may be reachable on foot, but most trips require transportation.
Are there photos of Victory Forest?
Yes — there are 5 photos of Victory Forest in the photo gallery on this page.
What is the address of Victory Forest?
Victory Forest is located at 10000 Brunswick Ave, Silver Spring, MD 20910.
What is the phone number of Victory Forest?
(301) 589-4030 will put you in contact with the team at Victory Forest.
Is Victory Forest Medicare or Medicaid certified?
Victory Forest is not currently listed as a CMS-certified provider of Medicare or Medicaid.
Guides for Better Senior Living
Care Cost Calculator: See Prices in Your Area
Nursing Home Data Explorer
Don’t Wait Too Long: 7 Red Flag Signs Your Parent Needs Assisted Living Now
The True Cost of Assisted Living in 2025 – And How Families Are Paying For It
Understanding Senior Living Costs: Pricing Models, Discounts & Financial Assistance
Contact Us

Updated on
Feedback
Write a review for Victory Forest
Rate your overall experience with this community
Explore Open Rooms
1
Contact details
2
What type of senior care service are you looking for?
3
What budget do you have in mind for senior care?
4
How soon do you need to find care?
5
Additional details
Thank you for your interest!
Our team will be in touch shortly to help with next steps.
Need Help?
Let us help you or a loved one find the perfect senior home.
