


Mostly short-term rehab stays
Most residents typically stay for a few weeks or months before returning home or moving on.
Most new residents arrive under Medicare (90% of admissions), and a typical Medicare stay runs around 27 days.
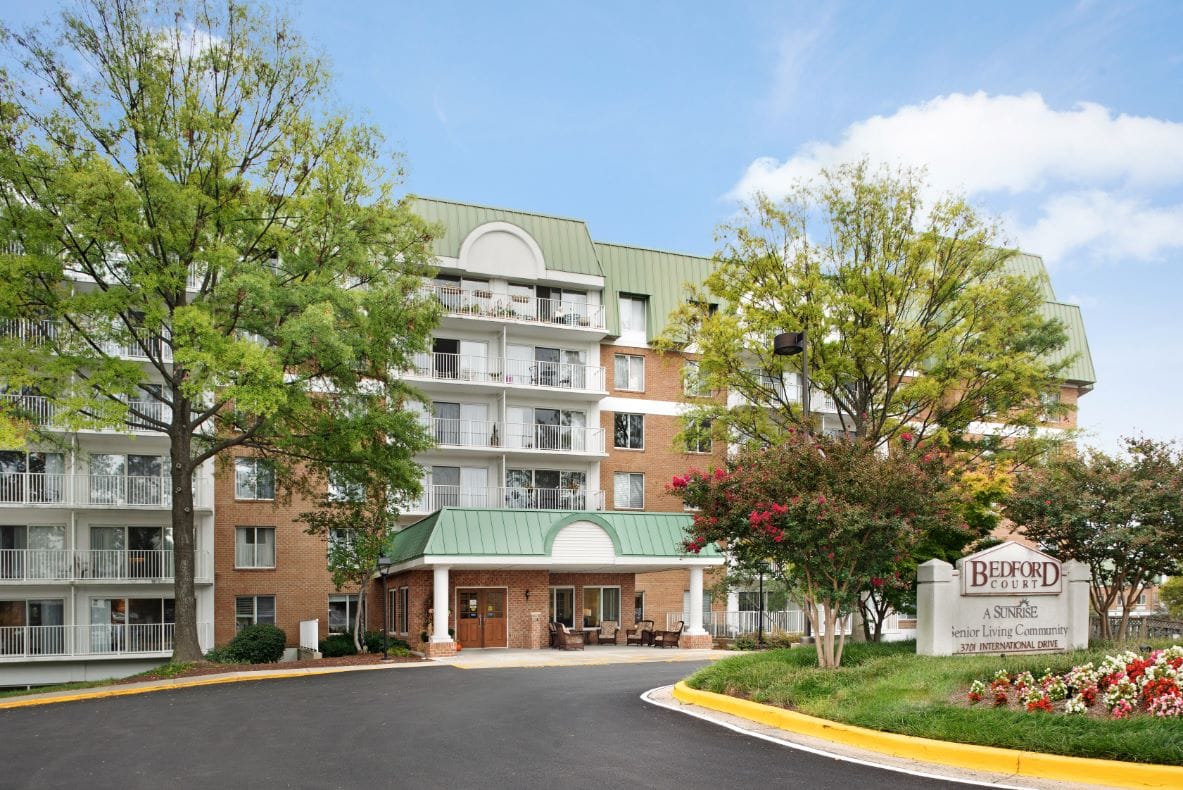
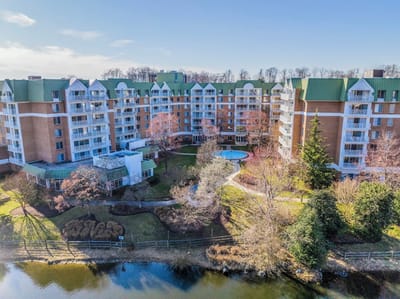

Live a vibrant retirement life with Bedford Court, a blissful senior living community in the serene and beautiful neighborhood of Silver Spring, MD, that strives to provide a welcoming environment filled with warmth and outgoing residents. Here, residents are offered with an active independent living and assisted living lifestyle, as well as skilled nursing and rehabilitation services for those who require assistance in their recovery process. The community provides an array of convenient services, including assistance with daily living activities, medication management, personal care support, and more.
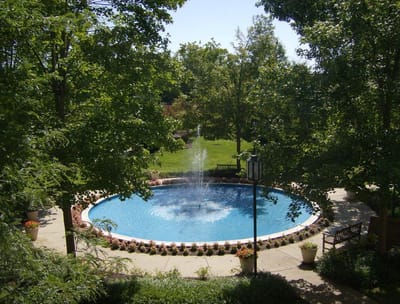
Various conveniences, such as housekeeping, maintenance and concierge services are offered for a maintenance-free living experience. Residents can prepare their own meals or enjoy the community’s restaurant-style dining experience with a great selection of delicately prepared meals served in an elegant dining area. A multitude of hotel-like amenities, such as fitness center, spa, gazebo, activity rooms, a bistro, salon, sun room, and beautiful outdoor spaces are offered to make residents’ living experience more enjoyable.
| Staff type | Hours / Day / Resident | vs state avg |
|---|---|---|
|
Registered Nurse (RN)
| 32m per day | ▼ 36% State avg: 49m per day · National avg: 41m per day |
|
LPN / LVN
| 1h 24m per day | ▲ 54% State avg: 55m per day · National avg: 52m per day |
|
Nurse Aide
| 2h 57m per day | ▲ 38% State avg: 2h 8m per day · National avg: 2h 20m per day |
|
Weekend Total Nursing
| 4h 26m per day | ▲ 26% State avg: 3h 31m per day · National avg: 3h 27m per day |
|
Physical Therapist
| 11m per day | ▲ 83% State avg: 6m per day · National avg: 4m per day |
|
Weekend RN
| 23m per day | ▼ 38% State avg: 37m per day · National avg: 29m per day |
Bedford Court is legally operated by Welltower CCRC Group.
Resident demographic information for this facility.
Federal penalties imposed by CMS for regulatory violations, including civil money penalties (fines) and denials of payment for new Medicare/Medicaid admissions.
Source: CMS Penalties Database
No penalties in the past 3 years
No civil money penalties or payment denials were reported in the last 3 years.
90% of new residents, usually for short-term rehab.
6% of new residents, often for short stays.
4% of new residents, often for long-term daily care.
Based on CMS SNF Cost Report for fiscal year ending in 12/2023.
Pets Allowed
Housing Options: Studio / 1 Bed / 2 Bed
Building Type: Mid-rise
Transportation Services
Fitness and Recreation
Most residents typically stay for a few weeks or months before returning home or moving on.
Most new residents arrive under Medicare (90% of admissions), and a typical Medicare stay runs around 27 days.
Coverage residents most often arrive under.
Coverage residents most often leave under.
![]() 7.8 miles from city center
7.8 miles from city center
![]() Estimated distance in miles from Silver Spring's city center to Bedford Court's address, calculated via Google Maps.
— 6.7 miles to nearest hospital (Adventist HealthCare Shady Grove Medical Center)
Estimated distance in miles from Silver Spring's city center to Bedford Court's address, calculated via Google Maps.
— 6.7 miles to nearest hospital (Adventist HealthCare Shady Grove Medical Center)
Add your location
The information below is reported by the Maryland Department of Health, Office of Health Care Quality.
| Bedford Court, a CCRC | NH AL HOS IL MC RC SNF | Silver Spring (International Drive) | 76
Facility
76
MD AVG
43
Rank
#179 / 690 | - | - | 4.81
Facility
4.81
MD AVG
3.77
Rank
#16 / 143 | -36% | +27% | $0
Facility
$0
MD AVG
$65.0k
Rank
#1 / 145 | 23
Facility
23
MD AVG
49.9
Rank
#18 / 145 | 7.7
Facility
7.7
MD AVG
12.8
Rank
#34 / 145 | - | 43 | - |
64
Facility
64
MD AVG
43
Rank
#261 / 985 | Welltower Opco Group LLC | $23.1MFiscal year ending 12/2023
Facility
$23.1MFiscal year ending 12/2023
MD AVG
$18.7M
Rank
#38 / 144 | $10.0MFiscal year ending 12/2023
Facility
$10.0MFiscal year ending 12/2023
MD AVG
$6.5M
Rank
#43 / 144 | 43.1%Fiscal year ending 12/2023
Facility
43.1%Fiscal year ending 12/2023
MD AVG
38.5%
Rank
#113 / 144 | 215246 | ||||
| Complete Care at Springbrook | NH HOS PC RC SNF | Silver Spring | 93
Facility
93
MD AVG
43
Rank
#147 / 690 |
83.9%
Facility
83.9%
MD AVG
80.8
Rank
#66 / 104 | +4% | 2.77
Facility
2.77
MD AVG
3.77
Rank
#141 / 143 | -72% | -27% | $0
Facility
$0
MD AVG
$65.0k
Rank
#1 / 145 | 33
Facility
33
MD AVG
49.9
Rank
#43 / 145 | 6.6
Facility
6.6
MD AVG
12.8
Rank
#15 / 145 | 1 | 78 | A+ |
36
Facility
36
MD AVG
43
Rank
#563 / 985 | - | $10.5M*Fiscal year ending 12/2021These figures are from this home's most recent complete cost report — an older period than most facilities report. Compare with that in mind.
Facility
$10.5M*Fiscal year ending 12/2021These figures are from this home's most recent complete cost report — an older period than most facilities report. Compare with that in mind.
MD AVG
$18.7M
Rank
#107 / 144 | $5.1M*Fiscal year ending 12/2021These figures are from this home's most recent complete cost report — an older period than most facilities report. Compare with that in mind.
Facility
$5.1M*Fiscal year ending 12/2021These figures are from this home's most recent complete cost report — an older period than most facilities report. Compare with that in mind.
MD AVG
$6.5M
Rank
#133 / 144 | 48.9%*Fiscal year ending 12/2021These figures are from this home's most recent complete cost report — an older period than most facilities report. Compare with that in mind.
Facility
48.9%*Fiscal year ending 12/2021These figures are from this home's most recent complete cost report — an older period than most facilities report. Compare with that in mind.
MD AVG
38.5%
Rank
#123 / 144 | 215052 | ||||
| Althea Woodland Nursing Home | NH HOS MC RC SNF | Silver Spring (Montgomery Knolls) | 50
Facility
50
MD AVG
43
Rank
#220 / 690 |
95.0%
Facility
95.0%
MD AVG
80.8
Rank
#15 / 104 | +18% | 3.79
Facility
3.79
MD AVG
3.77
Rank
#47 / 143 | -3% | 0% | $0
Facility
$0
MD AVG
$65.0k
Rank
#1 / 145 | 29
Facility
29
MD AVG
49.9
Rank
#28 / 145 | 7.3
Facility
7.3
MD AVG
12.8
Rank
#25 / 145 | - | 48 | - |
12
Facility
12
MD AVG
43
Rank
#802 / 985 | Toni Meyer | $6.3MFiscal year ending 12/2023
Facility
$6.3MFiscal year ending 12/2023
MD AVG
$18.7M
Rank
#137 / 144 | $2.5MFiscal year ending 12/2023
Facility
$2.5MFiscal year ending 12/2023
MD AVG
$6.5M
Rank
#143 / 144 | 40.3%Fiscal year ending 12/2023
Facility
40.3%Fiscal year ending 12/2023
MD AVG
38.5%
Rank
#130 / 144 | 215228 | ||||
| Autumn Lake Healthcare at Oakview | NH PC RC SNF | Silver Spring (Wheaton) | 138
Facility
138
MD AVG
43
Rank
#56 / 690 |
88.0%
Facility
88.0%
MD AVG
80.8
Rank
#49 / 104 | +9% | 3.74
Facility
3.74
MD AVG
3.77
Rank
#57 / 143 | -53% | -1% | $0
Facility
$0
MD AVG
$65.0k
Rank
#1 / 145 | 60
Facility
60
MD AVG
49.9
Rank
#106 / 145 | 20.0
Facility
20.0
MD AVG
12.8
Rank
#128 / 145 | - | 121 | - |
29
Facility
29
MD AVG
43
Rank
#638 / 985 | Oakview Holdco LLC | $16.0MFiscal year ending 12/2023
Facility
$16.0MFiscal year ending 12/2023
MD AVG
$18.7M
Rank
#84 / 144 | $2.2MFiscal year ending 12/2023
Facility
$2.2MFiscal year ending 12/2023
MD AVG
$6.5M
Rank
#75 / 144 | 13.7%Fiscal year ending 12/2023
Facility
13.7%Fiscal year ending 12/2023
MD AVG
38.5%
Rank
#51 / 144 | 215338 |
Bedford Court is located in Silver Spring, Maryland.
Here are the financial assistance programs available to residents in Maryland.
Bedford Court is in the International Drive neighborhood of Silver Spring.
Bedford Court is legally operated by Welltower CCRC Group.
Bedford Court has a walk score of 66. Moderately walkable. Some errands can be accomplished on foot, with a mix of nearby amenities.
Bedford Court's occupancy is 76.5%.
Yes — see the floorplan options available at Bedford Court on this page.
Yes, Bedford Court allows residents to bring their pets.
Bedford Court is registered as a for-profit in MD.
Care Cost Calculator: See Prices in Your Area
Nursing Home Data Explorer
Don’t Wait Too Long: 7 Red Flag Signs Your Parent Needs Assisted Living Now
The True Cost of Assisted Living in 2025 – And How Families Are Paying For It
Understanding Senior Living Costs: Pricing Models, Discounts & Financial Assistance
