Bella Terra Bloomingdale
Nursing Home & Palliative Care · Bloomingdale, IL
CMS overall rating Info CMS (the Centers for Medicare & Medicaid Services) is the federal agency that rates nursing home quality. Its Overall Rating runs from 1 to 5 stars, combining health inspections, staffing, and quality measures, with inspections weighted most heavily.

Bella Terra Bloomingdale

Nursing Home & Palliative Care · Bloomingdale, IL
CMS overall rating Info CMS (the Centers for Medicare & Medicaid Services) is the federal agency that rates nursing home quality. Its Overall Rating runs from 1 to 5 stars, combining health inspections, staffing, and quality measures, with inspections weighted most heavily.
Calculator: See prices in your area
Bella Terra Bloomingdale accepts Medicare, Medicaid, and private pay.

Overview of Bella Terra Bloomingdale

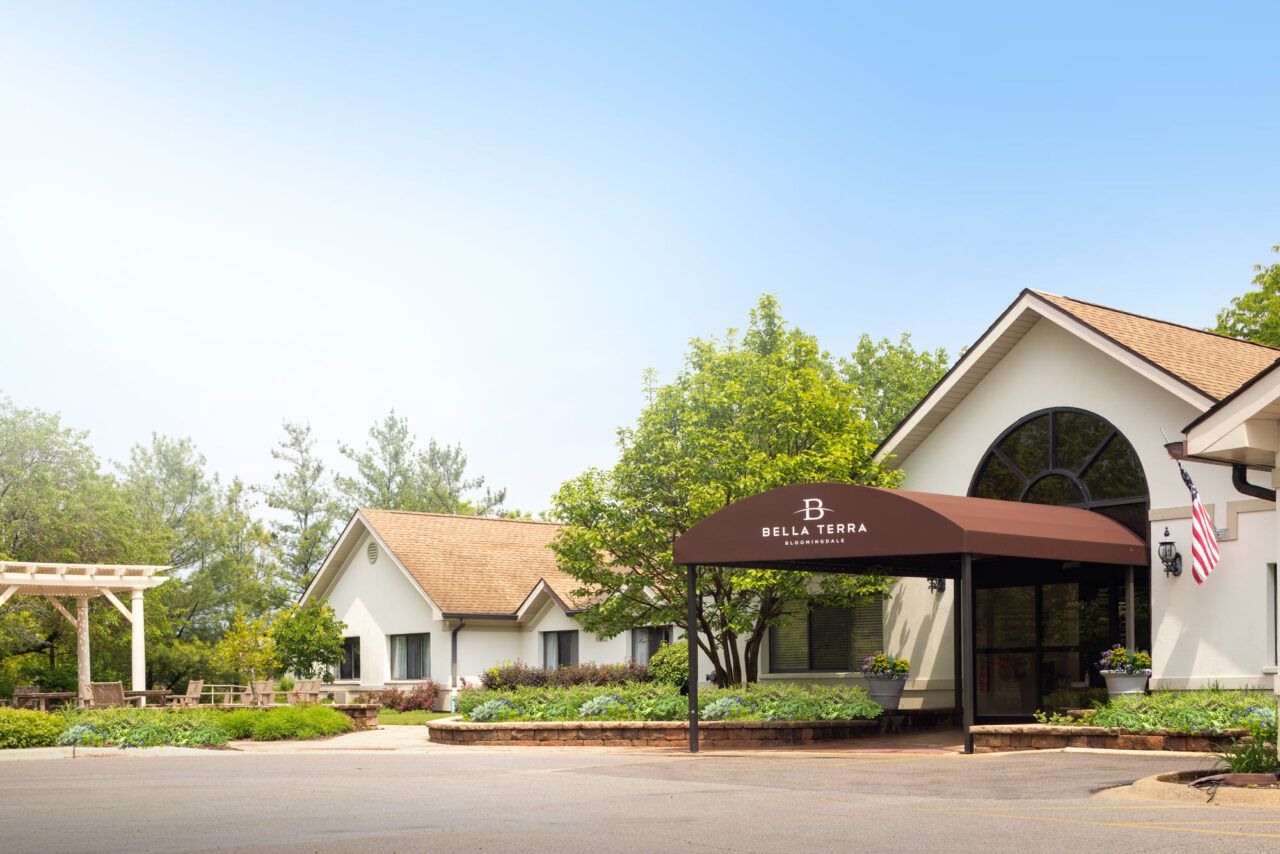
Bella Terra Bloomingdale is a nursing home in Bloomingdale, IL, offering post-hospital care, rehabilitation, and skilled nursing. Here, older adults can feel at home, especially with a nurturing and welcoming environment. Exceptional services, including 24/7 care, nutritious meals, and recreational opportunities, are also provided to improve residents’ quality of life. The community also works closely with residents to provide the best possible care tailored to their unique needs and habits.

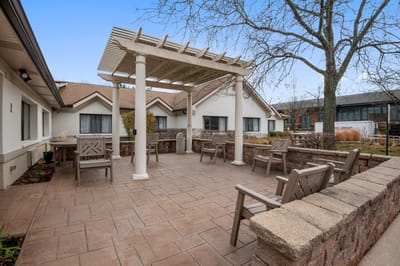
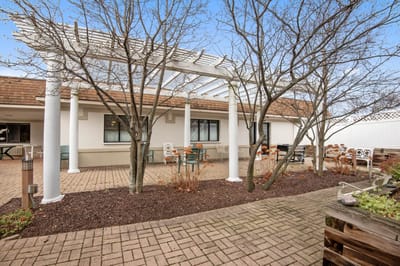
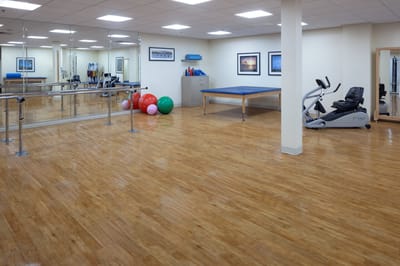
Fitness exercises, celebrations, and various activities encourage residents to live actively and have fun. Therapy gyms, spacious patios, and thoughtfully furnished rooms are also available, so residents can focus on their recovery and relaxation. Bloomington Fire Department, Bloomingdale Public Library, and other local amenities are located nearby, ensuring accessibility and convenience. This nursing home has high standards of care and a clean setting, making it one of the best options for senior living in Illinois.

Quality ratings

Measured by Centers for Medicare & Medicaid Services (CMS)

Overall rating Info The Overall CMS Rating combines results from health inspections, staffing levels and quality measures. Health inspections carry the most weight. Staffing and quality scores can increase or decrease the final rating based on performance compared to state and national standards.
▲ 19.0% Above IL avg. ▲ 19.0% Above IL avg.IL average: 2.5Click the badge to see the full State ranking.Click here to see the full State ranking.
Health Inspection Info Based on the results of the facility's three most recent standard inspections and any complaint investigations. CMS reviews the number, scope, and severity of deficiencies, with more recent findings weighted more heavily.
▲ 8.1% Above IL avg. ▲ 8.1% Above IL avg.IL average: 2.8Click the badge to see the full State ranking.Click here to see the full State ranking.
Staffing Info Measures average nursing staff hours per resident per day, including Registered Nurses (RNs) and total nursing staff. Ratings are adjusted based on the level of care residents require and are compared to state and national benchmarks.
▼ 6.4% Below IL avg. ▼ 6.4% Below IL avg.IL average: 2.1Click the badge to see the full State ranking.Click here to see the full State ranking.
Quality Measures Info Based on clinical and physical health indicators reported to CMS, such as hospital readmissions, falls, pressure ulcers, and improvements in mobility. These measures reflect how well residents' health needs are being managed.
▲ 6.6% Above IL avg. ▲ 6.6% Above IL avg.IL average: 2.8Click the badge to see the full State ranking.Click here to see the full State ranking.

Staffing hours breakdown

Info Daily nursing hours per resident by staff type, reported to CMS. Higher is generally better — compare this facility to state and national averages to see where staffing stands.

Hours per resident per day — compared to Illinois state averages

Total nursing care / resident Info This home is ranked 103rd out of 172 homes in Illinois for nurse hours. Total adjusted nursing hours per resident per day, combining RN, LPN, and aide time. CMS adjusts this for case-mix so facilities can be fairly compared.
2h 40m per day
Rank #103 / 172Nurse hours — State benchmarkedThis home is ranked 103rd out of 172 homes in Illinois. Shows adjusted nurse hours per resident per day benchmarked to the Illinois average, with a ranking across 172 Illinois facilities. More hours mean more direct care. The national average is about 3.5 hrs; below 3.0 is a red flag.Ranking totals vary by category as each rank only includes facilities that report data for that metric. Homes missing that data point aren't included in the ranking.Click the rank badge to see the full State ranking.Click here to see the full State ranking.
This facility Illinois avg (3h 6m per day)
vs Illinois avg
-14%

1 of 6 metrics below state avg

Standout metric Weekend RN is +56% above state avg
Staff typeHours / Day / Residentvs state avg
Registered Nurse (RN) Info RNs hold the highest nursing license and can assess residents, interpret test results, and direct care plans. More RN hours per day often signals stronger clinical oversight and faster response to health changes. 53m per day ▲ 23% State avg: 43m per day · National avg: 41m per day
LPN / LVN Info Licensed Practical Nurses (LPNs) or Licensed Vocational Nurses (LVNs) deliver routine hands-on care — medication administration, wound dressing, and monitoring vital signs. They work under RN supervision and make up a large share of daily bedside care. 40m per day ■ Avg State avg: 39m per day · National avg: 52m per day
Nurse Aide Info Certified Nurse Aides (CNAs) provide the most direct day-to-day assistance: bathing, dressing, feeding, and mobility. Nurse aide hours are typically the largest staffing category and directly affect residents' quality of life. 2h 1m per day ▼ 5% State avg: 2h 7m per day · National avg: 2h 20m per day
Weekend Total Nursing Info Combined nursing hours (RN + LPN + Nurse Aide) per resident per day on weekends. Staffing often drops on weekends — this figure reveals whether the facility maintains adequate coverage outside of weekday hours. 3h 24m per day ▲ 10% State avg: 3h 6m per day · National avg: 3h 27m per day
Physical Therapist Info Hours per resident per day provided by licensed Physical Therapists (PTs) or PT Assistants. PT services help residents recover mobility after injury or illness and are especially important for post-acute (short-stay) rehabilitation. 4m per day ▲ 20% State avg: 3m per day · National avg: 4m per day
Weekend RN Info Registered nurse hours specifically on weekends. Facilities sometimes reduce RN presence on Saturdays and Sundays — a low weekend RN figure compared to weekday hours can indicate reduced clinical oversight when most administrative staff are absent. 52m per day ▲ 56% State avg: 33m per day · National avg: 29m per day

Capacity and availability

This home usually has availability

Lower occupancy than the Illinois average: 69.3%
Occupancy rate
57.8% Rank #159 / 204Occupancy rate — State benchmarkedThis home is ranked 159th out of 204 homes in Illinois. Shows this facility's occupancy rate versus the Illinois average, with its Statewide rank out of 204. Higher occupancy signals strong local demand and financial stability.Ranking totals vary by category as each rank only includes facilities that report data for that metric. Homes missing that data point aren't included in the ranking.Click the rank badge to see the full State ranking.Click here to see the full State ranking.
Avg. Length of Stay
64 days
Bed community size
166-bed community Rank #42 / 426Bed count — State benchmarkedThis home is ranked 42nd out of 426 homes in Illinois. Shows this facility's certified or reported bed count compared to other Illinois facilities. Larger communities may offer more amenities, programs, and on-site services for residents and families.Ranking totals vary by category as each rank only includes facilities that report data for that metric. Homes missing that data point aren't included in the ranking.Click the rank badge to see the full State ranking.Click here to see the full State ranking.
A large-scale community that may provide a wide range of amenities, services, and structured programs.
Walk Score
Walk Score: 70 / 100 Rank #153 / 648Walk Score — State benchmarkedThis home is ranked 153rd out of 648 homes in Illinois. Shows how walkable this facility's neighborhood is compared to the average Walk Score across Illinois facilities. Higher scores benefit residents, families, and staff.Ranking totals vary by category as each rank only includes facilities that report data for that metric. Homes missing that data point aren't included in the ranking.Click the rank badge to see the full State ranking.Click here to see the full State ranking.
Very walkable. Most errands can be accomplished on foot, and many essentials are within a short walk.

About this community

Contact Bella Terra Bloomingdale

Staffing Data

Reporting period: October 1 – December 31, 2025 (Q4 2025). Source: CMS Payroll-Based Journal report.

Total staff 397
Employees 93
Contractors 304
Staff to resident ratio 3.42 : 1
90% more staff per resident than Illinois average
Illinois average ratio: 1.80 : 1 Illinois average ratio: 1.80 : 1See full Illinois ranking
Avg staff/day 60
Average shift 7.1 hours
7% worse than Illinois average
Illinois average: 7.6 hours Illinois average shift: 7.6 hoursSee full Illinois ranking
Total staff hours (quarter) 39,193

Nursing staff breakdown

Q4 2025 · Oct 1 – Dec 31 More info This data comes from the CMS Payroll-Based Journal report covering October 1 – December 31, 2025.
Registered Nurse

Manages medical care and health needs.

RN Staff Info 83 total: 14 full-time employees and 69 contractors. 83
Average shift length Info Average shift length. Calculated as total hours divided by days worked and average staff per day. 7.1 hours
Licensed Practical Nurse

Assists with medical care and medications.

LPN Staff Info 37 total: 13 full-time employees and 24 contractors. 37
Average shift length Info Average shift length. Calculated as total hours divided by days worked and average staff per day. 7.4 hours
Certified Nursing Assistant

Helps with daily care and mobility.

CNA Staff Info 231 total: 49 full-time employees and 182 contractors. 231
Average shift length Info Average shift length. Calculated as total hours divided by days worked and average staff per day. 7.7 hours

Contractor staffing

Q4 2025 · Oct 1 – Dec 31 More info This data comes from the CMS Payroll-Based Journal report covering October 1 – December 31, 2025.

Total hours from contractors

18.5%

7,237 contractor hours this quarter

Certified Nursing Assistant: 182 Registered Nurse: 69 Licensed Practical Nurse: 24 Physical Therapy Assistant: 9 Physical Therapy Aide: 8 Qualified Social Worker: 5 Respiratory Therapy Technician: 4 Speech Language Pathologist: 3

Staff by category

Q4 2025 · Oct 1 – Dec 31 More info This data comes from the CMS Payroll-Based Journal report covering October 1 – December 31, 2025.
Certified Nursing Assistant4918223119,40692100%7.7
Licensed Practical Nurse1324375,88492100%7.4
Registered Nurse1469835,72892100%7.1
Clinical Nurse Specialist5052,2719199%5.9
Other Dietary Services Staff2029479199%7.4
Speech Language Pathologist0336317885%6.7
Respiratory Therapy Technician0445897582%7.2
Dental Services Staff2025509098%5.8
Nurse Practitioner2025059098%5.6
RN Director of Nursing3035048795%5.7
Mental Health Service Worker1014798491%5.7
Dietitian1014628390%5.6
Administrator1014207480%5.7
Physical Therapy Assistant0994087784%3.7
Physical Therapy Aide0882955964%3.7
Qualified Social Worker0551173033%3.7
231 Certified Nursing Assistant
% of Days 100%
37 Licensed Practical Nurse
% of Days 100%
83 Registered Nurse
% of Days 100%
5 Clinical Nurse Specialist
% of Days 99%
2 Other Dietary Services Staff
% of Days 99%
3 Speech Language Pathologist
% of Days 85%
4 Respiratory Therapy Technician
% of Days 82%
2 Dental Services Staff
% of Days 98%
2 Nurse Practitioner
% of Days 98%
3 RN Director of Nursing
% of Days 95%
1 Mental Health Service Worker
% of Days 91%
1 Dietitian
% of Days 90%
1 Administrator
% of Days 80%
9 Physical Therapy Assistant
% of Days 84%
8 Physical Therapy Aide
% of Days 64%
5 Qualified Social Worker
% of Days 33%

Penalties and fines

Includes penalties issued in 2023

Federal penalties imposed by CMS for regulatory violations, including civil money penalties (fines) and denials of payment for new Medicare/Medicaid admissions.

Source: CMS Penalties Database (Data as of Jan 2026)

Total fines amount $58K Rank #95 / 173Federal fines — State benchmarkedThis home is ranked 95th out of 173 homes in Illinois. Shows this facility's cumulative CMS federal fine dollars versus the Illinois average among facilities with fines, and where it ranks among 173 facilities in the pool. Lower total dollars mean a better rank.Ranking totals vary by category as each rank only includes facilities that report data for that metric. Homes missing that data point aren't included in the ranking.Click the rank badge to see the full State ranking.Click here to see the full State ranking.
59% lower than Illinois average

Illinois average: $143K

Number of fines 2
33% fewer fines than Illinois average

Illinois average: 3.0

Payment Denials Info Serious action where Medicare and/or Medicaid temporarily stops payments for new residents until issues are fixed. 2
89% more payment denials than Illinois average

Illinois average: 1.1

Fines amount comparison
This facility $58K
Illinois average $143K
Penalty History

Penalties are imposed by CMS for violations of federal nursing home regulations.

1 penalty in the past 3 years

Jul 15, 2023 · $10K

Civil Money Penalty Info Fines imposed for noncompliance, which can be assessed per day or per instance of violation. Jul 15, 2023
$10K

Last updated: Jan 2026

Quality of care over time

These measures show how residents usually do over time at this home, based on health outcomes and preventive care.

High-risk clinical events score Info A composite score based on pressure ulcers, falls with injury, weight loss, walking ability decline, and activities of daily living decline. 9.1
6% better than Illinois average

Illinois average: 9.7

Functional decline score Info A composite score based on activities of daily living decline, walking ability decline, and incontinence. 20.2
9% worse than Illinois average

Illinois average: 18.6

Long-stay resident measures
Need for Help with Daily Activities Increased Info Percent of long-stay residents whose need for help with daily activities has increased 16.8%
8% worse than Illinois average

Illinois average: 15.5%

Walking Ability Worsened Info Percent of long-stay residents whose ability to move independently worsened 17.0%
8% better than Illinois average

Illinois average: 18.4%

Low Risk Residents with Bowel/Bladder Incontinence Info Percent of low risk long-stay residents who lose control of their bowels or bladder 26.8%
24% worse than Illinois average

Illinois average: 21.6%

Falls with Major Injury Info Percent of long-stay residents experiencing one or more falls with major injury 1.9%
42% better than Illinois average

Illinois average: 3.4%

High Risk Residents with Pressure Ulcers Info Percent of long-stay high risk residents with pressure ulcers 6.5%
24% worse than Illinois average

Illinois average: 5.3%

Urinary Tract Infection Info Percent of long-stay residents with a urinary tract infection 0.3%
84% better than Illinois average

Illinois average: 1.8%

Lost Too Much Weight Info Percent of long-stay residents who lose too much weight 3.5%
47% better than Illinois average

Illinois average: 6.5%

Depressive Symptoms Info Percent of long-stay residents who have depressive symptoms 98.2%
104% worse than Illinois average

Illinois average: 48.1%

Antipsychotic Use Info Percent of long-stay residents who received an antipsychotic medication 18.8%
7% better than Illinois average

Illinois average: 20.2%

Pneumococcal Vaccine Info Percent of long-stay residents assessed and appropriately given the pneumococcal vaccine 99.7%
12% better than Illinois average

Illinois average: 89.2%

Influenza Vaccine Info Percent of long-stay residents assessed and appropriately given the seasonal influenza vaccine 97.9%
7% better than Illinois average

Illinois average: 91.6%

Short-stay resident measures
Pneumococcal Vaccine Info Percent of short-stay residents assessed and appropriately given the pneumococcal vaccine 93.3%
37% better than Illinois average

Illinois average: 68.3%

Antipsychotic medication increase Info Percent of short-stay residents who newly received an antipsychotic medication 1.4%
41% better than Illinois average

Illinois average: 2.3%

Influenza Vaccine Info Percent of short-stay residents assessed and appropriately given the seasonal influenza vaccine 77.1%
22% better than Illinois average

Illinois average: 63.0%

Breakdown by payment type

Medicare

33% of new residents, usually for short-term rehab.

Typical stay 20 days

Private pay

56% of new residents, often for short stays.

Typical stay 2 - 3 months

Medicaid

11% of new residents, often for long-term daily care.

Typical stay 4 - 5 months

Facility Characteristics

Source: CMS Long-Term Care Facility Characteristics (Data as of Jan 2026)

Total residents 116
Medicare
22
19% of residents
Medicaid
84
72.4% of residents
Private pay or other
10
8.6% of residents
Programs & Services
Residents Group

Residents meet regularly to discuss policies, care quality, and activities

Active Resident Council

Organized group of residents that meets regularly to discuss facility policies, quality of life, and activities.

Finances and operations

Based on CMS SNF Cost Report for fiscal year ending in 12/2023.

Privately-owned community
Operated by a single business entity.
Net patient revenue Info Net patient revenue — what the home actually collects for resident care, after contractual allowances, bad debt and discounts are subtracted from its gross charges (CMS cost report, Worksheet G-3). It covers resident care only; money the home earns from other sources is shown separately as "Other income."
$12.4M
Net patient income Info Net patient income: net patient revenue minus the home's total operating expenses. A positive figure means it earns more from resident care than it spends to deliver it; a negative figure means the opposite. It excludes non-operating "other income."
-$202.6K
Privately-owned community Operated by a single business entity.
Net patient revenue Info Net patient revenue — what the home actually collects for resident care, after contractual allowances, bad debt and discounts are subtracted from its gross charges (CMS cost report, Worksheet G-3). It covers resident care only; money the home earns from other sources is shown separately as "Other income."
$12.4M Rank #56 / 171Revenue — State benchmarkedThis home is ranked 56th out of 171 homes in Illinois. Shows this facility's annual revenue compared to the Illinois average. Higher revenue generally means more resources for staffing and capital — read alongside Payroll %.Ranking totals vary by category as each rank only includes facilities that report data for that metric. Homes missing that data point aren't included in the ranking.Click the rank badge to see the full State ranking.Click here to see the full State ranking.
Net patient income Info Net patient income: net patient revenue minus the home's total operating expenses. A positive figure means it earns more from resident care than it spends to deliver it; a negative figure means the opposite. It excludes non-operating "other income."
-$202.6K
Other income Info Money the home earns outside of resident care — such as investments, grants, rentals and other non-operating sources (CMS cost report, Worksheet G-3). It is tracked separately from net patient revenue: it is not part of that figure, and it is not included in net patient income.
$763.8K
Payroll costs Info Staff salaries plus wage-related costs — benefits such as payroll taxes, health insurance and retirement — from the home's own accounting records (CMS cost report, Worksheet A). Contract or agency labor is counted separately, under other operating costs. Rank #94 / 171Payroll — State benchmarkedThis home is ranked 94th out of 171 homes in Illinois. Shows total annual staff payroll benchmarked to the Illinois average. Higher payroll investment relative to peers often signals better staffing and less reliance on cheaper contract labor.Ranking totals vary by category as each rank only includes facilities that report data for that metric. Homes missing that data point aren't included in the ranking.Click the rank badge to see the full State ranking.Click here to see the full State ranking.
$4.7M 38.4% of net patient revenue Info Payroll as a share of revenue: staff salaries and wage-related benefits divided by net patient revenue. A higher figure means more of each revenue dollar goes to staff pay. Rank #159 / 171Payroll % — State benchmarkedThis home is ranked 159th out of 171 homes in Illinois. Shows payroll as a percentage of revenue versus the Illinois average. Well-run Illinois facilities typically land around 54–67% — the top third Statewide. Below 25% may signal understaffing or heavy agency use — read with Staffing ratings.Ranking totals vary by category as each rank only includes facilities that report data for that metric. Homes missing that data point aren't included in the ranking.Click the rank badge to see the full State ranking.Click here to see the full State ranking.
Other operating costs Info Everything it costs to run the home apart from payroll — food, utilities, supplies, maintenance, contract labor and administration. Calculated as total operating expense minus payroll (staff salaries and wage-related benefits).
$7.8M
Total costs Info The home's total operating expense for the year — all the costs of running it, salaries included (CMS cost report, Worksheet G-3).
$12.6M

What does this home offer?

Building type icon
Building type icon

Building Type: Single-story

On-site medical care and health services icon

On-site Medical Care and Health Services

Rehabilitative support icon

Rehabilitative Support

Social and recreational activities icon

Social and Recreational Activities

Who this home usually serves

TYPE OF STAY

Mix of rehab and long-term care

This home supports both short-term rehab and long-term care, with residents staying for a wide range of durations.

Most new residents arrive under private pay (56% of admissions), and a typical private pay stay runs around 2 - 3 months.

Admissions
515 total

Coverage residents most often arrive under.

Medicare 33%
Private pay 56%
Medicaid 11%
Discharges
545 total

Coverage residents most often leave under.

Medicare 25%
Private pay 59%
Medicaid 16%

Places of interest near Bella Terra Bloomingdale

Address 0.8 miles from city center Info Estimated distance in miles from Bloomingdale's city center to Bella Terra Bloomingdale's address, calculated via Google Maps.

Calculate Travel Distance to Bella Terra Bloomingdale

Add your location

Address

Compare Nursing Home around Bloomingdale

The information below is reported by the Illinois Department of Public Health, Office of Health Care Regulation.

2 facilities compared · CMS & IL Dept. of Health data

Alden Valley Ridge Rehab
NH
HC
MC
NC
RC
Bloomingdale
207
Facility 207
IL AVG 86
Rank #25 / 426
76.4%
Facility 76.4%
IL AVG 69.3%
Rank #94 / 204
+10%
2.29
Facility 2.29
IL AVG 3.10
Rank #146 / 172
+26%-26%
$0
Facility $0
IL AVG $151.3k
Rank #1 / 173
33
Facility 33
IL AVG 36.8
Rank #96 / 172
4.1
Facility 4.1
IL AVG 3.7
Rank #122 / 172
7167-
51
Facility 51
IL AVG 51
Rank #325 / 648
Janine Ciemny
$14.9M
Facility $14.9M
IL AVG $12.2M
Rank #82 / 171
$7.9M
Facility $7.9M
IL AVG $4.8M
Rank #76 / 171
52.9%
Facility 52.9%
IL AVG 44.3%
Rank #66 / 171
145379
Bella Terra Bloomingdale
NH
PC
Bloomingdale
166
Facility 166
IL AVG 86
Rank #42 / 426
57.8%
Facility 57.8%
IL AVG 69.3%
Rank #159 / 204
-17%
2.67
Facility 2.67
IL AVG 3.10
Rank #103 / 172
+47%-14%
$26.3k
Facility $26.3k
IL AVG $151.3k
Rank #95 / 173
49
Facility 49
IL AVG 36.8
Rank #129 / 172
2.7
Facility 2.7
IL AVG 3.7
Rank #32 / 172
5105-
70
Facility 70
IL AVG 51
Rank #153 / 648
Debbie Randon
$12.4M
Facility $12.4M
IL AVG $12.2M
Rank #56 / 171
$4.7M
Facility $4.7M
IL AVG $4.8M
Rank #94 / 171
38.4%
Facility 38.4%
IL AVG 44.3%
Rank #159 / 171
145638

Financial Assistance for
Nursing Home in Illinois

Bella Terra Bloomingdale is located in Bloomingdale, Illinois.
Here are the financial assistance programs available to residents in Illinois.

Get Financial aid guidance

Community Care Program

Illinois CCP

Age 60+
General Illinois resident, at risk of nursing home placement.
Income Limits (2025) ~$1,215/month individual
Asset Limits $17,500 individual, excludes home, car
IL

High demand in urban areas; waitlists possible.

Benefits
In-home care (3-5 hours/day) Adult day services ($65/day) Emergency home response systems ($30/month)

Illinois Respite Program

IL Respite (via NFCSP)

Age Caregiver of someone 60+ (or with dementia)
General Illinois resident.
Income Limits No strict limit; prioritizes low-income.
Asset Limits Not applicable.
IL

Limited slots; urban/rural balance.

Benefits
In-home respite (4-6 hours/day) Adult day care (~$65/day) Short-term facility care (up to 5 days)

Supportive Living Program (SLP)

Illinois Medicaid Supportive Living Program

Age 65+ or 22-64 with disability
General Illinois resident, Medicaid-eligible, needs moderate assistance (not nursing home-level).
Income Limits (2025) ~$2,829/month (300% FBR, individual); QIT allowed.
Asset Limits $2,000 (individual), $3,000 (couple) (excludes home, car).
IL

~200 SLP sites statewide; room/board not covered.

Benefits
Personal care (5-7 hours/day, e.g., bathing, mobility) Meals Housekeeping Medication management Respite (~240 hours/year)

Persons Who Are Elderly Waiver

Illinois Medicaid Elderly Waiver

Age 65+
General Illinois resident, Medicaid-eligible, nursing home-level care need.
Income Limits (2025) ~$2,829/month 300% FBR, individual
Asset Limits $2,000 (individual), $3,000 (couple).
IL

Part of HealthChoice Illinois; consumer-directed options available.

Benefits
Personal care (5-7 hours/day, e.g., dressing, eating) Homemaker Adult day care (~$60/day) Respite (240 hours/year) Home mods ($1,000 avg.)

Medicare Savings Program (MSP)

Illinois Medicare Savings Program

Age 65+ or disabled
General Illinois resident, Medicare Part A/B.
Income Limits (2025) ~$2,510/month (QMB), ~$3,380/month (SLMB), ~$3,598/month (QI)—individual.
Asset Limits $9,430 (individual), $14,130 (couple).
IL

Three tiers; no waitlist.

Benefits
Covers Part B premiums ($174.70/month) Deductibles ($240/year) Copays (~20%)

Optional State Supplementation (OSS)

Illinois Optional State Supplementation

Age 65+ or disabled
General Illinois resident, in approved facility, SSI recipient or low-income.
Income Limits (2025) ~$1,004/month including SSI
Asset Limits $2,000 (individual), $3,000 (couple).
IL

~$50-$500/month based on facility type.

Benefits
Cash (~$50-$500/month) for room/board in personal care homes or SLFs

VA Aid and Attendance (A&A) and Housebound Benefits

Illinois VA Aid and Attendance/Housebound

Age 65+ or disabled veteran/spouse
General Illinois resident, wartime service, need for ADL help (A&A) or homebound.
Income Limits (2025) Net income < ~$1,984/month (veteran with dependent, A&A); pension offsets income.
Asset Limits ~$155,356 net worth limit
IL

High veteran demand in urban/rural areas.

Benefits
Cash (~$1,433-$2,642/month veteran, ~$951-$1,318 spouse) for care costs (e.g., in-home, assisted living)

Frequently Asked Questions about Bella Terra Bloomingdale

Is Bella Terra Bloomingdale in a walkable area?

Bella Terra Bloomingdale has a walk score of 70. Very walkable. Most errands can be accomplished on foot, and many essentials are within a short walk.

What is the occupancy rate at Bella Terra Bloomingdale?

Bella Terra Bloomingdale's occupancy is 57.8%.

What is the best email address for Bella Terra Bloomingdale?

The team at Bella Terra Bloomingdale can be reached at [email protected].

Are there photos of Bella Terra Bloomingdale?

Yes — there are 7 photos of Bella Terra Bloomingdale in the photo gallery on this page.

What is the address of Bella Terra Bloomingdale?

Bella Terra Bloomingdale is located at 165 S Bloomingdale Rd, Bloomingdale, IL 60108.

What is the phone number of Bella Terra Bloomingdale?

(630) 980-8700 will put you in contact with the team at Bella Terra Bloomingdale.

Is Bella Terra Bloomingdale Medicare or Medicaid certified?

Yes — Bella Terra Bloomingdale is a CMS-certified provider of Medicare and Medicaid.

Guides for Better Senior Living

Care Cost Calculator: See Prices in Your Area

Nursing Home Data Explorer

Don’t Wait Too Long: 7 Red Flag Signs Your Parent Needs Assisted Living Now

The True Cost of Assisted Living in 2025 – And How Families Are Paying For It

Understanding Senior Living Costs: Pricing Models, Discounts & Financial Assistance