Occupancy rate
91%

We arrange tours, appointments, and even moving support so you don’t have to

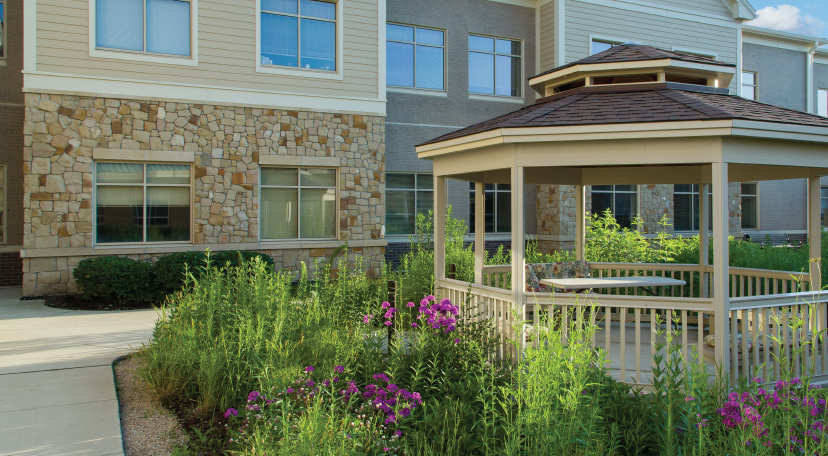

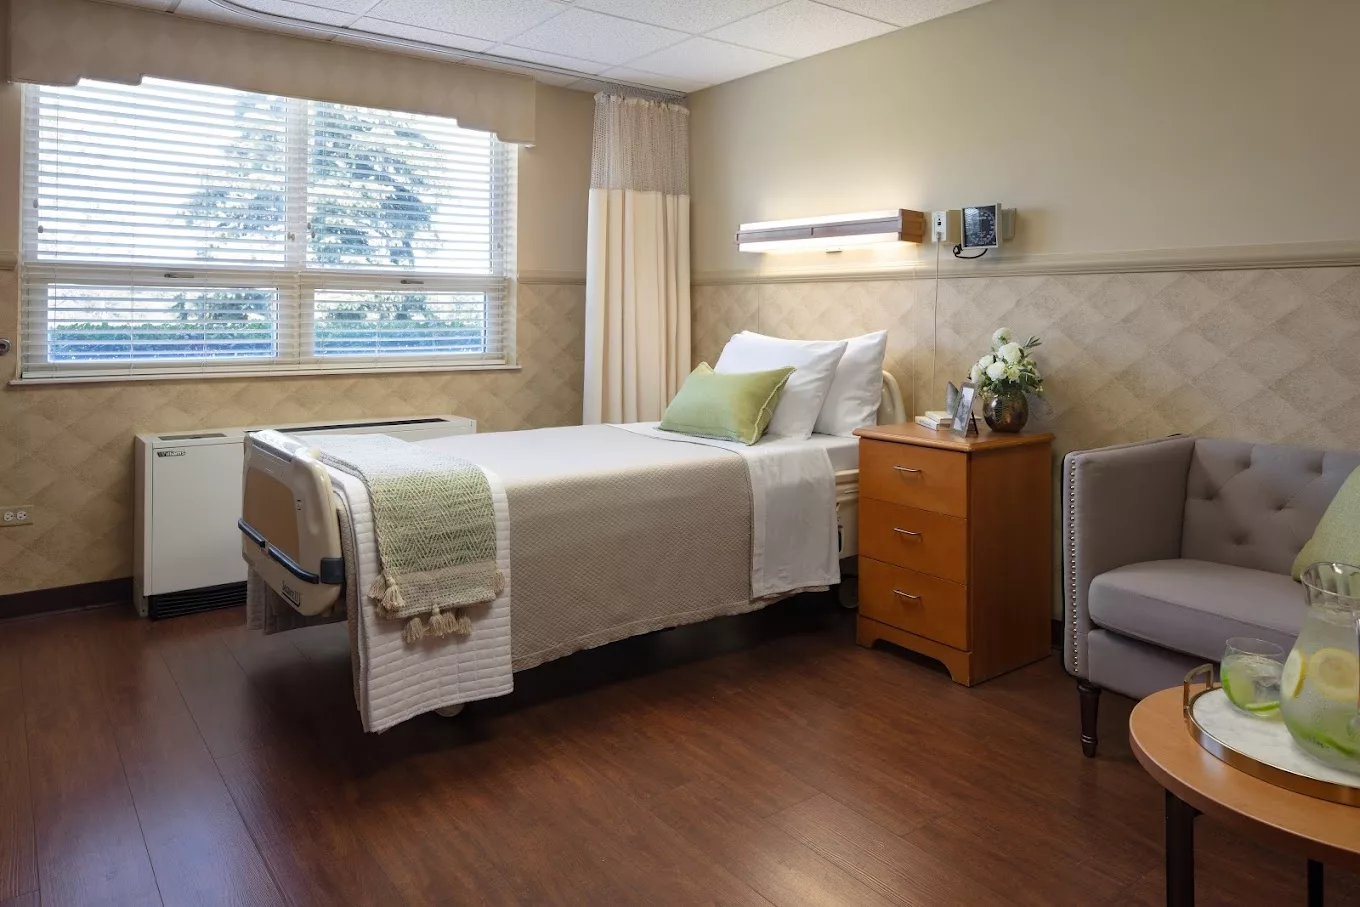
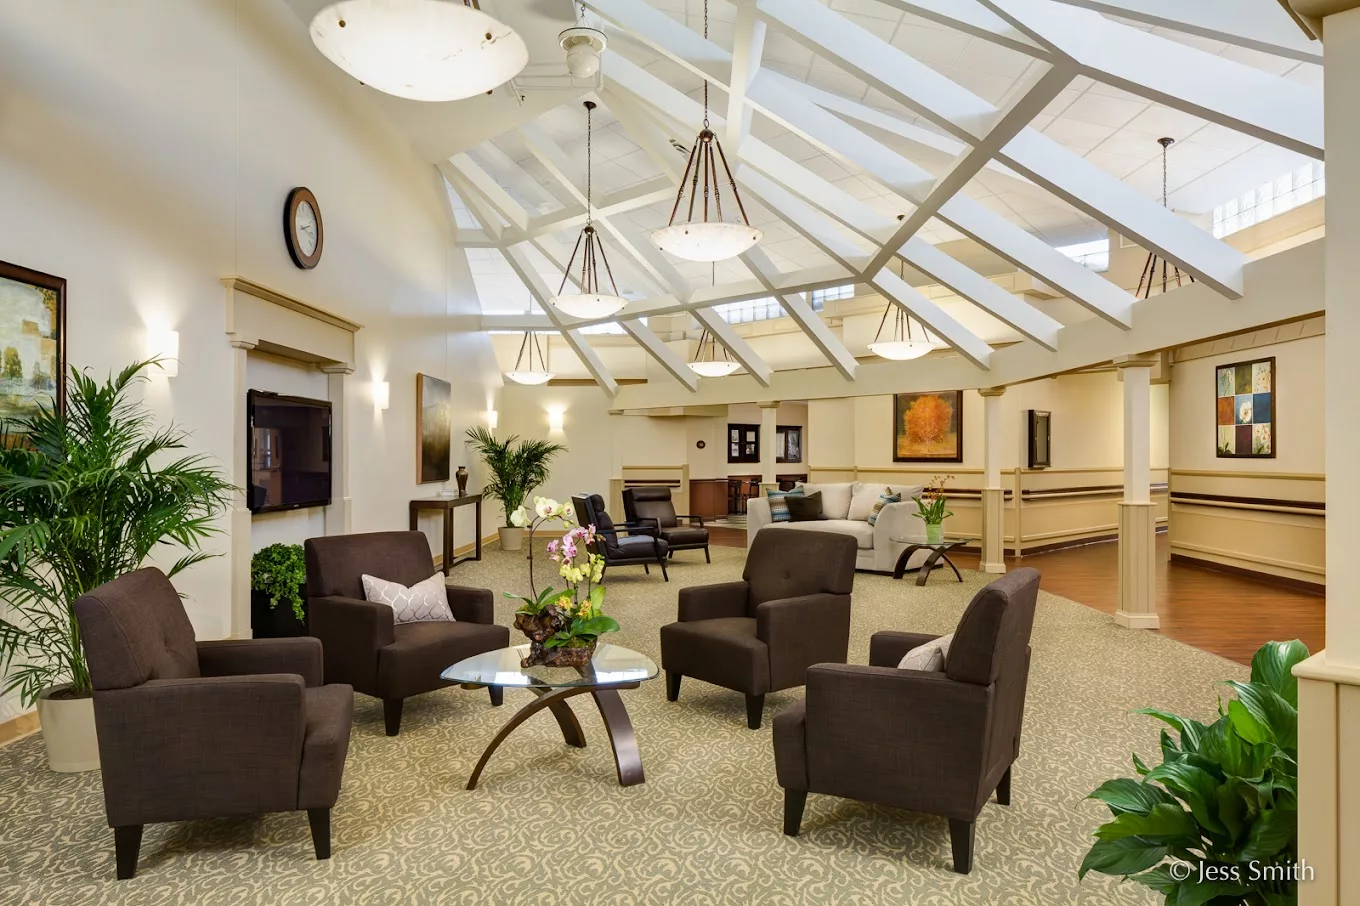


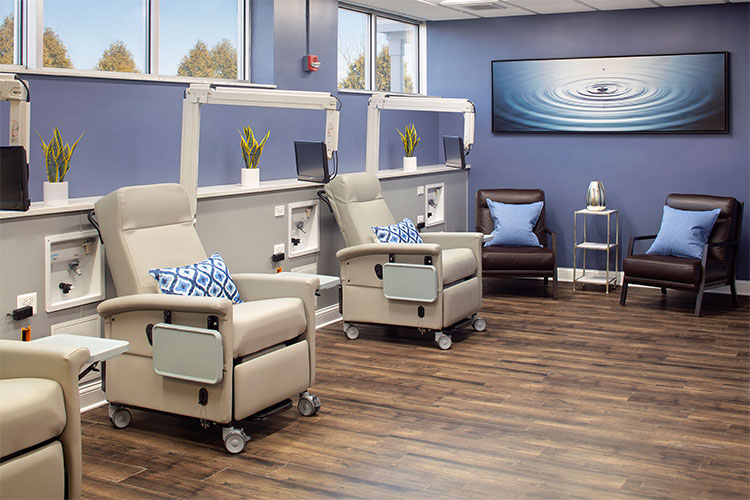

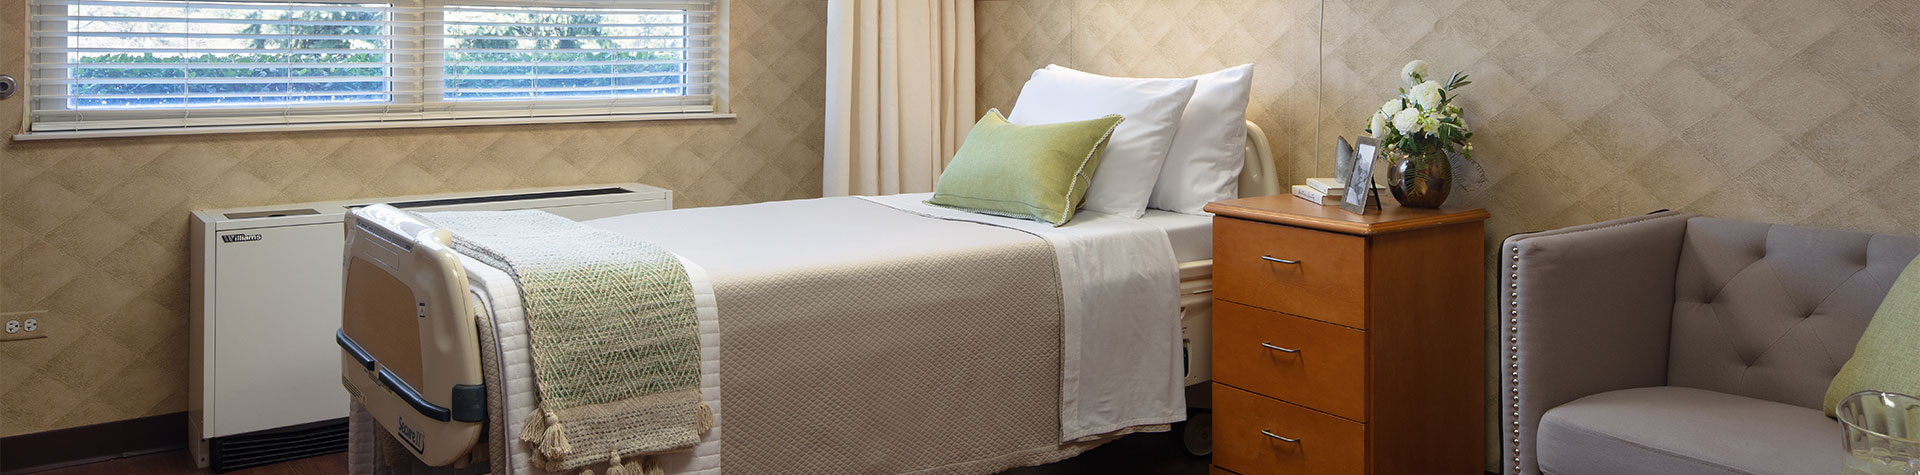


Bella Terra Morton Grove is a cozy and comforting home that provides seniors with everything they need to thrive in their golden years. The on-site medical services are unparalleled, including state-of-the-art hemodialysis and individualized treatment for kidney disease. Plus, the lush 6-acre campus is filled with greenery and offers stylishly appointed rooms that are bright and inviting – truly a home away from home. For seniors who need specialized care, the team of professionals offers cardio care, pulmonary care, and wound care. With 24-hour support from specialty-trained staff, residents can rest easy knowing they’re in good hands. The facility also offers a variety of short-term and specialized therapies.
Residents can keep themselves occupied with salon services, spacious outdoor areas, and a well-stocked library. The spacious suites can also be personalized to fit individual needs and preferences. At Bella Terra Morton Grove, seniors not only find a secure home but also the perfect backdrop for a vibrant and colorful lifestyle. It’s a place where they can truly flourish and enjoy the best that their retirement years have to offer.
 Official CMS rating based on health inspections, staffing and quality measures.
Official CMS rating based on deficiencies found during state health inspections.
Official CMS rating based on nurse staffing hours per resident per day.
Official CMS rating based on clinical outcomes for residents.
Average daily nursing hours per resident (adjusted for acuity). Higher values indicate more nursing time per resident.
Hours of care per resident per day, broken down by staff type. Data from CMS Medicare.
Registered nurse hours per resident per day.
Official CMS rating based on health inspections, staffing and quality measures.
Official CMS rating based on deficiencies found during state health inspections.
Official CMS rating based on nurse staffing hours per resident per day.
Official CMS rating based on clinical outcomes for residents.
Average daily nursing hours per resident (adjusted for acuity). Higher values indicate more nursing time per resident.
Hours of care per resident per day, broken down by staff type. Data from CMS Medicare.
Registered nurse hours per resident per day.
May offer a more intimate, personalized care environment.
Occupancy is moderate, suggesting balanced demand.
This home supports both short-term rehab and long-term care, with residents staying for a wide range of durations.
35% of new residents, usually for short-term rehab.
51% of new residents, often for short stays.
13% of new residents, often for long-term daily care.
The portion of the home's budget spent on staff, including nurses, caregivers, and other employees who support care and operations.
All remaining costs needed to run the home, such as food, utilities, building maintenance, supplies and administrative expenses.
Bella Terra Morton Grove is legally operated by WELLSHIRE MORTON GROVE.
In Illinois, the Department of Public Health, Office of Health Care Regulation conducts annual unannounced surveys to assess compliance with state and federal healthcare facility standards.
1 visits/inspections triggered by complaints
1 other visits
Deficiencies indicate regulatory issues. A higher number implies the facility had several areas requiring improvement.
The most recent inspection on July 22, 2025, identified a deficiency for operating without an active assisted living license after it expired on June 25, 2025. Earlier inspections were not provided, so broader inspection patterns cannot be assessed from the available reports. The main issue noted was related to licensing and administrative compliance rather than resident care or safety. No fines, enforcement actions, or complaint investigations were listed in the available reports. The facility submitted a plan of correction addressing delays in license renewal processing, indicating steps toward resolving the licensing issue.
Illinois average 10.4
Last Health inspection on Apr 2025
Health citations are formal notices following inspections when they fail to comply with safety and care standards.
23 of 38 citations resulted from standard inspections; 11 of 38 resulted from complaint investigations; and 4 of 38 came from combined inspections (standard and complaint).
Illinois average: 0.7
Illinois average: 3.6
Data sourced from CMS Health Deficiencies reports. Citation severity codes range from A (least serious) to L (most serious). Immediate Jeopardy (J-L) citations indicate situations where the facility's noncompliance has placed residents at risk of death or serious harm.
Nursing Home 24/7 care needed
Assisted Living For seniors needing help with daily tasks but not full-time nursing.
Nursing Home 24/7 care needed
Assisted Living For seniors needing help with daily tasks but not full-time nursing.
Nursing Home 24/7 care needed
Assisted Living For seniors needing help with daily tasks but not full-time nursing.
Nursing Home 24/7 care needed
Assisted Living For seniors needing help with daily tasks but not full-time nursing.
Nursing Home 24/7 care needed
Assisted Living For seniors needing help with daily tasks but not full-time nursing.
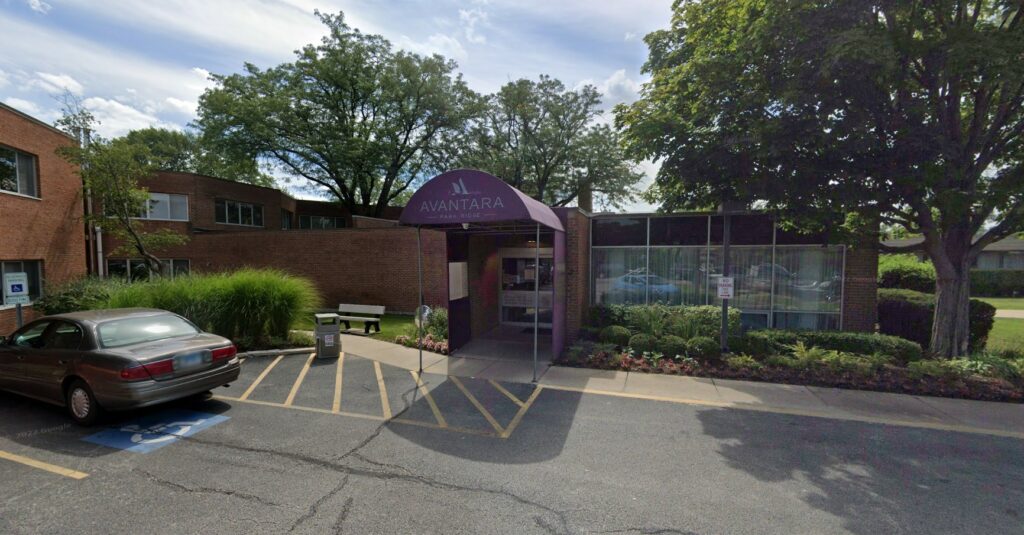 Avantara Park Ridge
 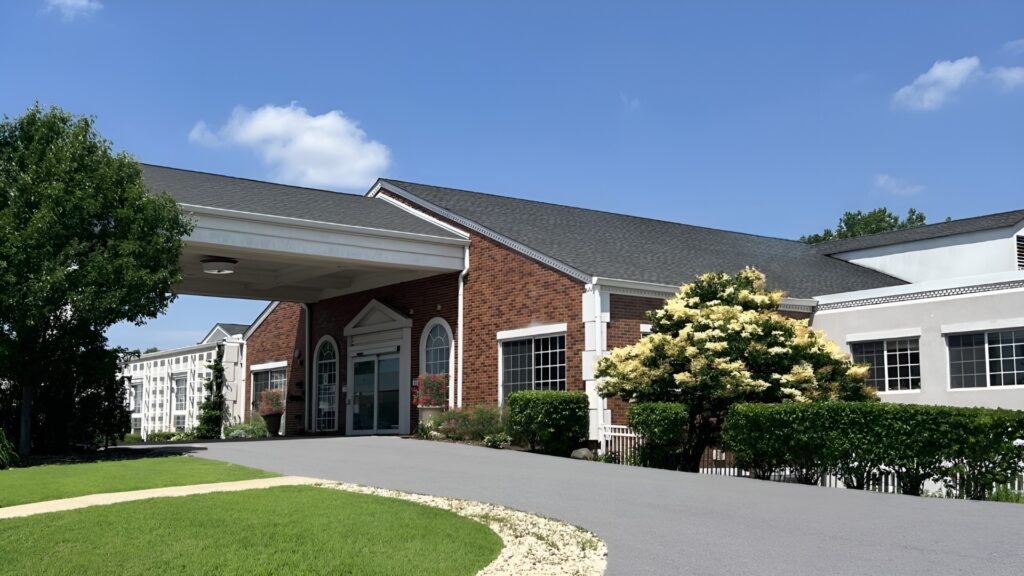 Avantara Long Grove
 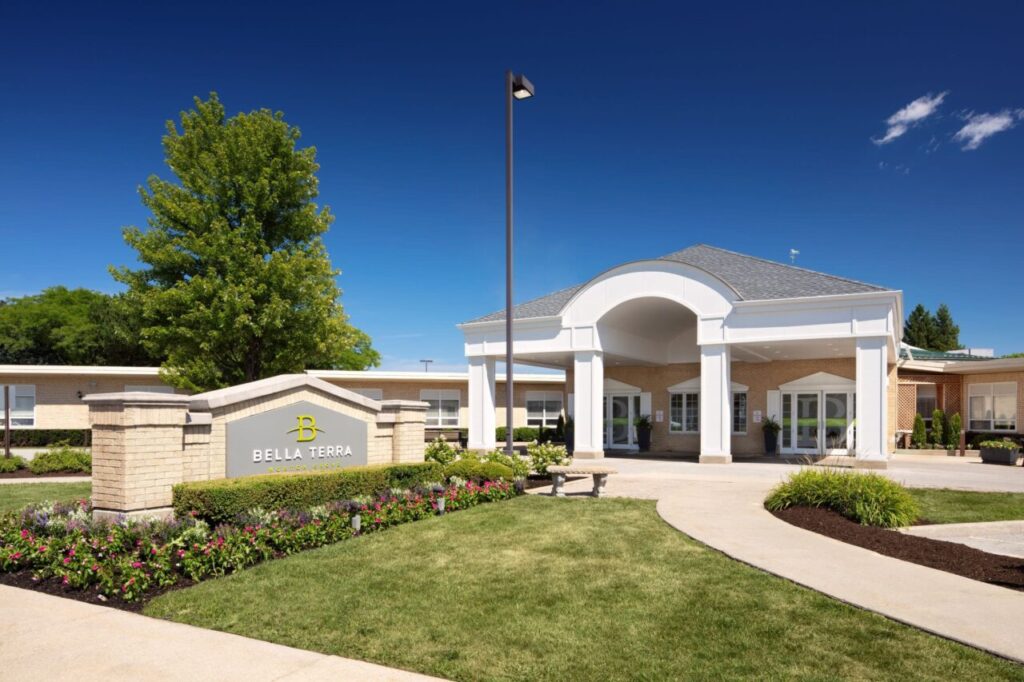 Bella Terra Morton Grove
![]() 1.0 miles from city center — 3.28 miles to nearest hospital (Resurrection Medical Center)
1.0 miles from city center — 3.28 miles to nearest hospital (Resurrection Medical Center)
![]() 8425 Waukegan Road, Morton Grove, IL 60053
8425 Waukegan Road, Morton Grove, IL 60053
Add your location
Source: CMS Payroll-Based Journal (Q2 2025)
| Role ⓘ | Count ⓘ | Avg Shift (hrs) ⓘ | Uses Contractors? ⓘ |
|---|---|---|---|
| Registered Nurse | 79 | 8.3 | Yes |
| Licensed Practical Nurse | 44 | 7.1 | Yes |
| Certified Nursing Assistant | 133 | 7.5 | Yes |
| Role ⓘ | Employees ⓘ | Contractors ⓘ | Total Staff ⓘ | Total Hours ⓘ | Days Worked ⓘ | % of Days ⓘ | Avg Shift (hrs) ⓘ |
|---|---|---|---|---|---|---|---|
| Certified Nursing Assistant | 64 | 69 | 133 | 29,255 | 91 | 100% | 7.5 |
| Licensed Practical Nurse | 22 | 22 | 44 | 10,377 | 91 | 100% | 7.1 |
| Registered Nurse | 12 | 67 | 79 | 7,564 | 91 | 100% | 8.3 |
| Other Dietary Services Staff | 9 | 0 | 9 | 2,712 | 91 | 100% | 7.4 |
| RN Director of Nursing | 4 | 0 | 4 | 1,734 | 90 | 99% | 5.9 |
| Clinical Nurse Specialist | 4 | 0 | 4 | 1,342 | 89 | 98% | 6.3 |
| Dental Services Staff | 2 | 0 | 2 | 994 | 89 | 98% | 5.6 |
| Physical Therapy Aide | 0 | 4 | 4 | 555 | 68 | 75% | 7.3 |
| Nurse Practitioner | 1 | 0 | 1 | 504 | 89 | 98% | 5.7 |
| Mental Health Service Worker | 1 | 0 | 1 | 488 | 86 | 95% | 5.7 |
| Qualified Social Worker | 0 | 9 | 9 | 483 | 71 | 78% | 6.1 |
| Speech Language Pathologist | 0 | 2 | 2 | 473 | 65 | 71% | 7.3 |
| Administrator | 1 | 0 | 1 | 472 | 84 | 92% | 5.6 |
| Physical Therapy Assistant | 0 | 5 | 5 | 453 | 60 | 66% | 6.2 |
| Respiratory Therapy Technician | 0 | 3 | 3 | 452 | 61 | 67% | 7.4 |
| Dietitian | 1 | 0 | 1 | 284 | 52 | 57% | 5.5 |
Source: CMS Long-Term Care Facility Characteristics (Data as of Jan 2026)
Residents meet regularly to discuss policies, care quality, and activities
Organized group of residents that meets regularly to discuss facility policies, quality of life, and activities.
Data sourced from CMS Long-Term Care Facility Characteristics quarterly report. Payer mix reflects the current resident census by primary payment source.
These measures show how residents usually do over time at this home, based on health outcomes and preventive care.
Illinois average: 9.7
Illinois average: 18.6
Illinois average: 15.5%
Illinois average: 18.4%
Illinois average: 21.6%
Illinois average: 3.4%
Illinois average: 5.3%
Illinois average: 1.8%
Illinois average: 6.5%
Illinois average: 48.1%
Illinois average: 20.2%
Illinois average: 89.2%
Illinois average: 91.6%
Illinois average: 2.05
Illinois average: 2.25
Illinois average: 68.3%
Illinois average: 2.3%
Illinois average: 63.0%
Illinois average: 26.2%
Illinois average: 14.0%
Illinois average: 0.8%
Illinois average: 53.7%
Illinois average: 50.6%
Quality measures are calculated from Minimum Data Set (MDS) assessments. For most measures, lower percentages indicate better care quality.
Federal penalties imposed by CMS for regulatory violations, including civil money penalties (fines) and denials of payment for new Medicare/Medicaid admissions.
Source: CMS Penalties Database (Data as of Jan 2026)
Illinois average: $143K
Illinois average: 3.0
Illinois average: 1.1
Penalties are imposed by CMS for violations of federal nursing home regulations.
Last updated: Jan 2026
Historical financial and operational data for Bella Terra Morton Grove based on CMS SNF Cost Reports.
Loading trend charts...
Care Cost Calculator: See Prices in Your Area
Nursing Home Data Explorer
Don’t Wait Too Long: 7 Red Flag Signs Your Parent Needs Assisted Living Now
The True Cost of Assisted Living in 2025 – And How Families Are Paying For It
Understanding Senior Living Costs: Pricing Models, Discounts & Financial Assistance

Touring a community? Use this expert-backed checklist to stay organized, ask the right questions, and find the perfect fit.
We'll send you a PDF version of the touring checklist.