Bethany Home Retirement Center
Nursing Home, Independent Living, Memory Care & Nursing Care · Dubuque, IA
CMS overall rating Info CMS (the Centers for Medicare & Medicaid Services) is the federal agency that rates nursing home quality. Its Overall Rating runs from 1 to 5 stars, combining health inspections, staffing, and quality measures, with inspections weighted most heavily.

Bethany Home Retirement Center

Nursing Home, Independent Living, Memory Care & Nursing Care · Dubuque, IA
CMS overall rating Info CMS (the Centers for Medicare & Medicaid Services) is the federal agency that rates nursing home quality. Its Overall Rating runs from 1 to 5 stars, combining health inspections, staffing, and quality measures, with inspections weighted most heavily.
Calculator: See prices in your area
Bethany Home Retirement Center accepts Medicare, Medicaid, and private pay.

Overview of Bethany Home Retirement Center

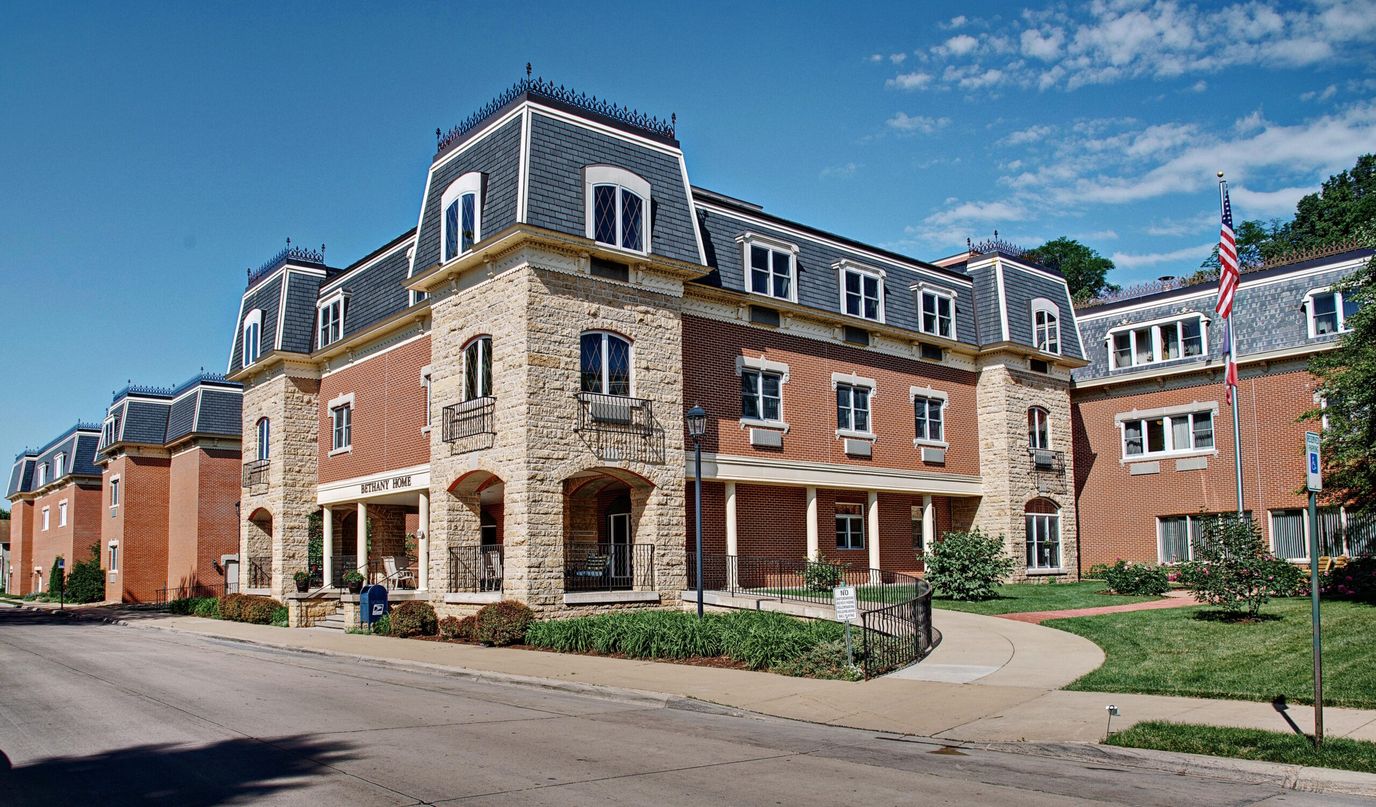
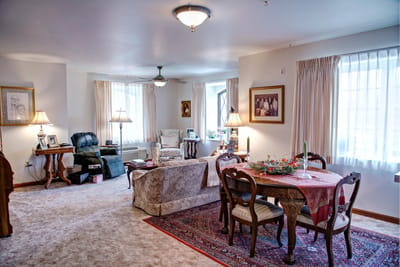
Surrounded by thriving local amenities in Dubuque, IA, Bethany Home Retirement Center is an outstanding community that offers independent living, memory care, and rehabilitation. Featuring purposely built and spacious one- and two-bedroom floor plans, the community ensures residents are comfortable and safe. Housekeeping, laundry, and maintenance are taken care of, providing residents more time to do the things they love.

A variety of recreational activities and engaging programs are conducted to keep residents active and socially connected. With a food service program, residents enjoy delightful and healthy meals that cater to their dietary needs and preferences. The community also offers wellness services to improve residents’ living experiences. Residents are guaranteed the finest retirement experience amidst the community’s vibrant and welcoming environment.

Quality ratings

Measured by Centers for Medicare & Medicaid Services (CMS)

Overall rating Info The Overall CMS Rating combines results from health inspections, staffing levels and quality measures. Health inspections carry the most weight. Staffing and quality scores can increase or decrease the final rating based on performance compared to state and national standards.
▲ 63.2% Above IA avg. ▲ 63.2% Above IA avg.IA average: 3.1Click the badge to see the full State ranking.Click here to see the full State ranking.
Health Inspection Info Based on the results of the facility's three most recent standard inspections and any complaint investigations. CMS reviews the number, scope, and severity of deficiencies, with more recent findings weighted more heavily.
▲ 75.3% Above IA avg. ▲ 75.3% Above IA avg.IA average: 2.9Click the badge to see the full State ranking.Click here to see the full State ranking.
Staffing Info Measures average nursing staff hours per resident per day, including Registered Nurses (RNs) and total nursing staff. Ratings are adjusted based on the level of care residents require and are compared to state and national benchmarks.
▲ 40.9% Above IA avg. ▲ 40.9% Above IA avg.IA average: 3.5Click the badge to see the full State ranking.Click here to see the full State ranking.
Quality Measures Info Based on clinical and physical health indicators reported to CMS, such as hospital readmissions, falls, pressure ulcers, and improvements in mobility. These measures reflect how well residents' health needs are being managed.
▲ 22.2% Above IA avg. ▲ 22.2% Above IA avg.IA average: 3.3Click the badge to see the full State ranking.Click here to see the full State ranking.

Staffing hours breakdown

Info Daily nursing hours per resident by staff type, reported to CMS. Higher is generally better — compare this facility to state and national averages to see where staffing stands.

Hours per resident per day — compared to Iowa state averages

Total nursing care / resident Info This home is ranked 120th out of 249 homes in Iowa for nurse hours. Total adjusted nursing hours per resident per day, combining RN, LPN, and aide time. CMS adjusts this for case-mix so facilities can be fairly compared.
4h 11m per day
Rank #120 / 249Nurse hours — State benchmarkedThis home is ranked 120th out of 249 homes in Iowa. Shows adjusted nurse hours per resident per day benchmarked to the Iowa average, with a ranking across 249 Iowa facilities. More hours mean more direct care. The national average is about 3.5 hrs; below 3.0 is a red flag.Rankings are based only on facilities in Iowa that report data for that category. Facilities without available data are excluded from the ranking.Click the rank badge to see the full State ranking.Click here to see the full State ranking.
This facility Iowa avg (4h 18m per day)
vs Iowa avg
-2%

2 of 6 metrics below state avg

Standout metric Registered Nurse (RN) is +28% above state avg
Staff typeHours / Day / Residentvs state avg
Registered Nurse (RN) Info RNs hold the highest nursing license and can assess residents, interpret test results, and direct care plans. More RN hours per day often signals stronger clinical oversight and faster response to health changes. 57m per day ▲ 28% State avg: 44m per day · National avg: 41m per day
LPN / LVN Info Licensed Practical Nurses (LPNs) or Licensed Vocational Nurses (LVNs) deliver routine hands-on care — medication administration, wound dressing, and monitoring vital signs. They work under RN supervision and make up a large share of daily bedside care. 25m per day ▼ 25% State avg: 34m per day · National avg: 52m per day
Nurse Aide Info Certified Nurse Aides (CNAs) provide the most direct day-to-day assistance: bathing, dressing, feeding, and mobility. Nurse aide hours are typically the largest staffing category and directly affect residents' quality of life. 3h 0m per day ▲ 20% State avg: 2h 30m per day · National avg: 2h 20m per day
Weekend Total Nursing Info Combined nursing hours (RN + LPN + Nurse Aide) per resident per day on weekends. Staffing often drops on weekends — this figure reveals whether the facility maintains adequate coverage outside of weekday hours. 3h 50m per day ▲ 14% State avg: 3h 23m per day · National avg: 3h 27m per day
Physical Therapist Info Hours per resident per day provided by licensed Physical Therapists (PTs) or PT Assistants. PT services help residents recover mobility after injury or illness and are especially important for post-acute (short-stay) rehabilitation. 1m per day ▼ 38% State avg: 2m per day · National avg: 4m per day
Weekend RN Info Registered nurse hours specifically on weekends. Facilities sometimes reduce RN presence on Saturdays and Sundays — a low weekend RN figure compared to weekday hours can indicate reduced clinical oversight when most administrative staff are absent. 35m per day ▲ 17% State avg: 30m per day · National avg: 29m per day

Capacity and availability

Avg. Length of Stay
519 days
Bed community size
66-bed community Rank #182 / 407Bed count — State benchmarkedThis home is ranked 182nd out of 407 homes in Iowa. Shows this facility's certified or reported bed count compared to other Iowa facilities. Larger communities may offer more amenities, programs, and on-site services for residents and families.Rankings are based only on facilities in Iowa that report data for that category. Facilities without available data are excluded from the ranking.Click the rank badge to see the full State ranking.Click here to see the full State ranking.
A moderately sized community that may balance personal attention with shared amenities and social activities.
Walk Score
Walk Score: 69 / 100 Rank #103 / 528Walk Score — State benchmarkedThis home is ranked 103rd out of 528 homes in Iowa. Shows how walkable this facility's neighborhood is compared to the average Walk Score across Iowa facilities. Higher scores benefit residents, families, and staff.Rankings are based only on facilities in Iowa that report data for that category. Facilities without available data are excluded from the ranking.Click the rank badge to see the full State ranking.Click here to see the full State ranking.
Moderately walkable. Some errands can be accomplished on foot, with a mix of nearby amenities.

About this community

Occupancy

Occupancy rate
100%
Rank #1 / 407Occupancy rate — State benchmarkedThis home is ranked 1st out of 407 homes in Iowa. Shows this facility's occupancy rate versus the Iowa average, with its Statewide rank out of 407. Higher occupancy signals strong local demand and financial stability.Rankings are based only on facilities in Iowa that report data for that category. Facilities without available data are excluded from the ranking.Click the rank badge to see the full State ranking.Click here to see the full State ranking.
Higher than the Iowa average: 75.4%
Occupied beds
66 / 66
Average occupied beds in Iowa homes 51 beds

License Details

Facility TypeFree Standing Nursing Facility / Skilled Nursing Facility
StatusActive
IssuanceMarch 19, 1959
ExpirationMarch 19, 2027
CountyDubuque
License Number310307
Year Opened03/19/1959
CMS Certification Number165584

Ownership & Operating Entity

Bethany Home Retirement Center is administered by Susan Westmark.

Therapy & Rehabilitation

1 service
Rehabilitation Services

Staffing & Medical

1 service
24-Hour Staffing

Contact Information

Amenities & Lifestyle

Fully-Equipped Wellness Center
Robust Social Calendar
Delicious Dining
Groundskeeping And Maintenance
Timely Housekeeping And Laundry Services
24/7 On-Site Nursing Staff
Specific ProgramsHealthcare, Therapy/Rehabilitation, Food Service, Groundskeeping, Housekeeping/Laundry

Contact Bethany Home Retirement Center

Inspection History

In Iowa, the Department of Inspections, Appeals, and Licensing conducts unannounced health and safety surveys to monitor compliance and protect residents in long-term care settings.

Since 2020 · 6 years of data 6 deficiencies 12 inspections

Inspection Scorecard Info This scorecard compares key inspection, deficiency, and complaint metrics at this facility against the Iowa state average. Metrics rated ≥15% worse than average are highlighted in red; those ≥15% better are highlighted in green.

Since 2020 vs. Iowa state average
Overall vs. IA average 0 Worse No metrics in this bucket. 4 Better Metrics better than Iowa average:
• Total deficiencies (78% below)
• Deficiencies per year (78% below)
• Deficiencies per inspection (72% below)
• Total inspections (20% below)
Latest Inspection August 5, 2025

Deficiencies Info Deficiencies are formal regulatory issues recorded during state inspections.

This FacilityIA Averagevs. IA Avg
Total deficiencies Info Formal regulatory issues recorded by inspectors across all inspection types. 627 This facility has 78% fewer total deficiencies than a typical Iowa assisted living residence (6 vs. IA avg 27).↓ 78% better
Deficiencies per year Info Average deficiencies per year since 2020. 14.5 This facility has 78% fewer deficiencies per year than a typical Iowa assisted living residence (1 vs. IA avg 4.5).↓ 78% better
Deficiencies per inspection Info Average deficiencies per inspection. 0.51.8 This facility has 72% fewer deficiencies per inspection than a typical Iowa assisted living residence (0.5 vs. IA avg 1.8).↓ 72% better

Inspections Info State inspections evaluate whether the facility meets health and safety standards.

This FacilityIA Averagevs. IA Avg
Total inspections Info Combined count of all routine and focused inspections. Excludes complaint investigations. 1215 This facility has 20% fewer total inspections than a typical Iowa assisted living residence (12 vs. IA avg 15).↓ 20% better

Inspection Reports Summary Info An editor-reviewed summary of the themes and findings across this facility's recent inspection reports.

  • The most recent inspection on August 5, 2025 found the facility in substantial compliance following a complaint investigation.
  • The March 30, 2023 inspection found two deficiencies related to medication administration and dietary staff food safety compliance, but the complaint was not substantiated.
  • The December 14, 2021 survey identified four deficiencies including immediate jeopardy for inadequate resident supervision leading to elopement and medication errors.

Health Inspection History

Inspections since 2023
Total health inspections 1

Iowa average 4.9


Last Health inspection on Mar 2023

Total health citations
2 Rank #6 / 250Health citations — State benchmarkedThis home is ranked 6th out of 250 homes in Iowa. Shows this facility's total health deficiency citations benchmarked to the Iowa State average, with a ranking across all 250 IA facilities. Lower citation counts earn a better rank.Rankings are based only on facilities in Iowa that report data for that category. Facilities without available data are excluded from the ranking.Click the rank badge to see the full State ranking.Click here to see the full State ranking.

Iowa average 21.7

Citations per inspection
2 Rank #23 / 250Citations per inspection — State benchmarkedThis home is ranked 23rd out of 250 homes in Iowa. Shows average deficiency citations per CMS inspection for this facility versus the Iowa mean across 250 facilities with citation data. Lower is better.Rankings are based only on facilities in Iowa that report data for that category. Facilities without available data are excluded from the ranking.Click the rank badge to see the full State ranking.Click here to see the full State ranking.

Iowa average 4.11


Health citations are formal notices following inspections when they fail to comply with safety and care standards.

All 2 citations resulted from standard inspections.

Breakdown of citation severity (last 3 years)
Critical health citations
0
100% better than Iowa average

Iowa average: 0.6


Serious health citations
0
100% better than Iowa average

Iowa average: 0.9

0 critical citations Iowa average: 0.6

0 serious citations Iowa average: 0.9

2 moderate citations Iowa average: 19.7

0 minor citations Iowa average: 0.5
Citations history (last 3 years)
Nutrition moderate citation Mar 30, 2023
Corrected

Care Planning moderate citation Mar 30, 2023
Corrected

Staffing Data

Reporting period: October 1 – December 31, 2025 (Q4 2025). Source: CMS Payroll-Based Journal report.

Total staff 120
Employees 96
Contractors 24
Staff to resident ratio 1.82 : 1
11% fewer staff per resident than Iowa average
Iowa average ratio: 2.05 : 1 Iowa average ratio: 2.05 : 1See full Iowa ranking
Avg staff/day 46
Average shift 6.9 hours
7% worse than Iowa average
Iowa average: 7.4 hours Iowa average shift: 7.4 hoursSee full Iowa ranking
Total staff hours (quarter) 29,008

Nursing staff breakdown

Q4 2025 · Oct 1 – Dec 31 More info This data comes from the CMS Payroll-Based Journal report covering October 1 – December 31, 2025.
Registered Nurse

Manages medical care and health needs.

RN Staff Info All 14 RN Staff are full-time employees. No contractors work on this role. 14
Average shift length Info Average shift length. Calculated as total hours divided by days worked and average staff per day. 7.4 hours
Licensed Practical Nurse

Assists with medical care and medications.

LPN Staff Info 9 total: 8 full-time employees and 1 contractor. 9
Average shift length Info Average shift length. Calculated as total hours divided by days worked and average staff per day. 7.4 hours
Certified Nursing Assistant

Helps with daily care and mobility.

CNA Staff Info 73 total: 66 full-time employees and 7 contractors. 73
Average shift length Info Average shift length. Calculated as total hours divided by days worked and average staff per day. 6.9 hours

Contractor staffing

Q4 2025 · Oct 1 – Dec 31 More info This data comes from the CMS Payroll-Based Journal report covering October 1 – December 31, 2025.

Total hours from contractors

4%

1,160 contractor hours this quarter

Certified Nursing Assistant: 7 Respiratory Therapy Technician: 4 Qualified Social Worker: 3 Speech Language Pathologist: 3 Physical Therapy Aide: 2 Occupational Therapy Assistant: 2 Licensed Practical Nurse: 1 Occupational Therapy Aide: 1 Physical Therapy Assistant: 1

Staff by category

Q4 2025 · Oct 1 – Dec 31 More info This data comes from the CMS Payroll-Based Journal report covering October 1 – December 31, 2025.
Certified Nursing Assistant6677317,99792100%6.9
Registered Nurse140144,41892100%7.4
Licensed Practical Nurse8192,53592100%7.4
Nurse Practitioner2027966166%7.7
Other Dietary Services Staff2027257379%6.5
Clinical Nurse Specialist1014395964%7.4
Mental Health Service Worker1014345964%7.4
Dietitian1014276065%7.1
Administrator1014035459%7.5
Physical Therapy Aide0221695155%3.3
Occupational Therapy Aide0111402527%5.6
Respiratory Therapy Technician0441383639%3.8
Qualified Social Worker0331276166%2.1
Speech Language Pathologist0331193639%3.2
Physical Therapy Assistant011742022%3.7
Occupational Therapy Assistant022682932%2.3
73 Certified Nursing Assistant
% of Days 100%
14 Registered Nurse
% of Days 100%
9 Licensed Practical Nurse
% of Days 100%
2 Nurse Practitioner
% of Days 66%
2 Other Dietary Services Staff
% of Days 79%
1 Clinical Nurse Specialist
% of Days 64%
1 Mental Health Service Worker
% of Days 64%
1 Dietitian
% of Days 65%
1 Administrator
% of Days 59%
2 Physical Therapy Aide
% of Days 55%
1 Occupational Therapy Aide
% of Days 27%
4 Respiratory Therapy Technician
% of Days 39%
3 Qualified Social Worker
% of Days 66%
3 Speech Language Pathologist
% of Days 39%
1 Physical Therapy Assistant
% of Days 22%
2 Occupational Therapy Assistant
% of Days 32%

Penalties and fines

Federal penalties imposed by CMS for regulatory violations, including civil money penalties (fines) and denials of payment for new Medicare/Medicaid admissions.

Source: CMS Penalties Database

No penalties in the past 3 years

No civil money penalties or payment denials were reported in the last 3 years.

Quality of care over time

These measures show how residents usually do over time at this home, based on health outcomes and preventive care.

High-risk clinical events score Info A composite score based on pressure ulcers, falls with injury, weight loss, walking ability decline, and activities of daily living decline. 7.0
32% better than Iowa average

Iowa average: 10.2

Functional decline score Info A composite score based on activities of daily living decline, walking ability decline, and incontinence. 13.7
37% better than Iowa average

Iowa average: 21.6

Long-stay resident measures
Need for Help with Daily Activities Increased Info Percent of long-stay residents whose need for help with daily activities has increased 11.8%
37% better than Iowa average

Iowa average: 18.8%

Walking Ability Worsened Info Percent of long-stay residents whose ability to move independently worsened 9.4%
52% better than Iowa average

Iowa average: 19.7%

Low Risk Residents with Bowel/Bladder Incontinence Info Percent of low risk long-stay residents who lose control of their bowels or bladder 19.9%
24% better than Iowa average

Iowa average: 26.2%

Falls with Major Injury Info Percent of long-stay residents experiencing one or more falls with major injury 2.8%
22% better than Iowa average

Iowa average: 3.6%

High Risk Residents with Pressure Ulcers Info Percent of long-stay high risk residents with pressure ulcers 6.9%
58% worse than Iowa average

Iowa average: 4.4%

Urinary Tract Infection Info Percent of long-stay residents with a urinary tract infection 0.0%
100% better than Iowa average

Iowa average: 2.5%

Lost Too Much Weight Info Percent of long-stay residents who lose too much weight 4.0%
20% better than Iowa average

Iowa average: 5.0%

Depressive Symptoms Info Percent of long-stay residents who have depressive symptoms 0.0%
100% better than Iowa average

Iowa average: 3.9%

Antipsychotic Use Info Percent of long-stay residents who received an antipsychotic medication 15.5%
19% better than Iowa average

Iowa average: 19.0%

Pneumococcal Vaccine Info Percent of long-stay residents assessed and appropriately given the pneumococcal vaccine 100.0%
6% better than Iowa average

Iowa average: 94.4%

Influenza Vaccine Info Percent of long-stay residents assessed and appropriately given the seasonal influenza vaccine 95.5%
In line with Iowa average

Iowa average: 95.3%

Short-stay resident measures
Pneumococcal Vaccine Info Percent of short-stay residents assessed and appropriately given the pneumococcal vaccine 100.0%
18% better than Iowa average

Iowa average: 85.1%

Antipsychotic medication increase Info Percent of short-stay residents who newly received an antipsychotic medication 0.0%
100% better than Iowa average

Iowa average: 1.8%

Influenza Vaccine Info Percent of short-stay residents assessed and appropriately given the seasonal influenza vaccine 5.0%
93% worse than Iowa average

Iowa average: 73.3%

Breakdown by payment type

Medicare

34% of new residents, usually for short-term rehab.

Typical stay 1 - 2 months

Private pay

57% of new residents, often for short stays.

Typical stay 3 - 4 years

Medicaid

9% of new residents, often for long-term daily care.

Typical stay 4 - 5 years

Facility Characteristics

Source: CMS Long-Term Care Facility Characteristics (Data as of Jan 2026)

Total residents 66
Medicare
1
1.5% of residents
Medicaid
11
16.7% of residents
Private pay or other
54
81.8% of residents
Programs & Services
CCRC

Part of a Continuing Care Retirement Community offering multiple care levels

Finances and operations

Based on CMS SNF Cost Report for fiscal year ending in 12/2023.

For-profit
Corporation
Net patient revenue Info Net patient revenue — what the home actually collects for resident care, after contractual allowances, bad debt and discounts are subtracted from its gross charges (CMS cost report, Worksheet G-3). It covers resident care only; money the home earns from other sources is shown separately as "Other income."
$9.2M
Net patient income Info Net patient income: net patient revenue minus the home's total operating expenses. A positive figure means it earns more from resident care than it spends to deliver it; a negative figure means the opposite. It excludes non-operating "other income."
-$626.7K
For-profit Corporation
Net patient revenue Info Net patient revenue — what the home actually collects for resident care, after contractual allowances, bad debt and discounts are subtracted from its gross charges (CMS cost report, Worksheet G-3). It covers resident care only; money the home earns from other sources is shown separately as "Other income."
$9.2M Rank #70 / 251Revenue — State benchmarkedThis home is ranked 70th out of 251 homes in Iowa. Shows this facility's annual revenue compared to the Iowa average. Higher revenue generally means more resources for staffing and capital — read alongside Payroll %.Rankings are based only on facilities in Iowa that report data for that category. Facilities without available data are excluded from the ranking.Click the rank badge to see the full State ranking.Click here to see the full State ranking.
Net patient income Info Net patient income: net patient revenue minus the home's total operating expenses. A positive figure means it earns more from resident care than it spends to deliver it; a negative figure means the opposite. It excludes non-operating "other income."
-$626.7K
Other income Info Money the home earns outside of resident care — such as investments, grants, rentals and other non-operating sources (CMS cost report, Worksheet G-3). It is tracked separately from net patient revenue: it is not part of that figure, and it is not included in net patient income.
$608.3K
Payroll costs Info Staff salaries plus wage-related costs — benefits such as payroll taxes, health insurance and retirement — from the home's own accounting records (CMS cost report, Worksheet A). Contract or agency labor is counted separately, under other operating costs. Rank #38 / 251Payroll — State benchmarkedThis home is ranked 38th out of 251 homes in Iowa. Shows total annual staff payroll benchmarked to the Iowa average. Higher payroll investment relative to peers often signals better staffing and less reliance on cheaper contract labor.Rankings are based only on facilities in Iowa that report data for that category. Facilities without available data are excluded from the ranking.Click the rank badge to see the full State ranking.Click here to see the full State ranking.
$6.2M 68% of net patient revenue Info Payroll as a share of revenue: staff salaries and wage-related benefits divided by net patient revenue. A higher figure means more of each revenue dollar goes to staff pay. Rank #48 / 251Payroll % — State benchmarkedThis home is ranked 48th out of 251 homes in Iowa. Shows payroll as a percentage of revenue versus the Iowa average. Well-run Iowa facilities typically land around 61–69% — the top third Statewide. Below 25% may signal understaffing or heavy agency use — read with Staffing ratings.Rankings are based only on facilities in Iowa that report data for that category. Facilities without available data are excluded from the ranking.Click the rank badge to see the full State ranking.Click here to see the full State ranking.
Other operating costs Info Everything it costs to run the home apart from payroll — food, utilities, supplies, maintenance, contract labor and administration. Calculated as total operating expense minus payroll (staff salaries and wage-related benefits).
$3.6M
Total costs Info The home's total operating expense for the year — all the costs of running it, salaries included (CMS cost report, Worksheet G-3).
$9.8M

What does this home offer?

Housing options icon

Housing Options: 1 Bed / 2 Bed

Building type icon
Building type icon

Building Type: 3-story

Housekeeping icon
Housekeeping icon

Housekeeping Services

Social and recreational activities icon

Social and Recreational Activities

Wellness Programs icon

Wellness Programs

Who this home usually serves

TYPE OF STAY

Mix of rehab and long-term care

This home supports both short-term rehab and long-term care, with residents staying for a wide range of durations.

Most new residents arrive under private pay (57% of admissions), and a typical private pay stay runs around 3 - 4 years.

Admissions
47 total

Coverage residents most often arrive under.

Medicare 34%
Private pay 57%
Medicaid 9%
Discharges
51 total

Coverage residents most often leave under.

Medicare 35%
Private pay 50%
Medicaid 15%

Managed by Joan Hoerner

Administrator

Places of interest near Bethany Home Retirement Center

Address 1.2 miles from city center Info Estimated distance in miles from Dubuque's city center to Bethany Home Retirement Center's address, calculated via Google Maps.

Calculate Travel Distance to Bethany Home Retirement Center

Add your location

Address

Financial Assistance for
Assisted Living in Iowa

Bethany Home Retirement Center is located in Dubuque, Iowa.
Here are the financial assistance programs available to residents in Iowa.

Get Financial aid guidance

Elderly Waiver

Iowa Medicaid Elderly Waiver

Age 65+
General Iowa resident, Medicaid-eligible, nursing home-level care need.
Income Limits (2025) ~$2,829/month 300% FBR, individual
Asset Limits $2,000 (individual), $3,000 (couple).
IA

Rural focus; waitlists possible.

Benefits
In-home care (5-7 hours/day) Meals ($6/meal) Respite (240 hours/year) Adult day care ($60/day)

Iowa Family Caregiver Support

IA NFCSP

Age Caregiver of someone 60+
General Iowa resident.
Income Limits No strict limit; prioritizes low-income.
Asset Limits Not applicable.
IA

Limited slots; rural emphasis.

Benefits
In-home respite (4-6 hours/day) Adult day care (~$60/day) Short-term facility care (up to 5 days)

Medicare Savings Program (MSP)

Iowa Medicare Savings Program

Age 65+ or disabled
General Iowa resident, Medicare Part A/B.
Income Limits (2025) ~$2,510/month (QMB), ~$3,380/month (SLMB), ~$3,598/month (QI)—individual.
Asset Limits $9,430 (individual), $14,130 (couple).
IA

Three tiers; no waitlist.

Benefits
Covers Part B premiums ($174.70/month) Deductibles ($240/year) Copays (~20%)

Program of All-Inclusive Care for the Elderly (PACE)

Iowa PACE

Age 55+
General Iowa resident, nursing home-level care need, safe with PACE support.
Income Limits (2025) ~$2,829/month 300% FBR, Medicaid-eligible
Asset Limits $2,000 (individual), $3,000 (couple).
IA

Limited to western Iowa (e.g., Council Bluffs); expanding slowly.

Benefits
Personal care (5-7 hours/day) Medical care Meals Transportation Therapy Respite

VA Aid and Attendance (A&A) and Housebound Benefits

Iowa VA Aid and Attendance/Housebound

Age 65+ or disabled veteran/spouse
General Iowa resident, wartime service, need for ADL help (A&A) or homebound.
Income Limits (2025) Net income < ~$1,984/month (veteran with dependent, A&A); pension offsets income.
Asset Limits ~$155,356 net worth limit
IA

High veteran demand in rural areas.

Benefits
Cash (~$1,433-$2,642/month veteran, ~$951-$1,318 spouse) for care costs (e.g., in-home, assisted living)

Able Up Iowa

Able Up Iowa

Age 65+ or disabled
General Iowa resident, ability to repay loan, need for assistive tech or mods.
Income Limits (2025) No strict limit; must demonstrate repayment capacity.
Asset Limits Not specified; credit-based.
IA

Loans up to $25,000; statewide via Easterseals partnership.

Benefits
Loans for wheelchairs Ramps Walk-in tubs (~$500-$10,000 avg.) Reducing reliance on paid care

Frequently Asked Questions about Bethany Home Retirement Center

What neighborhood is Bethany Home Retirement Center in?

Bethany Home Retirement Center is in the Eagle Point District neighborhood of Dubuque.

Is Bethany Home Retirement Center in a walkable area?

Bethany Home Retirement Center has a walk score of 69. Moderately walkable. Some errands can be accomplished on foot, with a mix of nearby amenities.

What is the license number of Bethany Home Retirement Center?

According to IA state health department records, Bethany Home Retirement Center's license number is 310307.

When does Bethany Home Retirement Center's license expire?

According to IA state health department records, Bethany Home Retirement Center's license expires on March 19, 2027.

What is the occupancy rate at Bethany Home Retirement Center?

Bethany Home Retirement Center's occupancy is 100%.

What is the best email address for Bethany Home Retirement Center?

The team at Bethany Home Retirement Center can be reached at swestmark@bethanyhomedubuque.org.

Does Bethany Home Retirement Center operate as a for-profit or non-profit?

Bethany Home Retirement Center is registered as a for-profit in IA.

Guides for Better Senior Living

Care Cost Calculator: See Prices in Your Area

Nursing Home Data Explorer

Don’t Wait Too Long: 7 Red Flag Signs Your Parent Needs Assisted Living Now

The True Cost of Assisted Living in 2025 – And How Families Are Paying For It

Understanding Senior Living Costs: Pricing Models, Discounts & Financial Assistance