Bonterra Transitional Care and Rehabilitation

Nursing Home

Bonterra Transitional Care and Rehabilitation

2801 Felton Dr, Atlanta, GA 30344 View Map
Nursing Home
icon
Care Cost Calculator: See Prices in Your Area Care Cost Calculator: See Prices in Your Area icon
Overview of Bonterra Transitional Care and Rehabilitation

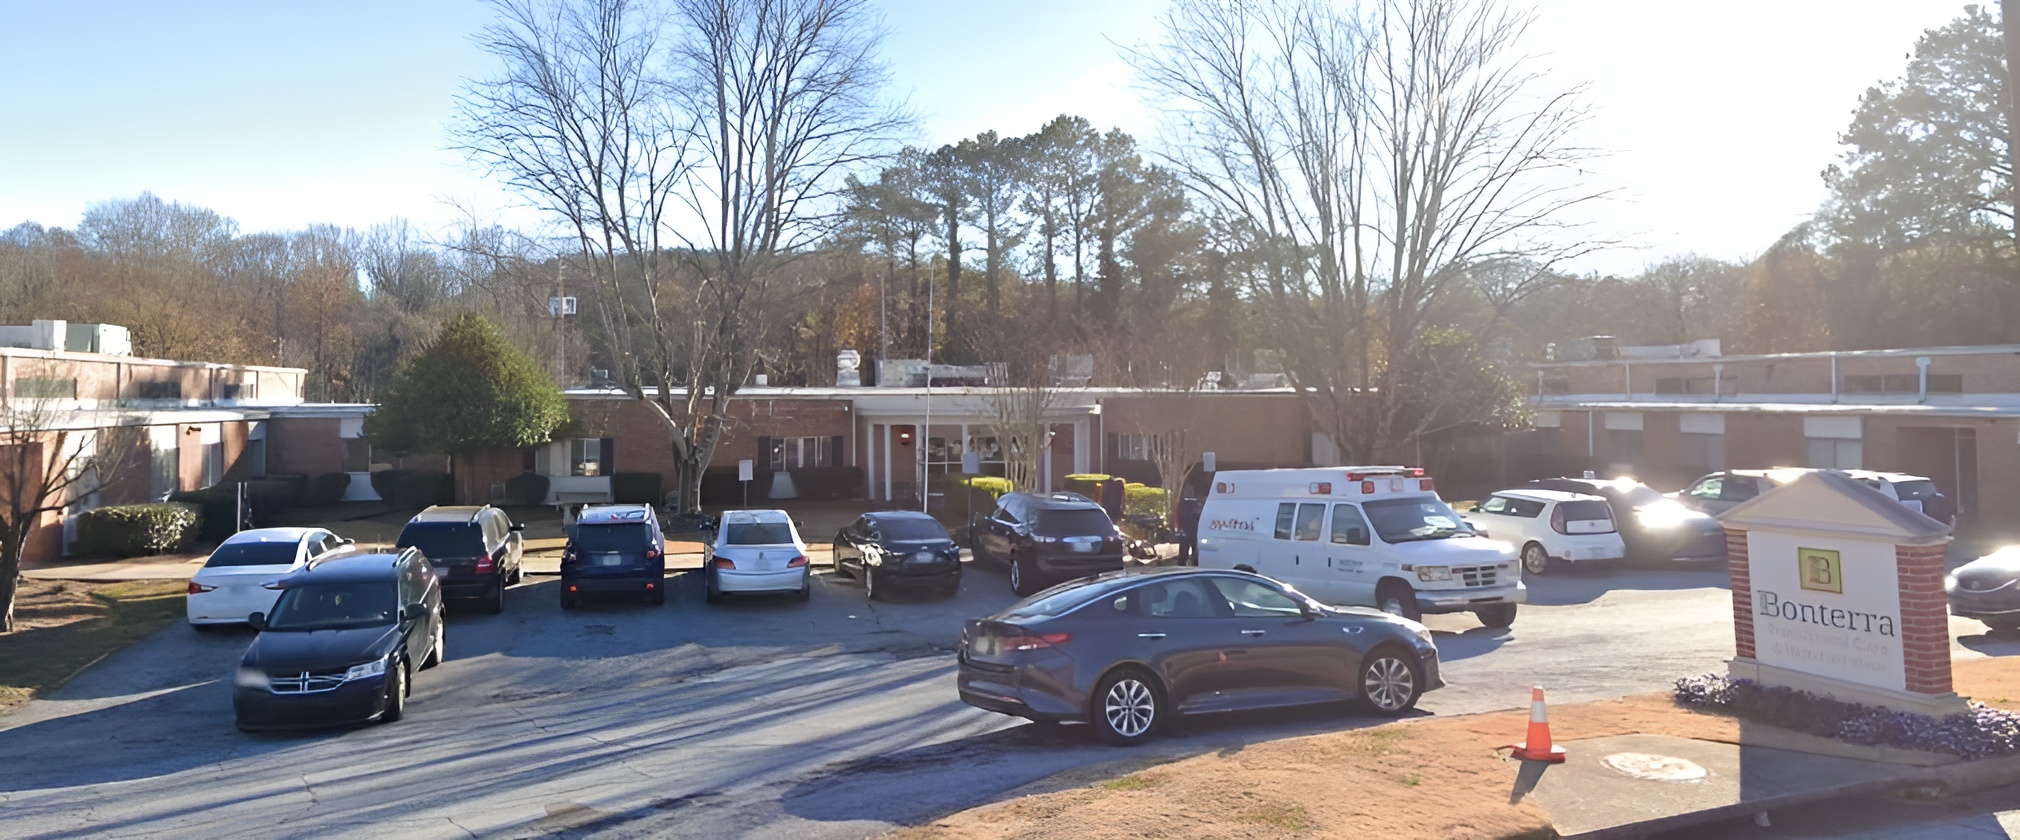
Bonterra Transitional Care and Rehabilitation is a distinct community, set in the thriving neighborhood of Atlanta, GA, that offers post-acute rehabilitation and skilled nursing. With a continuum of care, the community strives to accommodate a wide range of conditions to ensure residents receive the utmost care and attention they deserve. A compassionate and highly trained team attends to residents’ special needs around the clock to ensure their comfort and safety.

A jam-packed calendar of recreational activities and engaging events is conducted so residents can interact with their surroundings and live actively. Dietitian-approved meals are also provided to meet residents’ dietary needs and preferences. The community also offers therapy and clinical services to enhance residents’ living condition. Have the finest retirement experience while receiving the highest quality of care from a specially trained team.

(404) 767-7591

Quality ratings

Measured by Centers for Medicare & Medicaid Services (CMS)

Overall rating Info Official CMS rating based on health inspections, staffing and quality measures.
1/5
Georgia average: 2.6/5
Health Inspection Info Official CMS rating based on deficiencies found during state health inspections.
1/5
Georgia average: 2.8/5
Staffing Info Official CMS rating based on nurse staffing hours per resident per day.
1/5
Georgia average: 2.3/5
Quality Measures Info Official CMS rating based on clinical outcomes for residents.
2/5
Georgia average: 2.8/5

Nursing care per resident

Info Average daily nursing hours per resident (adjusted for acuity). Higher values indicate more nursing time per resident.
2h 55m per day

This home provides 18% less nursing time per resident than the state average.

Georgia average: 3h 33m per day

Staffing hours breakdown

Info Hours of care per resident per day, broken down by staff type. Data from CMS Medicare.
Staff type Facility State avg National avg
Registered Nurse (RN) Info Registered nurse hours per resident per day. 13m per day 30m per day 41m per day
LPN / LVN Info Licensed Practical Nurse / Licensed Vocational Nurse hours per resident per day. 1h 3m per day 56m per day 52m per day
Nurse Aide Info Nurse aide hours per resident per day. 1h 58m per day 2h 9m per day 2h 21m per day
Total Nursing (Weekend) Info Total number of nurse staff hours per resident per day on weekends. 2h 49m per day 3h 6m per day 3h 26m per day
Physical Therapist Info Physical therapist staff hours per resident per day. 3m per day 3m per day 4m per day
RN (Weekend) Info Registered nurse hours per resident per day on weekends. 10m per day 20m per day 29m per day

Capacity and availability

Medium-capacity home

Offers a balance of services and community atmosphere.

Total beds 118

This home usually has limited availability

Occupancy is moderate, suggesting balanced demand.

Similar demand to the Georgia average
Occupancy rate 94.7%
Residents per day (avg) 112
Occupancy rate
94.7%
Residents per day (avg)
112

Who this home usually serves

TYPE OF STAY

Primarily short stays

Residents typically stay for brief periods, with frequent admissions and discharges throughout the year.

Might be optimal for
Post-acute recovery Temporary care Transitional stays

Breakdown by payment type

Medicare

21% of new residents, usually for short-term rehab.

Typical stay 3 - 4 months

Private pay

79% of new residents, often for short stays.

Typical stay 9 - 10 months

Finances and operations

Proprietary home
Partnership
Home revenue
$14.1M
Operating loss
-$207.8K
Proprietary home Partnership
Home revenue
$14,126,342.00
Operating loss
$-207,835.00
Payroll costs Info The portion of the home's budget spent on staff, including nurses, caregivers, and other employees who support care and operations.
$5.3M
37.6% of revenue
Other operating costs Info All remaining costs needed to run the home, such as food, utilities, building maintenance, supplies and administrative expenses.
$8.9M
Total costs $14.3M
Bed community size
118-bed community
A larger shared setting that may offer more common spaces and organized community services.
Years in operation
39 years in operation
A longer operating history, which may indicate experience navigating regulations and delivering ongoing care.
Walk Score
Walk Score: 56 / 100
Moderately walkable. Some errands can be accomplished on foot, with a mix of nearby amenities.

About this community

Occupancy Rate
97%
Occupied Beds
114 of 118
Percentage of available beds currently in use by residents.
License Status
SNF/NF DUAL CERT
Facility Type
NURSING HOME
License Date
January 6, 1987

Additional licensing details

CMS Certification Number: 115555
County: FULTON

Ownership & operating entity

Bonterra Transitional Care and Rehabilitation is administrated by Ms KAWANNA ROBINSON.

What does this home offer?

Accepts Medicaid icon

Accept Medicaid: Yes

Housing options icon

Housing Options: Private / Semi-Private Rooms

Building type icon
Building type icon

Building Type: Single-story

Recreational activities icon

Recreational Activities

Health Programs icon

Health Programs

Types of Care at Bonterra Transitional Care and Rehabilitation

Nursing Home
Contact Bonterra Transitional Care and Rehabilitation

Inspection History

In Georgia, the Department of Community Health, Healthcare Facility Regulation Division conducts unannounced inspections to ensure facilities adhere to state health and safety requirements.

75 visits/inspections

Latest inspection

Date:June 2, 2025
Type:Follow Up

97 deficiencies

Deficiencies indicate regulatory issues. A higher number implies the facility had several areas requiring improvement.

Compare Nursing Homes around Fulton County

The information below is reported by the Georgia Department of Community Health, Healthcare Facility Regulation Division.
Westminster Commons
SNF

Nursing Homes 24/7 care needed

Atlanta (Midtown Atlanta)
90
No
93
-
86.7%
$8,860,216.00
$3,650,295.00
41.2%
83.10
2/5
3.7569
2/5
2/5
2/5
2
35
-
-37%
+6%
+11%
Private Rooms
Sandy Springs Center for Nursing and Healing
SNF

Nursing Homes 24/7 care needed

Sandy Springs (North Brookhaven)
165
No
29
PATIL, SHAMA
87.1%
$20,770,652.00
$6,542,977.00
31.5%
139.70
1/5
3.0466
1/5
1/5
4/5
3
32
3
-60%
-14%
+11%
Private / Semi-Private Rooms
Bonterra Transitional Care and Rehabilitation
SNF

Nursing Homes 24/7 care needed

Atlanta (River Park)
118
No
56
WELLINGTON HEALTHCARE SERVICES III, LP
94.7%
$13,935,951.00
$5,313,215.00
38.1%
112.30
1/5
2.9183
1/5
1/5
2/5
5
41
7
-64%
-18%
+21%
Private / Semi-Private Rooms
Roswell Center for Nursing and Healing
SNF

Nursing Homes 24/7 care needed

Roswell
268
No
82
HEINTZ, MARCI
74.2%
$29,450,678.00
$4,606,333.00
15.6%
189.10
1/5
2.8867
1/5
1/5
1/5
2
29
5
-5%
-19%
-5%
Private / Semi-Private Rooms
Buckhead Center for Nursing and Healing
SNF

Nursing Homes 24/7 care needed

Atlanta (Buckhead)
179
No
83
-
-
-
-
-
-
-
-
-
-
-
-
-
-
-
-
-
Private / Semi-Private Rooms

Places of interest near Bonterra Transitional Care and Rehabilitation

Address 6.3 miles from city center

Address 2801 Felton Dr, Atlanta, GA 30344

Calculate Travel Distance to Bonterra Transitional Care and Rehabilitation

Add your location

Address

Staffing Data

Source: CMS Payroll-Based Journal (Q2 2025)

263
Total Staff
116
Employees
147
Contractors
36,052
Total Hours (Quarter)
55
Avg Staff/Day
7.2
Avg Shift (hrs)
Nursing Staff Breakdown
Role Count Avg Shift (hrs) Uses Contractors?
Registered Nurse 8 6.9 No
Licensed Practical Nurse 83 7.7 Yes
Certified Nursing Assistant 125 7.2 Yes
Staff by Category
Administration
3 staff
7hs shift avg
Nursing Staff
227 staff
7.2hs shift avg
Physicians & Practitioners
5 staff
6.9hs shift avg
Therapy Services
17 staff
6.2hs shift avg
Activities & Recreation
0 staff
0hs shift avg
Social Services
4 staff
7.9hs shift avg
Dietary Services
5 staff
6.9hs shift avg
Other Services
2 staff
6.8hs shift avg
Contractor Analysis
16.8%
of total hours from contractors
6,068 contractor hours this quarter
Certified Nursing Assistant: 72 Licensed Practical Nurse: 68 Occupational Therapy Aide: 1 Occupational Therapy Assistant: 3 Medical Director: 1 Other Physician: 1 Diagnostic X-ray Services Staff: 1
Role Employees Contractors Total Staff Total Hours Days Worked % of Days Avg Shift (hrs)
Certified Nursing Assistant 53 72 125 17,037 91 100% 7.2
Licensed Practical Nurse 15 68 83 7,502 91 100% 7.7
Medication Aide/Technician 8 0 8 2,270 90 99% 6.8
Registered Nurse 8 0 8 1,807 90 99% 6.9
RN Director of Nursing 3 0 3 1,335 65 71% 7.5
Qualified Social Worker 4 0 4 975 88 97% 7.9
Physical Therapy Assistant 3 0 3 916 67 74% 8
Speech Language Pathologist 3 0 3 682 75 82% 5.8
Administrator 2 0 2 548 65 71% 7.5
Nurse Practitioner 4 0 4 534 65 71% 7.5
Other Dietary Services Staff 3 0 3 521 73 80% 6.9
Respiratory Therapy Technician 3 0 3 502 55 60% 7.5
Mental Health Service Worker 1 0 1 473 63 69% 7.5
Physical Therapy Aide 4 0 4 469 67 74% 6.2
Occupational Therapy Aide 0 1 1 177 38 42% 4.6
Dietitian 2 0 2 142 20 22% 7.1
Occupational Therapy Assistant 0 3 3 51 40 44% 1.3
Medical Director 0 1 1 45 12 13% 3.8
Other Physician 0 1 1 36 12 13% 3
Diagnostic X-ray Services Staff 0 1 1 32 11 12% 2.9

Health Inspection History

Inspections
Total health inspections 5

Georgia average 3.4


Last Health inspection on Mar 2025

Total health citations 41
Citations per inspection
8.2

Health citations are formal notices following inspections when they fail to comply with safety and care standards.

5 of 41 citations resulted from standard inspections; 8 of 41 resulted from complaint investigations; and 28 of 41 came from combined inspections (standard and complaint).

Breakdown of citation severity (last 3 years)
Critical Health citations More info 3
329% worse than Georgia average

Georgia average: 0.7


Serious Health citations More info 4
700% worse than Georgia average

Georgia average: 0.5

3 critical citations More info Georgia average: 0.7

4 serious citations More info Georgia average: 0.5

34 moderate citations More info Georgia average: 15.2

0 minor citations More info Georgia average: 0.2
Citations history (last 3 years)
Abuse/Neglect moderate citation Mar 19, 2025
Corrected

Abuse/Neglect moderate citation Mar 19, 2025
Corrected

Administration serious citation Mar 19, 2025
Corrected

Administration critical citation Mar 19, 2025
Corrected

Facility Characteristics

Source: CMS Long-Term Care Facility Characteristics (Data as of Jan 2026)

Ownership: For-Profit Partnership
Part of: Well 5 and Associates LP
Resident Census by Payment Source
114 Total Residents
Medicare 11 (9.6%)
Medicaid 96 (84.2%)
Private Pay/Other 7 (6.1%)
Programs & Services
Residents' Group
Family Engagement

Active councils help families stay involved in care decisions and facility operations.

Quality of care over time

These measures show how residents usually do over time at this home, based on health outcomes and preventive care.

High-risk clinical events score Info A composite score based on pressure ulcers, falls with injury, weight loss, walking ability decline, and activities of daily living decline. 8.4
18% better than Georgia average

Georgia average: 10.3

Functional decline score Info A composite score based on activities of daily living decline, walking ability decline, and incontinence. 14.6
16% better than Georgia average

Georgia average: 17.4

Long-stay resident measures
Need for Help with Daily Activities Increased Info Percent of long-stay residents whose need for help with daily activities has increased 11.8%
30% better than Georgia average

Georgia average: 16.8%

Walking Ability Worsened Info Percent of long-stay residents whose ability to move independently worsened 18.4%
5% better than Georgia average

Georgia average: 19.4%

Low Risk Residents with Bowel/Bladder Incontinence Info Percent of low risk long-stay residents who lose control of their bowels or bladder 13.7%
15% better than Georgia average

Georgia average: 16.1%

Falls with Major Injury Info Percent of long-stay residents experiencing one or more falls with major injury 2.1%
34% better than Georgia average

Georgia average: 3.2%

High Risk Residents with Pressure Ulcers Info Percent of long-stay high risk residents with pressure ulcers 2.8%
56% better than Georgia average

Georgia average: 6.3%

Urinary Tract Infection Info Percent of long-stay residents with a urinary tract infection 2.7%
7% worse than Georgia average

Georgia average: 2.5%

Lost Too Much Weight Info Percent of long-stay residents who lose too much weight 6.9%
15% worse than Georgia average

Georgia average: 6.0%

Depressive Symptoms Info Percent of long-stay residents who have depressive symptoms 0.0%
100% better than Georgia average

Georgia average: 8.7%

Antipsychotic Use Info Percent of long-stay residents who received an antipsychotic medication 13.8%
28% better than Georgia average

Georgia average: 19.1%

Pneumococcal Vaccine Info Percent of long-stay residents assessed and appropriately given the pneumococcal vaccine 52.8%
42% worse than Georgia average

Georgia average: 91.5%

Influenza Vaccine Info Percent of long-stay residents assessed and appropriately given the seasonal influenza vaccine 91.8%
In line with Georgia average

Georgia average: 95.0%

Hospitalizations per 1,000 days Info Number of hospitalizations per 1,000 long-stay resident days. 2.93
34% worse than Georgia average

Georgia average: 2.18

ED visits per 1,000 days Info Number of outpatient emergency department visits per 1,000 long-stay resident days. 2.82
43% worse than Georgia average

Georgia average: 1.97

Short-stay resident measures
Pneumococcal Vaccine Info Percent of short-stay residents assessed and appropriately given the pneumococcal vaccine 12.6%
84% worse than Georgia average

Georgia average: 80.6%

Antipsychotic medication increase Info Percent of short-stay residents who newly received an antipsychotic medication 3.7%
66% worse than Georgia average

Georgia average: 2.2%

Influenza Vaccine Info Percent of short-stay residents assessed and appropriately given the seasonal influenza vaccine 51.4%
34% worse than Georgia average

Georgia average: 78.2%

Re-hospitalized after SNF stay Info Percentage of short-stay residents who were re-hospitalized after their nursing home admission. 24.2%
In line with Georgia average

Georgia average: 24.2%

Emergency department visits Info Percentage of short-stay residents who had an outpatient emergency department visit. 11.8%
In line with Georgia average

Georgia average: 12.2%

Falls with major injury Info Percentage of SNF residents who experience falls with major injury during their stay. 0.0%
100% better than Georgia average

Georgia average: 0.8%

Ability to care for self at discharge Info Percentage of residents at or above expected ability to care for themselves at discharge. 48.4%
10% worse than Georgia average

Georgia average: 53.7%

Successful return to home or community Info Rate of successful return to home or community from a skilled nursing facility. 45.1%
11% worse than Georgia average

Georgia average: 50.6%

Penalties and fines

Federal penalties imposed by CMS for regulatory violations, including civil money penalties (fines) and denials of payment for new Medicare/Medicaid admissions.

Source: CMS Penalties Database (Data as of Jan 2026)

Total fines amount $57K
42% higher than Georgia average

Georgia average: $40K

Number of fines 5
143% more fines than Georgia average

Georgia average: 2.1

Payment Denials Info Serious action where Medicare and/or Medicaid temporarily stops payments for new residents until issues are fixed. 1
252% more payment denials than Georgia average

Georgia average: 0.3

Fines amount comparison
This facility $57K
Georgia average $40K
Penalty History

Penalties are imposed by CMS for violations of federal nursing home regulations.

Civil Money Penalty Info Fines imposed for noncompliance, which can be assessed per day or per instance of violation. Mar 19, 2025
$27K
Payment Denial Info Serious action where Medicare and/or Medicaid temporarily stops payments for new residents until issues are fixed. Mar 19, 2025
16 days
Civil Money Penalty Info Fines imposed for noncompliance, which can be assessed per day or per instance of violation. Nov 20, 2023
$5K
Civil Money Penalty Info Fines imposed for noncompliance, which can be assessed per day or per instance of violation. Nov 13, 2023
$5K

Last updated: Jan 2026

Guides for Better Senior Living

Care Cost Calculator: See Prices in Your Area

Nursing Home Data Explorer

Don’t Wait Too Long: 7 Red Flag Signs Your Parent Needs Assisted Living Now

The True Cost of Assisted Living in 2025 – And How Families Are Paying For It

Understanding Senior Living Costs: Pricing Models, Discounts & Financial Assistance

Financial Aid for Georgia Seniors

Get financial aid guidance

Community Care Services Program

Georgia Medicaid CCSP

Age 65+ or disabled, Georgia resident, Medicaid-eligible, nursing home-level care need.

~$2,829/month (300% FBR, individual).

$2,000 (individual), $3,000 (couple).

High rural demand; waitlists possible.

Respite Care Program

Georgia NFCSP Respite

Caregiver of someone 60+ (or with dementia), Georgia resident.

No strict limit; prioritizes low-income.

Not applicable.

Focus on metro and rural balance.

Home and Community Services (HCS)

Georgia Home and Community Services (Non-Medicaid)

Age 60+, Georgia resident, functionally impaired, at risk of nursing home placement.

No strict limit; prioritizes ~$41,000/year; cost-sharing for higher incomes.

Not specified; need-based.

Non-Medicaid; AAA-managed.

Medicare Savings Program (MSP)

Georgia Medicare Savings Program

Age 65+ or disabled, Georgia resident, Medicare Part A/B.

~$2,510/month (QMB), ~$3,380/month (SLMB), ~$3,598/month (QI).

$9,430 (individual), $14,130 (couple).

Three tiers; entitlement benefit.

Program of All-Inclusive Care for the Elderly (PACE)

Georgia Medicaid PACE

Age 55+, Georgia resident, nursing home-level care need, safe with PACE support.

~$2,829/month (300% FBR).

$2,000 (individual), $3,000 (couple).

Limited areas (e.g., Macon, Augusta).

Senior Community Service Employment Program (SCSEP)

Georgia SCSEP (Federally Funded, State-Administered)

Age 55+, unemployed, low-income, Georgia resident.

~$1,983/month (125% FPL).

Not specified; income-focused.

~1,200 slots; prioritizes veterans, rural residents.

SOURCE (Service Options Using Resources in a Community Environment)

Georgia Medicaid SOURCE Program

Age 65+ or disabled, Georgia resident, Medicaid-eligible, frail but not necessarily nursing home-level.

~$914/month (SSI level); QIT allowed.

$2,000 (individual), $3,000 (couple).

Enhanced primary care model; statewide via 12 sites.

Optional State Supplementation (OSS)

Georgia Optional State Supplementation

Age 65+ or disabled, Georgia resident, in approved facility, low-income/SSI recipient.

~$1,004/month (including SSI).

$2,000 (individual), $3,000 (couple).

~$20-$489/month based on facility type.

Who we are

Your Senior Care Partner, Every Step of the Way

We help families find affordable senior communities and unlock same day discounts, Medicaid, and Medicare options tailored to your needs.

Contact us Today