


Total staff
144
Employees
138
Contractors
6
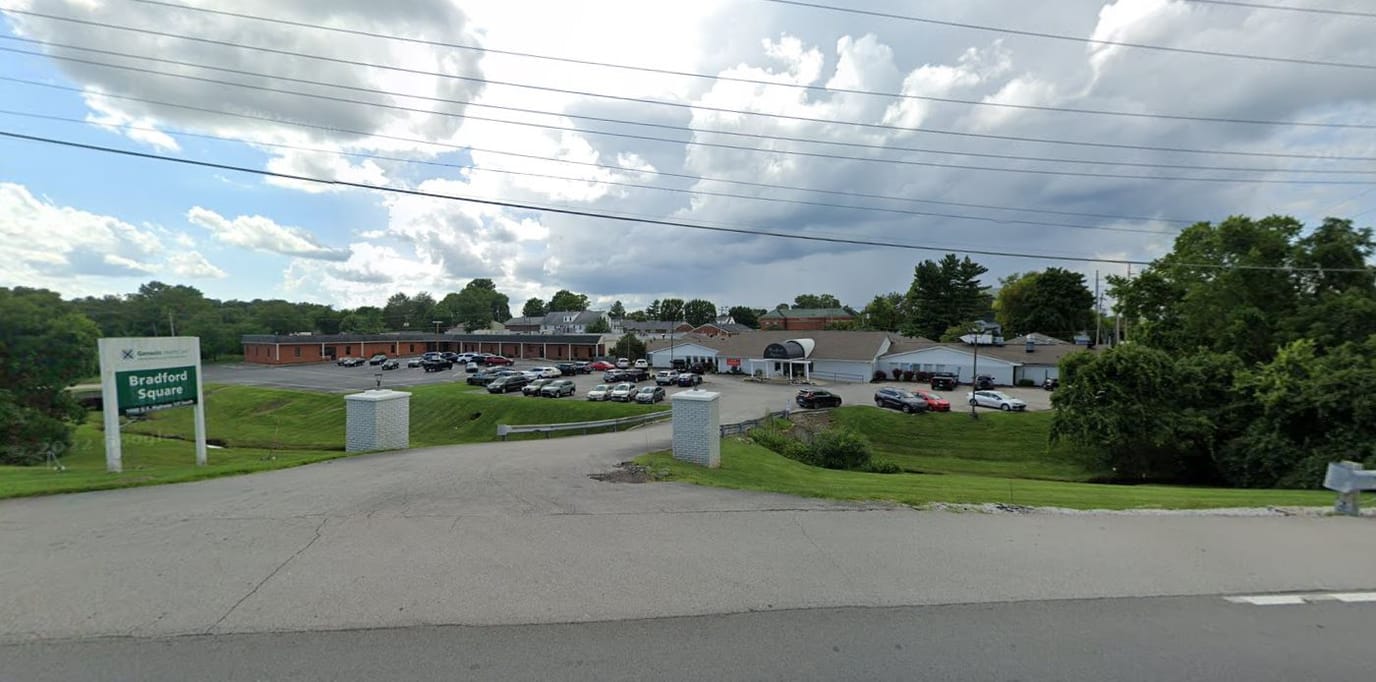
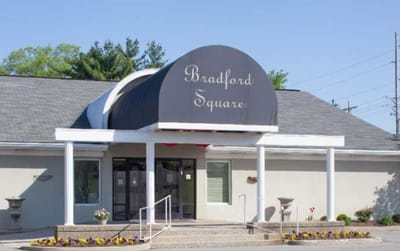

Bradford Square is a nursing home and skilled nursing community in Frankfort, Kentucky, run under the Genesis Healthcare Community umbrella. It’s a 100-bed facility off US Highway 127 South, and right now it’s running close to full, with occupancy at 91%. The area around it scores 43 on Walk Score, so it’s the kind of neighborhood where a few errands might be walkable, but most days you’re getting in the car.
The facility handles both ends of the care spectrum: short-term rehab stays and longer-term residency, with the average resident staying about 146 days. That range shows up in what’s offered on-site, rehabilitation services for people recovering from surgery or illness, and respite care for families who need a short-term break from caregiving duties at home.
Two things stand out in how the community involves its residents and trains its staff. There’s an Active Resident Council, a group that meets regularly so residents actually have input on policy, care quality, and day-to-day activities. Bradford Square also runs a state-approved Nurse Aide Training and Competency Evaluation Program on-site.
On the financial side, Bradford Square takes Medicare, Medicaid, and private pay. Staffing breaks down to about 33 minutes of RN time per resident daily, 53 minutes from LPNs, and 2 hours 27 minutes from nurse aides, adding up to roughly 3 hours 12 minutes of nursing care per resident each day. One more practical note for families: Bradford Square allows pets, so moving in doesn’t have to mean leaving a companion animal behind.
| Staff type | Hours / Day / Resident | vs state avg |
|---|---|---|
|
Registered Nurse (RN)
| 33m per day | ▼ 29% State avg: 46m per day · National avg: 41m per day |
|
LPN / LVN
| 53m per day | ▲ 8% State avg: 49m per day · National avg: 52m per day |
|
Nurse Aide
| 2h 27m per day | ■ Avg State avg: 2h 25m per day · National avg: 2h 21m per day |
|
Weekend Total Nursing
| 3h 28m per day | ■ Avg State avg: 3h 29m per day · National avg: 3h 26m per day |
|
Physical Therapist
| 1m per day | ▼ 71% State avg: 4m per day · National avg: 4m per day |
|
Weekend RN
| 17m per day | ▼ 46% State avg: 31m per day · National avg: 29m per day |
Reporting period: October 1 – December 31, 2025 (Q4 2025). Source: CMS Payroll-Based Journal report.
Manages medical care and health needs.
Assists with medical care and medications.
Helps with daily care and mobility.
Total hours from contractors
244 contractor hours this quarter
| Certified Nursing Assistant | 67 | 0 | 67 | 19,127 | 92 | 100% | 9.2 |
| Licensed Practical Nurse | 23 | 0 | 23 | 6,277 | 92 | 100% | 10 |
| Registered Nurse | 11 | 0 | 11 | 2,289 | 92 | 100% | 7.9 |
| Clinical Nurse Specialist | 4 | 0 | 4 | 1,806 | 72 | 78% | 7.7 |
| Medication Aide/Technician | 5 | 0 | 5 | 1,333 | 88 | 96% | 8.6 |
| RN Director of Nursing | 5 | 0 | 5 | 1,128 | 66 | 72% | 8.1 |
| Other Dietary Services Staff | 3 | 0 | 3 | 638 | 61 | 66% | 7.7 |
| Speech Language Pathologist | 2 | 0 | 2 | 527 | 62 | 67% | 6.4 |
| Administrator | 2 | 1 | 3 | 496 | 62 | 67% | 8 |
| Physical Therapy Aide | 2 | 0 | 2 | 475 | 61 | 66% | 7.6 |
| Nurse Practitioner | 1 | 0 | 1 | 472 | 59 | 64% | 8 |
| Dental Services Staff | 1 | 0 | 1 | 445 | 56 | 61% | 7.9 |
| Physical Therapy Assistant | 4 | 0 | 4 | 422 | 75 | 82% | 4.1 |
| Qualified Social Worker | 4 | 0 | 4 | 422 | 73 | 79% | 5.6 |
| Respiratory Therapy Technician | 4 | 0 | 4 | 163 | 47 | 51% | 3.4 |
| Occupational Therapy Aide | 0 | 1 | 1 | 65 | 11 | 12% | 5.9 |
| Occupational Therapy Assistant | 0 | 3 | 3 | 46 | 39 | 42% | 1.1 |
| Medical Director | 0 | 1 | 1 | 14 | 14 | 15% | 1 |
Includes penalties issued in 2024
Federal penalties imposed by CMS for regulatory violations, including civil money penalties (fines) and denials of payment for new Medicare/Medicaid admissions.
Source: CMS Penalties Database (Data as of Jan 2026)
Kentucky average: $63K
Kentucky average: 2.3
Kentucky average: 0.3
Penalties are imposed by CMS for violations of federal nursing home regulations.
1 penalty in the past 3 years
Apr 26, 2024 · $14K
Last updated: Jan 2026
These measures show how residents usually do over time at this home, based on health outcomes and preventive care.
Kentucky average: 10.5
Kentucky average: 18.9
Kentucky average: 16.8%
Kentucky average: 19.6%
Kentucky average: 20.5%
Kentucky average: 3.8%
Kentucky average: 5.8%
Kentucky average: 1.9%
Kentucky average: 6.8%
Kentucky average: 14.3%
Kentucky average: 15.6%
Kentucky average: 93.9%
Kentucky average: 96.2%
Kentucky average: 1.87
Kentucky average: 2.19
Kentucky average: 83.7%
Kentucky average: 1.9%
Kentucky average: 83.6%
Kentucky average: 24.5%
Kentucky average: 13.9%
Kentucky average: 0.8%
Kentucky average: 53.7%
Kentucky average: 50.6%
Quality measures are calculated from Minimum Data Set (MDS) assessments. For most measures, lower percentages indicate better care quality.
23% of new residents, usually for short-term rehab.
53% of new residents, often for short stays.
24% of new residents, often for long-term daily care.
Source: CMS Long-Term Care Facility Characteristics (Data as of Jan 2026)
Residents meet regularly to discuss policies, care quality, and activities
State-approved Nurse Aide Training and Competency Evaluation Program on-site
Organized group of residents that meets regularly to discuss facility policies, quality of life, and activities.
Data sourced from CMS Long-Term Care Facility Characteristics quarterly report. Payer mix reflects the current resident census by primary payment source.
Historical financial and operational data for Bradford Square from 2011–2023, based on CMS SNF Cost Reports.
Key figures below are for fiscal year ending in 12/2023.
Based on CMS SNF Cost Report for fiscal year ending in 12/2023.
Pets Allowed
This home supports both short-term rehab and long-term care, with residents staying for a wide range of durations.
Most new residents arrive under private pay (53% of admissions), and a typical private pay stay runs around 29 days.
Coverage residents most often arrive under.
Coverage residents most often leave under.
![]() 1.5 miles from city center
1.5 miles from city center
![]() Estimated distance in miles from Frankfort's city center to Bradford Square's address, calculated via Google Maps.
Estimated distance in miles from Frankfort's city center to Bradford Square's address, calculated via Google Maps.
Add your location
Info below is compiled from CMS reports & the KY Cabinet for Health & Family Services (CHFS), senior community websites & trusted data sources such as Walk Score & BBB.
Communities are listed from highest to lowest based on our ranking methodology.
| Frankfort Care and Rehabilitation | NH HOS RC SNF | Frankfort | 100
Facility
100
KY AVG
82
Rank
#97 / 341 |
91.5%
Facility
91.5%
KY AVG
84.3
Rank
#62 / 168 | +9% | 3.05
Facility
3.05
KY AVG
3.75
Rank
#150 / 189 | +6% | -19% | $0
Facility
$0
KY AVG
$65.4k
Rank
#1 / 195 | 7
Facility
7
KY AVG
13.5
Rank
#36 / 191 | 3.5
Facility
3.5
KY AVG
4.4
Rank
#75 / 191 | - | 92 | - |
30
Facility
30
KY AVG
41
Rank
#284 / 423 | Lexington Health Management LLC | $8.7MFiscal year ending 12/2023
Facility
$8.7MFiscal year ending 12/2023
KY AVG
$10.5M
Rank
#70 / 192 | $4.6MFiscal year ending 12/2023
Facility
$4.6MFiscal year ending 12/2023
KY AVG
$4.0M
Rank
#96 / 192 | 52.8%Fiscal year ending 12/2023
Facility
52.8%Fiscal year ending 12/2023
KY AVG
40.7%
Rank
#157 / 192 | 185159 | ||||
| Signature HealthCARE at Heritage Hall Rehab & Wellness Center | NH HOS PC RC SNF | Lawrenceburg | 94
Facility
94
KY AVG
82
Rank
#120 / 341 |
90.0%
Facility
90.0%
KY AVG
84.3
Rank
#72 / 168 | +7% | 3.84
Facility
3.84
KY AVG
3.75
Rank
#38 / 189 | +27% | +2% | $185.2k
Facility
$185.2k
KY AVG
$65.4k
Rank
#188 / 195 | 23
Facility
23
KY AVG
13.5
Rank
#163 / 191 | 5.8
Facility
5.8
KY AVG
4.4
Rank
#146 / 191 | 5 | 85 | - |
58
Facility
58
KY AVG
41
Rank
#109 / 423 | Lisa Colllier | $8.0MFiscal year ending 12/2023
Facility
$8.0MFiscal year ending 12/2023
KY AVG
$10.5M
Rank
#69 / 192 | $3.6MFiscal year ending 12/2023
Facility
$3.6MFiscal year ending 12/2023
KY AVG
$4.0M
Rank
#91 / 192 | 44.7%Fiscal year ending 12/2023
Facility
44.7%Fiscal year ending 12/2023
KY AVG
40.7%
Rank
#152 / 192 | 185277 | ||||
| Bradford Square | NH SNF | Frankfort | 100
Facility
100
KY AVG
82
Rank
#97 / 341 |
91.0%
Facility
91.0%
KY AVG
84.3
Rank
#64 / 168 | +8% | 3.20
Facility
3.20
KY AVG
3.75
Rank
#114 / 189 | -29% | -15% | $13.6k
Facility
$13.6k
KY AVG
$65.4k
Rank
#155 / 195 | 18
Facility
18
KY AVG
13.5
Rank
#140 / 191 | 4.5
Facility
4.5
KY AVG
4.4
Rank
#108 / 191 | 1 | 91 | - |
43
Facility
43
KY AVG
41
Rank
#206 / 423 | - | $8.7MFiscal year ending 12/2023
Facility
$8.7MFiscal year ending 12/2023
KY AVG
$10.5M
Rank
#56 / 192 | $4.2MFiscal year ending 12/2023
Facility
$4.2MFiscal year ending 12/2023
KY AVG
$4.0M
Rank
#64 / 192 | 48.5%Fiscal year ending 12/2023
Facility
48.5%Fiscal year ending 12/2023
KY AVG
40.7%
Rank
#107 / 192 | 185170 |
Bradford Square is located in Frankfort, Kentucky.
Here are the financial assistance programs available to residents in Kentucky.
Bradford Square has a walk score of 43. Somewhat walkable. A few nearby services may be reachable on foot, but most trips require transportation.
Bradford Square's occupancy is 86.5%.
Yes, Bradford Square allows residents to bring their pets.
Bradford Square is registered as a for-profit.
Yes — there are 3 photos of Bradford Square in the photo gallery on this page.
Bradford Square is located at 1040 Us Highway 127 South, 1040 Old Us Highway 127 Road, Frankfort, KY 40601.
(502) 875-5600 will put you in contact with the team at Bradford Square.
Care Cost Calculator: See Prices in Your Area
Nursing Home Data Explorer
Don’t Wait Too Long: 7 Red Flag Signs Your Parent Needs Assisted Living Now
The True Cost of Assisted Living in 2025 – And How Families Are Paying For It
Understanding Senior Living Costs: Pricing Models, Discounts & Financial Assistance


