Frankfort Care and Rehabilitation
Nursing Home, Assisted Living & Hospice Care · Frankfort, KY
CMS overall rating Info CMS (the Centers for Medicare & Medicaid Services) is the federal agency that rates nursing home quality. Its Overall Rating runs from 1 to 5 stars, combining health inspections, staffing, and quality measures, with inspections weighted most heavily.

Frankfort Care and Rehabilitation

Nursing Home, Assisted Living & Hospice Care · Frankfort, KY
CMS overall rating Info CMS (the Centers for Medicare & Medicaid Services) is the federal agency that rates nursing home quality. Its Overall Rating runs from 1 to 5 stars, combining health inspections, staffing, and quality measures, with inspections weighted most heavily.
Calculator: See prices in your area
Frankfort Care and Rehabilitation accepts Medicare, Medicaid, and private pay.

Overview of Frankfort Care and Rehabilitation

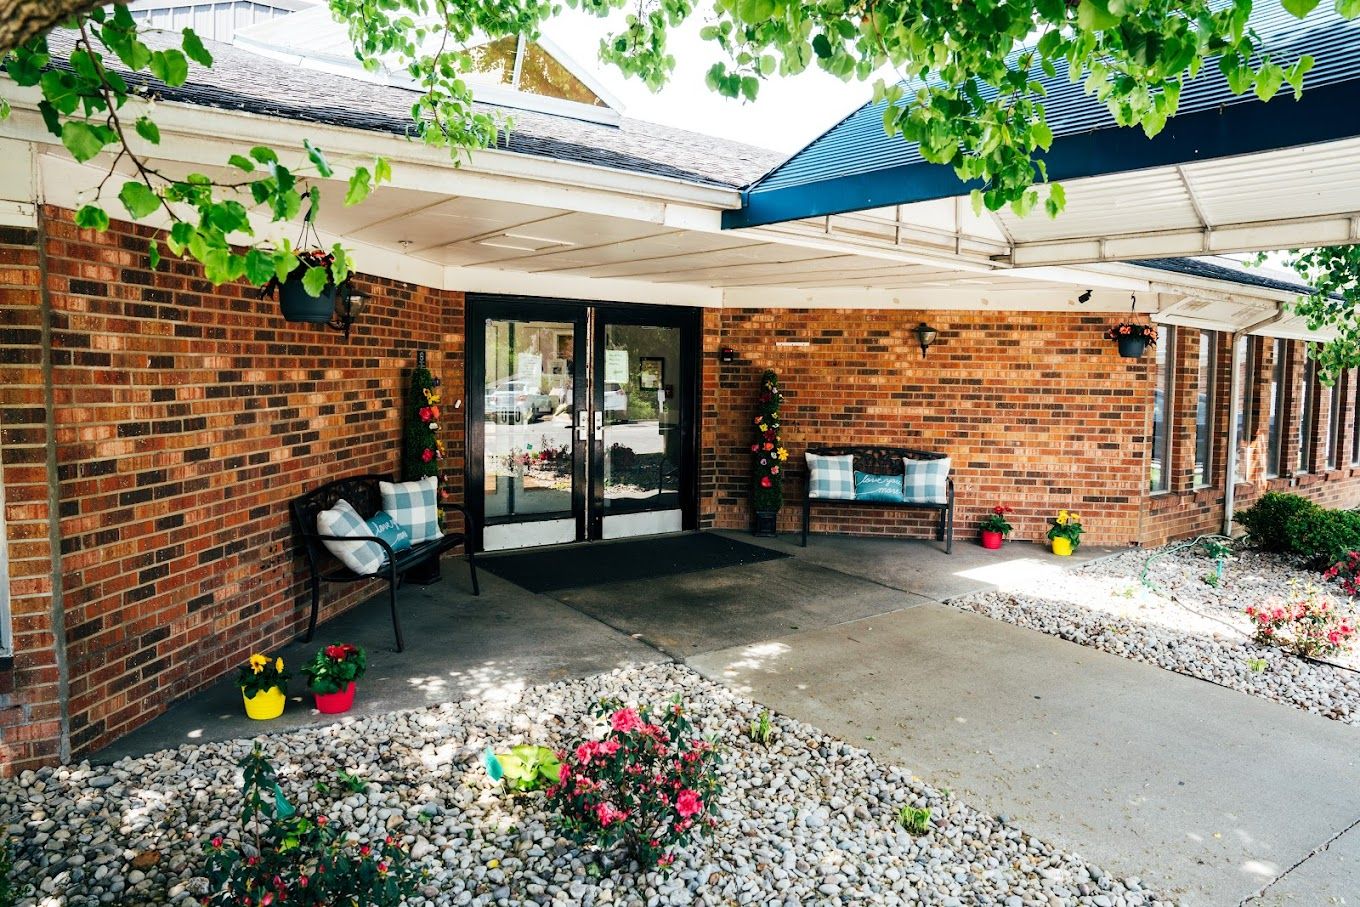
Frankfort Care and Rehabilitation nursing home focuses on conducting results-driven programs with cutting-edge technologies that specifically cater to the varying needs of the residents. Specializing in short-term rehabilitation, long-term care, hospice care, and respite care services– residents receive the highest standard of quality living while maintaining and respecting individuality and independence.

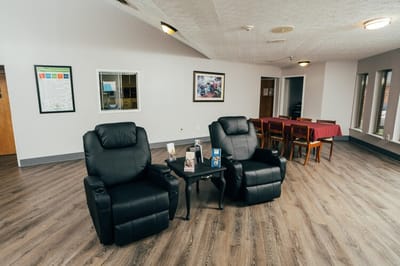
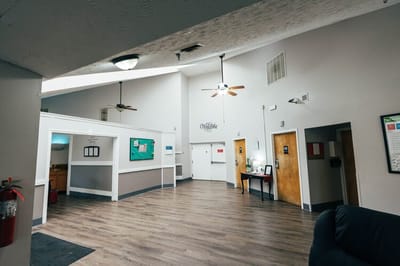
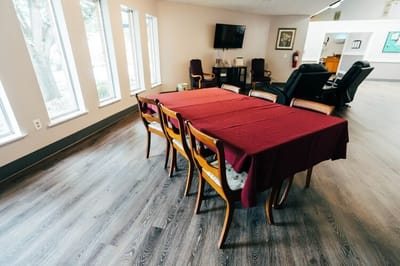
Seniors can feel confident and comfortable and know they belong in a home that offers 24-hour nursing care in a resort-like community with the utmost hospitality. They provide a range of services, such as wound care, diabetic care, pain management, medication management, and diabetes management – among a few.

Quality ratings

Measured by Centers for Medicare & Medicaid Services (CMS)

Overall rating Info The Overall CMS Rating combines results from health inspections, staffing levels and quality measures. Health inspections carry the most weight. Staffing and quality scores can increase or decrease the final rating based on performance compared to state and national standards.
▲ 6.5% Above KY avg. ▲ 6.5% Above KY avg.KY average: 2.8Click the badge to see the full State ranking.Click here to see the full State ranking.
Health Inspection Info Based on the results of the facility's three most recent standard inspections and any complaint investigations. CMS reviews the number, scope, and severity of deficiencies, with more recent findings weighted more heavily.
▲ 2.8% Above KY avg. ▲ 2.8% Above KY avg.KY average: 2.9Click the badge to see the full State ranking.Click here to see the full State ranking.
Staffing Info Measures average nursing staff hours per resident per day, including Registered Nurses (RNs) and total nursing staff. Ratings are adjusted based on the level of care residents require and are compared to state and national benchmarks.
▼ 25.1% Below KY avg. ▼ 25.1% Below KY avg.KY average: 2.7Click the badge to see the full State ranking.Click here to see the full State ranking.
Quality Measures Info Based on clinical and physical health indicators reported to CMS, such as hospital readmissions, falls, pressure ulcers, and improvements in mobility. These measures reflect how well residents' health needs are being managed.
▲ 38.2% Above KY avg. ▲ 38.2% Above KY avg.KY average: 2.9Click the badge to see the full State ranking.Click here to see the full State ranking.

Staffing hours breakdown

Info Daily nursing hours per resident by staff type, reported to CMS. Higher is generally better — compare this facility to state and national averages to see where staffing stands.

Hours per resident per day — compared to Kentucky state averages

Total nursing care / resident Info This home is ranked 154th out of 193 homes in Kentucky for nurse hours. Total adjusted nursing hours per resident per day, combining RN, LPN, and aide time. CMS adjusts this for case-mix so facilities can be fairly compared.
3h 3m per day
Rank #154 / 193Nurse hours — State benchmarkedThis home is ranked 154th out of 193 homes in Kentucky. Shows adjusted nurse hours per resident per day benchmarked to the Kentucky average, with a ranking across 193 Kentucky facilities. More hours mean more direct care. The national average is about 3.5 hrs; below 3.0 is a red flag.Rankings are based only on facilities in Kentucky that report data for that category. Facilities without available data are excluded from the ranking.Click the rank badge to see the full State ranking.Click here to see the full State ranking.
This facility Kentucky avg (3h 45m per day)
vs Kentucky avg
-19%

6 of 6 metrics below state avg

Staff type Hours / Day / Resident vs state avg
Registered Nurse (RN) Info RNs hold the highest nursing license and can assess residents, interpret test results, and direct care plans. More RN hours per day often signals stronger clinical oversight and faster response to health changes. 34m per day ▼ 26% State avg: 46m per day · National avg: 41m per day
LPN / LVN Info Licensed Practical Nurses (LPNs) or Licensed Vocational Nurses (LVNs) deliver routine hands-on care — medication administration, wound dressing, and monitoring vital signs. They work under RN supervision and make up a large share of daily bedside care. 40m per day ▼ 18% State avg: 49m per day · National avg: 52m per day
Nurse Aide Info Certified Nurse Aides (CNAs) provide the most direct day-to-day assistance: bathing, dressing, feeding, and mobility. Nurse aide hours are typically the largest staffing category and directly affect residents' quality of life. 1h 57m per day ▼ 19% State avg: 2h 25m per day · National avg: 2h 21m per day
Weekend Total Nursing Info Combined nursing hours (RN + LPN + Nurse Aide) per resident per day on weekends. Staffing often drops on weekends — this figure reveals whether the facility maintains adequate coverage outside of weekday hours. 2h 51m per day ▼ 18% State avg: 3h 29m per day · National avg: 3h 26m per day
Physical Therapist Info Hours per resident per day provided by licensed Physical Therapists (PTs) or PT Assistants. PT services help residents recover mobility after injury or illness and are especially important for post-acute (short-stay) rehabilitation. 3m per day ▼ 22% State avg: 4m per day · National avg: 4m per day
Weekend RN Info Registered nurse hours specifically on weekends. Facilities sometimes reduce RN presence on Saturdays and Sundays — a low weekend RN figure compared to weekday hours can indicate reduced clinical oversight when most administrative staff are absent. 20m per day ▼ 35% State avg: 31m per day · National avg: 29m per day

Capacity and availability

This home usually has availability

Lower occupancy than the Kentucky average: 81.3%
Occupancy rate
76.5% Rank #159 / 209Occupancy rate — State benchmarkedThis home is ranked 159th out of 209 homes in Kentucky. Shows this facility's occupancy rate versus the Kentucky average, with its Statewide rank out of 209. Higher occupancy signals strong local demand and financial stability.Rankings are based only on facilities in Kentucky that report data for that category. Facilities without available data are excluded from the ranking.Click the rank badge to see the full State ranking.Click here to see the full State ranking.
Avg. Length of Stay
184 days
Bed community size
100-bed community Rank #97 / 341Bed count — State benchmarkedThis home is ranked 97th out of 341 homes in Kentucky. Shows this facility's certified or reported bed count compared to other Kentucky facilities. Larger communities may offer more amenities, programs, and on-site services for residents and families.Rankings are based only on facilities in Kentucky that report data for that category. Facilities without available data are excluded from the ranking.Click the rank badge to see the full State ranking.Click here to see the full State ranking.
A larger shared setting that may offer more common spaces and organized community services.
Walk Score
Walk Score: 30 / 100 Rank #284 / 423Walk Score — State benchmarkedThis home is ranked 284th out of 423 homes in Kentucky. Shows how walkable this facility's neighborhood is compared to the average Walk Score across Kentucky facilities. Higher scores benefit residents, families, and staff.Rankings are based only on facilities in Kentucky that report data for that category. Facilities without available data are excluded from the ranking.Click the rank badge to see the full State ranking.Click here to see the full State ranking.
Somewhat walkable. A few nearby services may be reachable on foot, but most trips require transportation.

Contact Frankfort Care and Rehabilitation

Staffing Data

Reporting period: October 1 – December 31, 2025 (Q4 2025). Source: CMS Payroll-Based Journal report.

Total staff 105
Employees 105
Contractors 0
Staff to resident ratio 1.22 : 1
29% fewer staff per resident than Kentucky average
Kentucky average ratio: 1.72 : 1 Kentucky average ratio: 1.72 : 1See full Kentucky ranking
Avg staff/day 38
Average shift 8.8 hours
0% compared with Kentucky average
Kentucky average: 8.5 hours Kentucky average shift: 8.5 hoursSee full Kentucky ranking
Total staff hours (quarter) 30,601

Nursing staff breakdown

Q4 2025 · Oct 1 – Dec 31 More info This data comes from the CMS Payroll-Based Journal report covering October 1 – December 31, 2025.
Registered Nurse

Manages medical care and health needs.

RN Staff Info All 12 RN Staff are full-time employees. No contractors work on this role. 12
Average shift length Info Average shift length. Calculated as total hours divided by days worked and average staff per day. 10.5 hours
Licensed Practical Nurse

Assists with medical care and medications.

LPN Staff Info All 17 LPN Staff are full-time employees. No contractors work on this role. 17
Average shift length Info Average shift length. Calculated as total hours divided by days worked and average staff per day. 9.1 hours
Certified Nursing Assistant

Helps with daily care and mobility.

CNA Staff Info All 52 CNA Staff are full-time employees. No contractors work on this role. 52
Average shift length Info Average shift length. Calculated as total hours divided by days worked and average staff per day. 9 hours

Contractor staffing

Q4 2025 · Oct 1 – Dec 31 More info This data comes from the CMS Payroll-Based Journal report covering October 1 – December 31, 2025.
Total hours from contractors 0% — all staff are direct employees this quarter

Staff by category

Q4 2025 · Oct 1 – Dec 31 More info This data comes from the CMS Payroll-Based Journal report covering October 1 – December 31, 2025.
Certified Nursing Assistant 52 0 52 15,235 92 100% 9
Licensed Practical Nurse 17 0 17 5,401 92 100% 9.1
Registered Nurse 12 0 12 3,284 92 100% 10.5
Medication Aide/Technician 4 0 4 1,190 81 88% 7.4
Clinical Nurse Specialist 2 0 2 968 64 70% 8
Dietitian 1 0 1 517 70 76% 7.4
Administrator 1 0 1 512 64 70% 8
Nurse Practitioner 1 0 1 512 64 70% 8
Mental Health Service Worker 1 0 1 504 63 68% 8
Physical Therapy Aide 3 0 3 478 74 80% 6
Physical Therapy Assistant 2 0 2 437 60 65% 7.3
Respiratory Therapy Technician 1 0 1 436 59 64% 7.4
Qualified Social Worker 2 0 2 428 64 70% 6.7
Other Dietary Services Staff 4 0 4 380 58 63% 6.6
RN Director of Nursing 1 0 1 259 32 35% 8.1
Speech Language Pathologist 1 0 1 61 7 8% 8.7
52 Certified Nursing Assistant
% of Days 100%
17 Licensed Practical Nurse
% of Days 100%
12 Registered Nurse
% of Days 100%
4 Medication Aide/Technician
% of Days 88%
2 Clinical Nurse Specialist
% of Days 70%
1 Dietitian
% of Days 76%
1 Administrator
% of Days 70%
1 Nurse Practitioner
% of Days 70%
1 Mental Health Service Worker
% of Days 68%
3 Physical Therapy Aide
% of Days 80%
2 Physical Therapy Assistant
% of Days 65%
1 Respiratory Therapy Technician
% of Days 64%
2 Qualified Social Worker
% of Days 70%
4 Other Dietary Services Staff
% of Days 63%
1 RN Director of Nursing
% of Days 35%
1 Speech Language Pathologist
% of Days 8%

Penalties and fines

Federal penalties imposed by CMS for regulatory violations, including civil money penalties (fines) and denials of payment for new Medicare/Medicaid admissions.

Source: CMS Penalties Database

No penalties in the past 3 years

No civil money penalties or payment denials were reported in the last 3 years.

Quality of care over time

These measures show how residents usually do over time at this home, based on health outcomes and preventive care.

High-risk clinical events score Info A composite score based on pressure ulcers, falls with injury, weight loss, walking ability decline, and activities of daily living decline. 13.0
24% worse than Kentucky average

Kentucky average: 10.5

Functional decline score Info A composite score based on activities of daily living decline, walking ability decline, and incontinence. 23.5
24% worse than Kentucky average

Kentucky average: 18.9

Long-stay resident measures
Above average Kentucky avg: 3.5 Info CMS star rating based on long-stay quality measure performance. 5 stars = significantly above average, 1 star = significantly below average.
Need for Help with Daily Activities Increased Info Percent of long-stay residents whose need for help with daily activities has increased 18.9%
12% worse than Kentucky average

Kentucky average: 16.8%

Walking Ability Worsened Info Percent of long-stay residents whose ability to move independently worsened 29.9%
52% worse than Kentucky average

Kentucky average: 19.6%

Low Risk Residents with Bowel/Bladder Incontinence Info Percent of low risk long-stay residents who lose control of their bowels or bladder 21.8%
6% worse than Kentucky average

Kentucky average: 20.5%

Falls with Major Injury Info Percent of long-stay residents experiencing one or more falls with major injury 1.8%
51% better than Kentucky average

Kentucky average: 3.8%

High Risk Residents with Pressure Ulcers Info Percent of long-stay high risk residents with pressure ulcers 5.1%
11% better than Kentucky average

Kentucky average: 5.8%

Urinary Tract Infection Info Percent of long-stay residents with a urinary tract infection 1.5%
19% better than Kentucky average

Kentucky average: 1.9%

Lost Too Much Weight Info Percent of long-stay residents who lose too much weight 9.4%
39% worse than Kentucky average

Kentucky average: 6.8%

Depressive Symptoms Info Percent of long-stay residents who have depressive symptoms 3.4%
76% better than Kentucky average

Kentucky average: 14.3%

Antipsychotic Use Info Percent of long-stay residents who received an antipsychotic medication 17.5%
12% worse than Kentucky average

Kentucky average: 15.6%

Pneumococcal Vaccine Info Percent of long-stay residents assessed and appropriately given the pneumococcal vaccine 97.4%
In line with Kentucky average

Kentucky average: 93.9%

Influenza Vaccine Info Percent of long-stay residents assessed and appropriately given the seasonal influenza vaccine 98.7%
In line with Kentucky average

Kentucky average: 96.2%

Hospitalizations per 1,000 days Info Number of hospitalizations per 1,000 long-stay resident days. 1.61
14% better than Kentucky average

Kentucky average: 1.87

ED visits per 1,000 days Info Number of outpatient emergency department visits per 1,000 long-stay resident days. 1.60
27% better than Kentucky average

Kentucky average: 2.19

Short-stay resident measures
Significantly below average Kentucky avg: 2.2 Info CMS star rating based on short-stay quality measure performance. 5 stars = much above average, 1 star = much below average.
Pneumococcal Vaccine Info Percent of short-stay residents assessed and appropriately given the pneumococcal vaccine 81.4%
In line with Kentucky average

Kentucky average: 83.7%

Antipsychotic medication increase Info Percent of short-stay residents who newly received an antipsychotic medication 2.8%
43% worse than Kentucky average

Kentucky average: 1.9%

Influenza Vaccine Info Percent of short-stay residents assessed and appropriately given the seasonal influenza vaccine 81.5%
In line with Kentucky average

Kentucky average: 83.6%

Re-hospitalized after SNF stay Info Percentage of short-stay residents who were re-hospitalized after their nursing home admission. 29.0%
18% worse than Kentucky average

Kentucky average: 24.5%

Emergency department visits Info Percentage of short-stay residents who had an outpatient emergency department visit. 12.7%
9% better than Kentucky average

Kentucky average: 13.9%

Falls with major injury Info Percentage of SNF residents who experience falls with major injury during their stay. 0.0%
100% better than Kentucky average

Kentucky average: 0.8%

Ability to care for self at discharge Info Percentage of residents at or above expected ability to care for themselves at discharge. 42.3%
21% worse than Kentucky average

Kentucky average: 53.7%

Successful return to home or community Info Rate of successful return to home or community from a skilled nursing facility. 52.9%
5% better than Kentucky average

Kentucky average: 50.6%

Breakdown by payment type

Medicare

20% of new residents, usually for short-term rehab.

Typical stay 2 - 3 months

Private pay

50% of new residents, often for short stays.

Typical stay 1 - 2 months

Medicaid

30% of new residents, often for long-term daily care.

Typical stay 1 years

Facility Characteristics

Source: CMS Long-Term Care Facility Characteristics (Data as of Jan 2026)

Total residents 86
Medicare
9
10.5% of residents
Medicaid
67
77.9% of residents
Private pay or other
10
11.6% of residents
Programs & Services
Residents Group

Residents meet regularly to discuss policies, care quality, and activities

Active Resident Council

Organized group of residents that meets regularly to discuss facility policies, quality of life, and activities.

Finances and operations

Based on CMS SNF Cost Report for fiscal year ending in 12/2023.

For-profit
Operated by a single business entity.
Net patient revenue Info Net patient revenue — what the home actually collects for resident care, after contractual allowances, bad debt and discounts are subtracted from its gross charges (CMS cost report, Worksheet G-3). It covers resident care only; money the home earns from other sources is shown separately as "Other income."
$8.7M
Net patient income Info Net patient income: net patient revenue minus the home's total operating expenses. A positive figure means it earns more from resident care than it spends to deliver it; a negative figure means the opposite. It excludes non-operating "other income."
-$1.2M
For-profit Operated by a single business entity.
Net patient revenue Info Net patient revenue — what the home actually collects for resident care, after contractual allowances, bad debt and discounts are subtracted from its gross charges (CMS cost report, Worksheet G-3). It covers resident care only; money the home earns from other sources is shown separately as "Other income."
$8.7M Rank #69 / 197Revenue — State benchmarkedThis home is ranked 69th out of 197 homes in Kentucky. Shows this facility's annual revenue compared to the Kentucky average. Higher revenue generally means more resources for staffing and capital — read alongside Payroll %.Rankings are based only on facilities in Kentucky that report data for that category. Facilities without available data are excluded from the ranking.Click the rank badge to see the full State ranking.Click here to see the full State ranking.
Net patient income Info Net patient income: net patient revenue minus the home's total operating expenses. A positive figure means it earns more from resident care than it spends to deliver it; a negative figure means the opposite. It excludes non-operating "other income."
-$1.2M
Other income Info Money the home earns outside of resident care — such as investments, grants, rentals and other non-operating sources (CMS cost report, Worksheet G-3). It is tracked separately from net patient revenue: it is not part of that figure, and it is not included in net patient income.
$1.3M
Payroll costs Info Staff salaries plus wage-related costs — benefits such as payroll taxes, health insurance and retirement — from the home's own accounting records (CMS cost report, Worksheet A). Contract or agency labor is counted separately, under other operating costs. Rank #97 / 197Payroll — State benchmarkedThis home is ranked 97th out of 197 homes in Kentucky. Shows total annual staff payroll benchmarked to the Kentucky average. Higher payroll investment relative to peers often signals better staffing and less reliance on cheaper contract labor.Rankings are based only on facilities in Kentucky that report data for that category. Facilities without available data are excluded from the ranking.Click the rank badge to see the full State ranking.Click here to see the full State ranking.
$4.6M 52.8% of net patient revenue Info Payroll as a share of revenue: staff salaries and wage-related benefits divided by net patient revenue. A higher figure means more of each revenue dollar goes to staff pay. Rank #162 / 197Payroll % — State benchmarkedThis home is ranked 162nd out of 197 homes in Kentucky. Shows payroll as a percentage of revenue versus the Kentucky average. Well-run Kentucky facilities typically land around 51–61% — the top third Statewide. Below 25% may signal understaffing or heavy agency use — read with Staffing ratings.Rankings are based only on facilities in Kentucky that report data for that category. Facilities without available data are excluded from the ranking.Click the rank badge to see the full State ranking.Click here to see the full State ranking.
Other operating costs Info Everything it costs to run the home apart from payroll — food, utilities, supplies, maintenance, contract labor and administration. Calculated as total operating expense minus payroll (staff salaries and wage-related benefits).
$5.3M
Total costs Info The home's total operating expense for the year — all the costs of running it, salaries included (CMS cost report, Worksheet G-3).
$9.9M

Who this home usually serves

TYPE OF STAY

Mostly long-term care residents

Most residents stay for extended periods and receive ongoing daily care.

Most new residents arrive under private pay (50% of admissions), and a typical private pay stay runs around 1 - 2 months.

Admissions
169 total

Coverage residents most often arrive under.

Medicare 20%
Private pay 50%
Medicaid 30%
Discharges
152 total

Coverage residents most often leave under.

Medicare 39%
Private pay 36%
Medicaid 25%

Places of interest near Frankfort Care and Rehabilitation

Address 1.2 miles from city center Info Estimated distance in miles from Frankfort's city center to Frankfort Care and Rehabilitation's address, calculated via Google Maps.

Calculate Travel Distance to Frankfort Care and Rehabilitation

Add your location

Address

Compare Nursing Homes around Frankfort

The information below is reported by the Kentucky Cabinet for Health and Family Services, Office of Inspector General.

4 facilities compared · CMS & KY Dept. of Health data

Frankfort Care and Rehabilitation
NH
AL
HC
Frankfort
100
Facility 100
KY AVG 82
Rank #97 / 341
76.5%
Facility 76.5%
KY AVG 81.3%
Rank #159 / 209
-6%
3.05
Facility 3.05
KY AVG 3.75
Rank #154 / 193
+6% -19%
$0
Facility $0
KY AVG $65.4k
Rank #1 / 199
7
Facility 7
KY AVG 13.5
Rank #38 / 195
3.5
Facility 3.5
KY AVG 4.4
Rank #78 / 195
- 92 -
30
Facility 30
KY AVG 41
Rank #284 / 423
Lexington Health Management LLC
$8.7M
Facility $8.7M
KY AVG $10.5M
Rank #69 / 197
$4.6M
Facility $4.6M
KY AVG $4.0M
Rank #97 / 197
52.8%
Facility 52.8%
KY AVG 40.7%
Rank #162 / 197
185159
The Homeplace at Midway
NH
AL
IL
MC
NC
Midway
19
Facility 19
KY AVG 82
Rank #331 / 341
100.0%
Facility 100.0%
KY AVG 81.3%
Rank #1 / 209
+23%
5.44
Facility 5.44
KY AVG 3.75
Rank #10 / 193
+52% +45%
$4.1k
Facility $4.1k
KY AVG $65.4k
Rank #137 / 199
9
Facility 9
KY AVG 13.5
Rank #67 / 195
3.0
Facility 3.0
KY AVG 4.4
Rank #48 / 195
- 26 -
15
Facility 15
KY AVG 41
Rank #353 / 423
Bruce Lucas
$3.6M
Facility $3.6M
KY AVG $10.5M
Rank #180 / 197
$1.9M
Facility $1.9M
KY AVG $4.0M
Rank #177 / 197
53.9%
Facility 53.9%
KY AVG 40.7%
Rank #70 / 197
185479
Bradford Square
NH
Frankfort
100
Facility 100
KY AVG 82
Rank #97 / 341
86.5%
Facility 86.5%
KY AVG 81.3%
Rank #104 / 209
+6%
3.20
Facility 3.20
KY AVG 3.75
Rank #117 / 193
-29% -15%
$13.6k
Facility $13.6k
KY AVG $65.4k
Rank #158 / 199
18
Facility 18
KY AVG 13.5
Rank #143 / 195
4.5
Facility 4.5
KY AVG 4.4
Rank #111 / 195
1 91 -
43
Facility 43
KY AVG 41
Rank #206 / 423
-
$8.7M
Facility $8.7M
KY AVG $10.5M
Rank #55 / 197
$4.2M
Facility $4.2M
KY AVG $4.0M
Rank #66 / 197
48.5%
Facility 48.5%
KY AVG 40.7%
Rank #111 / 197
185170
Signature HealthCARE at Heritage Hall Rehab & Wellness Center
NH
HC
PC
RC
Lawrenceburg
94
Facility 94
KY AVG 82
Rank #120 / 341
77.1%
Facility 77.1%
KY AVG 81.3%
Rank #157 / 209
-5%
3.84
Facility 3.84
KY AVG 3.75
Rank #40 / 193
+27% +2%
$185.2k
Facility $185.2k
KY AVG $65.4k
Rank #192 / 199
23
Facility 23
KY AVG 13.5
Rank #166 / 195
5.8
Facility 5.8
KY AVG 4.4
Rank #150 / 195
5 85 -
58
Facility 58
KY AVG 41
Rank #109 / 423
Lisa Colllier
$8.0M
Facility $8.0M
KY AVG $10.5M
Rank #68 / 197
$3.6M
Facility $3.6M
KY AVG $4.0M
Rank #92 / 197
44.7%
Facility 44.7%
KY AVG 40.7%
Rank #157 / 197
185277

Financial Assistance for
Nursing Home in Kentucky

Frankfort Care and Rehabilitation is located in Frankfort, Kentucky.
Here are the financial assistance programs available to residents in Kentucky.

Get Financial aid guidance

Home and Community Based Waiver

Kentucky Medicaid HCB Waiver

Age 65+ or disabled
General Kentucky resident, Medicaid-eligible, nursing home-level care need.
Income Limits (2025) ~$2,829/month 300% FBR, individual
Asset Limits $2,000 (individual), $3,000 (couple).
KY

Rural focus; waitlists possible.

Benefits
Personal care (5-7 hours/day) Respite (240 hours/year) Homemaker services Home modifications

Hart-Supported Living Program

KY Hart-Supported Living

Age 65+ or disabled
General Kentucky resident.
Income Limits No strict limit; prioritizes low-income.
Asset Limits Not applicable.
KY

Competitive grants; limited availability.

Benefits
In-home support (up to 10 hours/week) Respite (varies) Adaptive equipment (~$500 avg.)

Kentucky Homecare Program

Kentucky Homecare Program

Age 60+
General Kentucky resident, at risk of nursing home placement, not eligible for Medicaid waivers.
Income Limits (2025) No strict limit; prioritizes low-income ~$24,980/year individual
Asset Limits Not assessed; need-based focus.
KY

15 AAAs; rural focus; not in nursing homes.

Benefits
Personal care (4-6 hours/day) Respite (5 days/year) Chore services Meal delivery ($7/meal) Minor home repairs

Medicare Savings Program (MSP)

Kentucky Medicare Savings Program

Age 65+ or disabled
General Kentucky resident, Medicare Part A/B.
Income Limits (2025) ~$2,510/month (QMB), ~$3,380/month (SLMB), ~$3,598/month (QI)—individual.
Asset Limits $9,430 (individual), $14,130 (couple).
KY

Three tiers; no waitlist; auto Extra Help for Part D.

Benefits
Covers Part B premiums ($174.70/month) Deductibles ($240/year) Copays (~20%)

National Family Caregiver Support Program (NFCSP) Respite

Kentucky NFCSP Respite Care

Age
General Caregivers of 60+ needing care or 55+ caregivers of others; Kentucky resident; functional needs (2+ ADLs).
Income Limits (2025) Prioritizes ~$24,980/year (individual); no strict cap.
Asset Limits Not assessed; need-based.
KY

15 AAAs; prioritizes low-income, rural caregivers.

Benefits
Respite (4-6 hours/week or 5 days/year) Adult day care ($55/day) Caregiver training Supplies (~$500/year)

Kentucky Family Caregiver Program

Kentucky Family Caregiver Program

Age
General Grandparents (often 55+) as primary caregivers to grandchildren under 18, Kentucky resident, not on Kinship Care.
Income Limits (2025) ~$31,225/year (individual); varies by AAA.
Asset Limits Not strictly assessed; need-based.
KY

Max $1,500/year; statewide via AAAs.

Benefits
Grants (~$500-$1,500/year) for respite Supplies Care costs; counseling Training

VA Aid and Attendance (A&A) and Housebound Benefits

Kentucky VA Aid and Attendance/Housebound

Age 65+ or disabled veteran/spouse
General Kentucky resident, wartime service, need for ADL help (A&A) or homebound.
Income Limits (2025) Net income < ~$1,984/month (veteran with dependent, A&A); pension offsets income.
Asset Limits ~$155,356 net worth limit
KY

High veteran demand in rural areas.

Benefits
Cash (~$1,433-$2,642/month veteran, ~$951-$1,318 spouse) for care costs (e.g., in-home, assisted living)

Frequently Asked Questions about Frankfort Care and Rehabilitation

Is Frankfort Care and Rehabilitation in a walkable area?

Frankfort Care and Rehabilitation has a walk score of 30. Somewhat walkable. A few nearby services may be reachable on foot, but most trips require transportation.

What is the occupancy rate at Frankfort Care and Rehabilitation?

Frankfort Care and Rehabilitation's occupancy is 76.5%.

Does Frankfort Care and Rehabilitation operate as a for-profit or non-profit?

Frankfort Care and Rehabilitation is registered as a for-profit.

Are there photos of Frankfort Care and Rehabilitation?

Yes — there are 5 photos of Frankfort Care and Rehabilitation in the photo gallery on this page.

What is the address of Frankfort Care and Rehabilitation?

Frankfort Care and Rehabilitation is located at 117 Old Soldiers Ln, Frankfort, KY 40601.

What is the phone number of Frankfort Care and Rehabilitation?

(502) 875-7272 will put you in contact with the team at Frankfort Care and Rehabilitation.

Is Frankfort Care and Rehabilitation Medicare or Medicaid certified?

Yes — Frankfort Care and Rehabilitation is a CMS-certified provider of Medicare and Medicaid.

Guides for Better Senior Living

Care Cost Calculator: See Prices in Your Area

Nursing Home Data Explorer

Don’t Wait Too Long: 7 Red Flag Signs Your Parent Needs Assisted Living Now

The True Cost of Assisted Living in 2025 – And How Families Are Paying For It

Understanding Senior Living Costs: Pricing Models, Discounts & Financial Assistance