Brandon Community Carew Center
Nursing Home · Mississippi, MS
CMS overall rating Info The Overall CMS Rating is scored from 1 to 5 stars and combines results from health inspections, staffing levels, and quality measures. Health inspections carry the most weight. Staffing and quality scores can increase or decrease the final rating based on performance compared to state and national standards.

Brandon Community Carew Center

Nursing Home · Mississippi, MS
CMS overall rating Info The Overall CMS Rating is scored from 1 to 5 stars and combines results from health inspections, staffing levels, and quality measures. Health inspections carry the most weight. Staffing and quality scores can increase or decrease the final rating based on performance compared to state and national standards.
Calculator: See prices in your area
Brandon Community Carew Center accepts Medicaid, Medicare, and private pay.

Overview of Brandon Community Carew Center

Brandon Nursing and Rehabilitation Center is located in Brandon, Mississippi. It provides skilled nursing services, outpatient therapy, and rehabilitation programs for residents. The facility is committed to delivering high-quality care tailored to individual needs.
(601) 825-3192

Quality ratings

Measured by Centers for Medicare & Medicaid Services (CMS)

Overall rating Info The Overall CMS Rating combines results from health inspections, staffing levels and quality measures. Health inspections carry the most weight. Staffing and quality scores can increase or decrease the final rating based on performance compared to state and national standards.
▼ 60.9% Below MS avg.
Health Inspection Info Based on the results of the facility's three most recent standard inspections and any complaint investigations. CMS reviews the number, scope, and severity of deficiencies, with more recent findings weighted more heavily.
▼ 64.7% Below MS avg.
Staffing Info Measures average nursing staff hours per resident per day, including Registered Nurses (RNs) and total nursing staff. Ratings are adjusted based on the level of care residents require and are compared to state and national benchmarks.
▼ 8.3% Below MS avg.
Quality Measures Info Based on clinical and physical health indicators reported to CMS, such as hospital readmissions, falls, pressure ulcers, and improvements in mobility. These measures reflect how well residents' health needs are being managed.
▼ 53.9% Below MS avg.

Staffing hours breakdown

Info Daily nursing hours per resident by staff type, reported to CMS. Higher is generally better — compare this facility to state and national averages to see where staffing stands.

Hours per resident per day — compared to Mississippi state averages

Total nursing care / resident Info Total adjusted nursing hours per resident per day, combining RN, LPN, and aide time. CMS adjusts this for case-mix so facilities can be fairly compared.
4h 51m per day
This facility Mississippi avg (4h 20m per day)
vs Mississippi avg
+12%

3 of 6 metrics below state avg

Standout metric Physical Therapist is +150% above state avg
Staff typeHours / dayvs state avg
Registered Nurse (RN) Info RNs hold the highest nursing license and can assess residents, interpret test results, and direct care plans. More RN hours per day often signals stronger clinical oversight and faster response to health changes. 20m per day ▼ 47% State avg: 38m per day · National avg: 41m per day
LPN / LVN Info Licensed Practical Nurses (LPNs) or Licensed Vocational Nurses (LVNs) deliver routine hands-on care — medication administration, wound dressing, and monitoring vital signs. They work under RN supervision and make up a large share of daily bedside care. 1h 7m per day ■ Avg State avg: 1h 6m per day · National avg: 52m per day
Nurse Aide Info Certified Nurse Aides (CNAs) provide the most direct day-to-day assistance: bathing, dressing, feeding, and mobility. Nurse aide hours are typically the largest staffing category and directly affect residents' quality of life. 2h 51m per day ▲ 15% State avg: 2h 29m per day · National avg: 2h 20m per day
Total Nursing (Weekend) Info Combined nursing hours (RN + LPN + Nurse Aide) per resident per day on weekends. Staffing often drops on weekends — this figure reveals whether the facility maintains adequate coverage outside of weekday hours. 3h 13m per day ▼ 8% State avg: 3h 31m per day · National avg: 3h 26m per day
Physical Therapist Info Hours per resident per day provided by licensed Physical Therapists (PTs) or PT Assistants. PT services help residents recover mobility after injury or illness and are especially important for post-acute (short-stay) rehabilitation. 5m per day ▲ 150% State avg: 2m per day · National avg: 4m per day
RN (Weekend) Info Registered nurse hours specifically on weekends. Facilities sometimes reduce RN presence on Saturdays and Sundays — a low weekend RN figure compared to weekday hours can indicate reduced clinical oversight when most administrative staff are absent. 10m per day ▼ 55% State avg: 22m per day · National avg: 28m per day

Capacity and availability

This home usually has limited availability

Occupancy between 85% and 95% suggests balanced demand.

Higher occupancy than the Mississippi average: 82.3%
Occupancy rate 90.4%
Avg. Length of Stay 288 days
Occupancy rate
90.4%
Avg. Length of Stay
288 days

Who this home usually serves

TYPE OF STAY

Mostly short-term rehab stays

Most residents typically stay for a few weeks or months before returning home or moving on.

Breakdown by payment type

Medicare

46% of new residents, usually for short-term rehab.

Typical stay 2 - 3 months

Private pay

37% of new residents, often for short stays.

Typical stay 3 - 4 months

Medicaid

16% of new residents, often for long-term daily care.

Typical stay 3 - 4 years

Finances and operations

Privately-owned community
Home revenue
$21.6M
Profit
$678.4K
Privately-owned community
Home revenue
$21.6M
Profit
$678.4K
Payroll costs Info The portion of the home's budget spent on staff, including nurses, caregivers, and other employees who support care and operations.
$12.6M
58.2% of revenue
Other operating costs Info All remaining costs needed to run the home, such as food, utilities, building maintenance, supplies and administrative expenses.
$8.4M
Total costs $21.0M
Bed community size
230-bed community
A large-scale community that may provide a wide range of amenities, services, and structured programs.
Walk Score
Walk Score: 28 / 100
Somewhat walkable. A few nearby services may be reachable on foot, but most trips require transportation.

About this community

License Details

Facility TypeNursing Home Facilities
CountyRankin

Ownership & Operating Entity

Brandon Community Carew Center is administrated by Felicia Scott.

Payment & Insurance

2 services
Accept Medicaid
Accept Medicare

Therapy & Rehabilitation

1 service
Rehabilitation Services

Staffing & Medical

2 services
Doctor on Staff
24-Hour Staffing

Amenities & Lifestyle

Free In-Room Cable Access
Free Wi-Fi
State-Of-The-Art Therapy Equipment
Friendly Staff
Specific ProgramsSkilled Nursing Services, Outpatient Therapy Services, Rapid Recovery Rehabilitation Suites, Sub-Acute Rehabilitation, Enhancement Therapy, Post Surgery Rehabilitation, Endurance/Strength Training, Sports Medicine / Enhancement Therapy, Stroke Recovery, Cardiac Care, Post-Orthopedic Surgery, Stroke and cardiovascular rehab, Complex Wound Care / Wound Vacs, Respiratory services, Spa with whirlpool tub, Private courtyard, Caring Curls Beauty Salon, Dialysis Care, Clinical Laboratory Services, Dental Services, Podiatry Services, X-Ray Services, Ophthalmologist Services, Ambulation & Transfer Training, Balance/Falls Management, Care for Stroke Survivors, Cerebral Palsy, MS and Parkinson’s, Cognitive Linguistics Therapy, Dysphagia (Swallowing) Therapy, Pain Management, Positioning, Speech/Language Therapy, Strength/endurance training

Contact Brandon Community Carew Center

Inspection History

In Mississippi, the State Department of Health, Bureau of Health Facilities Licensure conducts unannounced surveys to monitor facility compliance with health, safety, and resident rights laws.

Read the full inspection reports for this facility, including detailed findings and corrective actions.

Show Inspection Reports

Health Inspection History

Inspections
Total health inspections 11

Mississippi average 4.4


Last Health inspection on Jul 2025

Total health citations
43

Mississippi average 16.9

Citations per inspection
3.91

Mississippi average 3.83


Health citations are formal notices following inspections when they fail to comply with safety and care standards.

18 of 43 citations resulted from standard inspections; 22 of 43 resulted from complaint investigations; and 3 of 43 came from combined inspections (standard and complaint).

Breakdown of citation severity (last 4 years)
Critical Health citations More info
6
500% worse than Mississippi average

Mississippi average: 1


Serious Health citations More info 4
264% worse than Mississippi average

Mississippi average: 1.1

6 critical citations More info Mississippi average: 1

4 serious citations More info Mississippi average: 1.1

33 moderate citations More info Mississippi average: 14.6

0 minor citations More info Mississippi average: 0.3
Citations history (last 4 years)
Nutrition moderate citation Info Issues related to food quality, meal service, and resident's nutritional needs. Jul 31, 2025
Corrected

Nutrition moderate citation Info Issues related to food quality, meal service, and resident's nutritional needs. Jul 31, 2025
Corrected

Quality of Care moderate citation Info Issues related to how well residents receive appropriate treatment and support for their medical and daily care needs. Jul 31, 2025
Corrected

Resident Rights moderate citation Info Issues related to resident's rights, including dignity, privacy, and the ability to make decisions about their care. Jul 31, 2025
Corrected

Financial Assistance for
Nursing Home in Mississippi

Brandon Community Carew Center is located in Brandon, Mississippi.
Here are the financial assistance programs available to residents in Mississippi.

Get Financial aid guidance

Elderly and Disabled Waiver

Mississippi Medicaid E&D Waiver

Age 65+ or disabled
General Mississippi resident, Medicaid- eligible, nursing home-level care need.
Income Limits (2025) ~$2,829/month 300% FBR, individual
Asset Limits $4,000 individual, higher than most states
MS

Higher asset limit; rural focus.

Benefits
Personal care (5-7 hours/day) Respite (240 hours/year) Adult day care ($60/day) Meals ($6/meal)

Mississippi Caregiver Respite Program

MS NFCSP Respite

Age Caregiver of someone 60+
General Mississippi resident.
Income Limits No strict limit; prioritizes low-income.
Asset Limits Not applicable.
MS

Limited slots; rural emphasis.

Benefits
In-home respite (4-6 hours/day) Adult day care (~$60/day) Short-term facility care (up to 5 days)

Assisted Living (AL) Waiver

Mississippi Assisted Living Waiver

Age 65+ or disabled
General Mississippi resident, Medicaid-eligible, NFLOC, living in approved AL facility.
Income Limits (2025) ~$2,829/month (300% FBR, individual); QIT required.
Asset Limits $4,000 (individual), $6,000 (couple).
MS

Only for AL facilities with waiver contracts; small program size.

Benefits
Personal care Meals Medication management Respite Transportation within AL facility

Independent Living (IL) Waiver

Mississippi Independent Living Waiver

Age 16+ (65+ for seniors)
General Mississippi resident, Medicaid-eligible, NFLOC but capable of self-direction.
Income Limits (2025) ~$2,829/month (300% FBR, individual); QIT required.
Asset Limits $4,000 (individual), $6,000 (couple).
MS

Self-directed care; limited to in-home settings.

Benefits
Personal care (4-6 hours/day) Respite (~200 hours/year) Home mods Assistive tech Transition services

Medicare Savings Program (MSP)

Mississippi Medicare Savings Program

Age 65+ or disabled
General Mississippi resident, Medicare Part A/B.
Income Limits (2025) ~$2,510/month (QMB), ~$3,380/month (SLMB), ~$3,598/month (QI)—individual.
Asset Limits $9,430 (individual), $14,130 (couple).
MS

Three tiers; no waitlist; includes Extra Help for Part D.

Benefits
Covers Part B premiums ($174.70/month) Deductibles ($240/year) Copays (~20%)

Mississippi Homemaker Program

Mississippi Homemaker Program (via Area Agencies on Aging)

Age 60+
General Mississippi resident, not Medicaid-eligible, needs assistance with daily living.
Income Limits (2025) ~$1,063/month (100% FPL, individual); prioritizes low-income.
Asset Limits Not strictly assessed; need-based focus.
MS

10 AAAs; waitlist possible due to funding caps.

Benefits
Homemaker services (2-4 hours/day, e.g., cleaning, meal prep) Respite (~2 days/year) Transportation Meals

VA Aid and Attendance (A&A) and Housebound Benefits

Mississippi VA Aid and Attendance/Housebound

Age 65+ or disabled veteran/spouse
General Mississippi resident, wartime service, need for ADL help (A&A) or homebound.
Income Limits (2025) Net income < ~$1,984/month (veteran with dependent, A&A); pension offsets income.
Asset Limits ~$155,356 net worth limit
MS

High veteran population in rural areas.

Benefits
Cash (~$1,433-$2,642/month veteran, ~$951-$1,318 spouse) for care costs (e.g., in-home, assisted living)

Places of interest near Brandon Community Carew Center

Address 0.0 miles from city center Info Estimated distance in miles from Brandon's city center to Brandon Community Carew Center's address, calculated via Google Maps.

Calculate Travel Distance to Brandon Community Carew Center

Add your location

Address

Staffing Data (Q2 2025)

This data corresponds to Q2 2025 and is based on CMS Payroll-Based Journal.

Total staff 390
Employees 308
Contractors 82
Staff to resident ratio 1.90:1
12% better than Mississippi average

Mississippi average ratio: 1.69:1

Avg staff/day 118
Average shift 8.5 hours
6% better than Mississippi average

Mississippi average: 8 hours

Total staff hours (quarter) 91,707

Nursing staff breakdown

Registered Nurse

Manages medical care and health needs.

Total count 16
Average shift length Info Average shift length. Calculated as total hours divided by days worked and average staff per day. 10 hours

No contractors work on this role.

Licensed Practical Nurse

Assists with medical care and medications.

Total count 90
Average shift length Info Average shift length. Calculated as total hours divided by days worked and average staff per day. 9.3 hours

This role is partially covered by contractors.

Certified Nursing Assistant

Helps with daily care and mobility.

Total count 178
Average shift length Info Average shift length. Calculated as total hours divided by days worked and average staff per day. 8.7 hours

This role is partially covered by contractors.

Contractor staffing

Total hours from contractors

2.4%

2,240 contractor hours this quarter

Certified Nursing Assistant: 47 Licensed Practical Nurse: 33 Medical Director: 1 Occupational Therapy Assistant: 1

Staff by category

Certified Nursing Assistant1314717845,05291100%8.7
Licensed Practical Nurse57339018,27991100%9.3
Physical Therapist260265,69691100%8
Registered Nurse160163,51491100%10
Clinical Nurse Specialist7072,9217178%7.9
Nurse Aide in Training190192,6979099%6.6
Respiratory Therapy Technician4041,5147178%7.7
Administrator4041,4006673%8
RN Director of Nursing4041,2867380%8
Therapeutic Recreation Specialist4041,2436673%7.8
Speech Language Pathologist5051,2296976%6.4
Physical Therapy Assistant8081,1727178%7.1
Qualified Social Worker8081,1717279%6.5
Dental Services Staff3031,0596571%9.3
Physical Therapy Aide4049707380%6.8
Other Dietary Services Staff3037758088%7.5
Dietitian1015206571%8
Occupational Therapy Aide1014725965%8
Mental Health Service Worker1014565763%8
Nurse Practitioner2022483134%8
Medical Director011261618%1.6
Occupational Therapy Assistant011822%4.2
178 Certified Nursing Assistant
% of Days 100%
90 Licensed Practical Nurse
% of Days 100%
26 Physical Therapist
% of Days 100%
16 Registered Nurse
% of Days 100%
7 Clinical Nurse Specialist
% of Days 78%
19 Nurse Aide in Training
% of Days 99%
4 Respiratory Therapy Technician
% of Days 78%
4 Administrator
% of Days 73%
4 RN Director of Nursing
% of Days 80%
4 Therapeutic Recreation Specialist
% of Days 73%
5 Speech Language Pathologist
% of Days 76%
8 Physical Therapy Assistant
% of Days 78%
8 Qualified Social Worker
% of Days 79%
3 Dental Services Staff
% of Days 71%
4 Physical Therapy Aide
% of Days 80%
3 Other Dietary Services Staff
% of Days 88%
1 Dietitian
% of Days 71%
1 Occupational Therapy Aide
% of Days 65%
1 Mental Health Service Worker
% of Days 63%
2 Nurse Practitioner
% of Days 34%
1 Medical Director
% of Days 18%
1 Occupational Therapy Assistant
% of Days 2%

Facility Characteristics

Source: CMS Long-Term Care Facility Characteristics (Data as of Jan 2026)

Total residents 205
Medicare
20
9.8% of residents
Medicaid
150
73.2% of residents
Private pay or other
35
17.1% of residents
Programs & Services
Residents Group

Residents meet regularly to discuss policies, care quality, and activities

Nurse Aide Training

State-approved Nurse Aide Training and Competency Evaluation Program on-site

CCRC

Part of a Continuing Care Retirement Community offering multiple care levels

Active Resident Council

Organized group of residents that meets regularly to discuss facility policies, quality of life, and activities.

Quality of care over time

These measures show how residents usually do over time at this home, based on health outcomes and preventive care.

High-risk clinical events score Info A composite score based on pressure ulcers, falls with injury, weight loss, walking ability decline, and activities of daily living decline. 10.9
12% better than Mississippi average

Mississippi average: 12.4

Functional decline score Info A composite score based on activities of daily living decline, walking ability decline, and incontinence. 16.3
27% better than Mississippi average

Mississippi average: 22.3

Long-stay resident measures
Below average Info CMS star rating based on long-stay quality measure performance. 5 stars = significantly above average, 1 star = significantly below average.
Need for Help with Daily Activities Increased Info Percent of long-stay residents whose need for help with daily activities has increased 14.7%
30% better than Mississippi average

Mississippi average: 21.2%

Walking Ability Worsened Info Percent of long-stay residents whose ability to move independently worsened 17.2%
30% better than Mississippi average

Mississippi average: 24.5%

Low Risk Residents with Bowel/Bladder Incontinence Info Percent of low risk long-stay residents who lose control of their bowels or bladder 16.8%
21% better than Mississippi average

Mississippi average: 21.4%

Falls with Major Injury Info Percent of long-stay residents experiencing one or more falls with major injury 1.7%
46% better than Mississippi average

Mississippi average: 3.2%

High Risk Residents with Pressure Ulcers Info Percent of long-stay high risk residents with pressure ulcers 6.4%
11% better than Mississippi average

Mississippi average: 7.1%

Urinary Tract Infection Info Percent of long-stay residents with a urinary tract infection 2.5%
In line with Mississippi average

Mississippi average: 2.6%

Lost Too Much Weight Info Percent of long-stay residents who lose too much weight 14.2%
128% worse than Mississippi average

Mississippi average: 6.2%

Depressive Symptoms Info Percent of long-stay residents who have depressive symptoms 0.6%
64% better than Mississippi average

Mississippi average: 1.5%

Antipsychotic Use Info Percent of long-stay residents who received an antipsychotic medication 28.8%
36% worse than Mississippi average

Mississippi average: 21.2%

Pneumococcal Vaccine Info Percent of long-stay residents assessed and appropriately given the pneumococcal vaccine 74.2%
23% worse than Mississippi average

Mississippi average: 95.9%

Influenza Vaccine Info Percent of long-stay residents assessed and appropriately given the seasonal influenza vaccine 50.5%
48% worse than Mississippi average

Mississippi average: 97.0%

Hospitalizations per 1,000 days Info Number of hospitalizations per 1,000 long-stay resident days. 2.92
20% worse than Mississippi average

Mississippi average: 2.44

ED visits per 1,000 days Info Number of outpatient emergency department visits per 1,000 long-stay resident days. 2.76
In line with Mississippi average

Mississippi average: 2.88

Short-stay resident measures
Significantly below average Info CMS star rating based on short-stay quality measure performance. 5 stars = much above average, 1 star = much below average.
Pneumococcal Vaccine Info Percent of short-stay residents assessed and appropriately given the pneumococcal vaccine 69.6%
21% worse than Mississippi average

Mississippi average: 87.9%

Antipsychotic medication increase Info Percent of short-stay residents who newly received an antipsychotic medication 3.1%
22% worse than Mississippi average

Mississippi average: 2.5%

Influenza Vaccine Info Percent of short-stay residents assessed and appropriately given the seasonal influenza vaccine 50.4%
40% worse than Mississippi average

Mississippi average: 84.6%

Re-hospitalized after SNF stay Info Percentage of short-stay residents who were re-hospitalized after their nursing home admission. 35.6%
28% worse than Mississippi average

Mississippi average: 27.9%

Emergency department visits Info Percentage of short-stay residents who had an outpatient emergency department visit. 12.9%
16% better than Mississippi average

Mississippi average: 15.3%

Falls with major injury Info Percentage of SNF residents who experience falls with major injury during their stay. 0.7%
14% better than Mississippi average

Mississippi average: 0.8%

Ability to care for self at discharge Info Percentage of residents at or above expected ability to care for themselves at discharge. 49.4%
8% worse than Mississippi average

Mississippi average: 53.7%

Successful return to home or community Info Rate of successful return to home or community from a skilled nursing facility. 37.1%
27% worse than Mississippi average

Mississippi average: 50.6%

Penalties and fines

Federal penalties imposed by CMS for regulatory violations, including civil money penalties (fines) and denials of payment for new Medicare/Medicaid admissions.

Source: CMS Penalties Database (Data as of Jan 2026)

Total fines amount $90K
128% higher than Mississippi average

Mississippi average: $39K

Number of fines 1
50% fewer fines than Mississippi average

Mississippi average: 2.0

Payment Denials Info Serious action where Medicare and/or Medicaid temporarily stops payments for new residents until issues are fixed. 1
340% more payment denials than Mississippi average

Mississippi average: 0.2

Fines amount comparison
This facility $90K
Mississippi average $39K
Penalty History

Penalties are imposed by CMS for violations of federal nursing home regulations.

2 penalties in the past 3 years

Multiple penalties were reported in the last 3 years.

Civil Money Penalty Info Fines imposed for noncompliance, which can be assessed per day or per instance of violation. Jan 31, 2025
$90K
Payment Denial Info Serious action where Medicare and/or Medicaid temporarily stops payments for new residents until issues are fixed. Jan 31, 2025
37 days

Last updated: Jan 2026

Compare Nursing Home around Mississippi

The information below is reported by the Mississippi State Department of Health, Bureau of Health Facilities Licensure.

5 facilities compared · CMS & MS Dept. of Health data · Updated May 2026

Filter by care type
Bedford Care Center of Mendenhall
NH

Nursing Home Licensed facility providing 24/7 skilled nursing care for residents with complex, ongoing medical needs. Staffed by RNs, LPNs, and CNAs. Inspected and star-rated annually by CMS. Accepts Medicare (short-term rehab) and Medicaid (long-term care).

AL

Assisted Living A licensed, long-term care setting for seniors or individuals with disabilities who need help with daily activities — like bathing, dressing, and medication management — but not 24-hour skilled nursing. Offers housing, meals, and around-the-clock support while aiming to maximize resident independence.

Mendenhall60 93.5% +14%5.42 +2%+17%151.7-56 40 Bedford Health Properties, LLC$8.7M$2.5M29.2%255149
Billdora Senior Care
NH

Nursing Home Licensed facility providing 24/7 skilled nursing care for residents with complex, ongoing medical needs. Staffed by RNs, LPNs, and CNAs. Inspected and star-rated annually by CMS. Accepts Medicare (short-term rehab) and Medicaid (long-term care).

AL

Assisted Living A licensed, long-term care setting for seniors or individuals with disabilities who need help with daily activities — like bathing, dressing, and medication management — but not 24-hour skilled nursing. Offers housing, meals, and around-the-clock support while aiming to maximize resident independence.

Tylertown60 77.1% -6%5.14 -26%+11%192.3149 41 -$6.3M$2.5M39.8%255243
Azalea Gardens Nursing Center
NH

Nursing Home Licensed facility providing 24/7 skilled nursing care for residents with complex, ongoing medical needs. Staffed by RNs, LPNs, and CNAs. Inspected and star-rated annually by CMS. Accepts Medicare (short-term rehab) and Medicaid (long-term care).

AL

Assisted Living A licensed, long-term care setting for seniors or individuals with disabilities who need help with daily activities — like bathing, dressing, and medication management — but not 24-hour skilled nursing. Offers housing, meals, and around-the-clock support while aiming to maximize resident independence.

Wiggins99 65.4% -21%4.32 -16%-7%0133.3661 47 Avonna Cain$9.4M$3.3M35.1%255233
Attala County Nursing Center
NH

Nursing Home Licensed facility providing 24/7 skilled nursing care for residents with complex, ongoing medical needs. Staffed by RNs, LPNs, and CNAs. Inspected and star-rated annually by CMS. Accepts Medicare (short-term rehab) and Medicaid (long-term care).

AL

Assisted Living A licensed, long-term care setting for seniors or individuals with disabilities who need help with daily activities — like bathing, dressing, and medication management — but not 24-hour skilled nursing. Offers housing, meals, and around-the-clock support while aiming to maximize resident independence.

Kosciusko120 75.9% -8%4.03 -7%-13%0184.52100 55 Amy Hood$8.8M$4.3M48.2%255191
Brandon Community Carew Center
NH

Nursing Home Licensed facility providing 24/7 skilled nursing care for residents with complex, ongoing medical needs. Staffed by RNs, LPNs, and CNAs. Inspected and star-rated annually by CMS. Accepts Medicare (short-term rehab) and Medicaid (long-term care).

AL

Assisted Living A licensed, long-term care setting for seniors or individuals with disabilities who need help with daily activities — like bathing, dressing, and medication management — but not 24-hour skilled nursing. Offers housing, meals, and around-the-clock support while aiming to maximize resident independence.

Brandon230 90.4% +10%4.85 -56%+5%2433.910210 28 Joyce Course$21.6M$8.5M39.2%255106

Guides for Better Senior Living

Care Cost Calculator: See Prices in Your Area

Nursing Home Data Explorer

Don’t Wait Too Long: 7 Red Flag Signs Your Parent Needs Assisted Living Now

The True Cost of Assisted Living in 2025 – And How Families Are Paying For It

Understanding Senior Living Costs: Pricing Models, Discounts & Financial Assistance

Frequently Asked Questions about Brandon Community Carew Center

Is Brandon Community Carew Center in a walkable area?

Brandon Community Carew Center has a walk score of 28. Somewhat walkable. A few nearby services may be reachable on foot, but most trips require transportation.

Who is the administrator of Brandon Community Carew Center?

Felicia Scott is the administrator of Brandon Community Carew Center.

How many beds does Brandon Community Carew Center have?

Brandon Community Carew Center has 230 beds.

Are there photos of Brandon Community Carew Center?

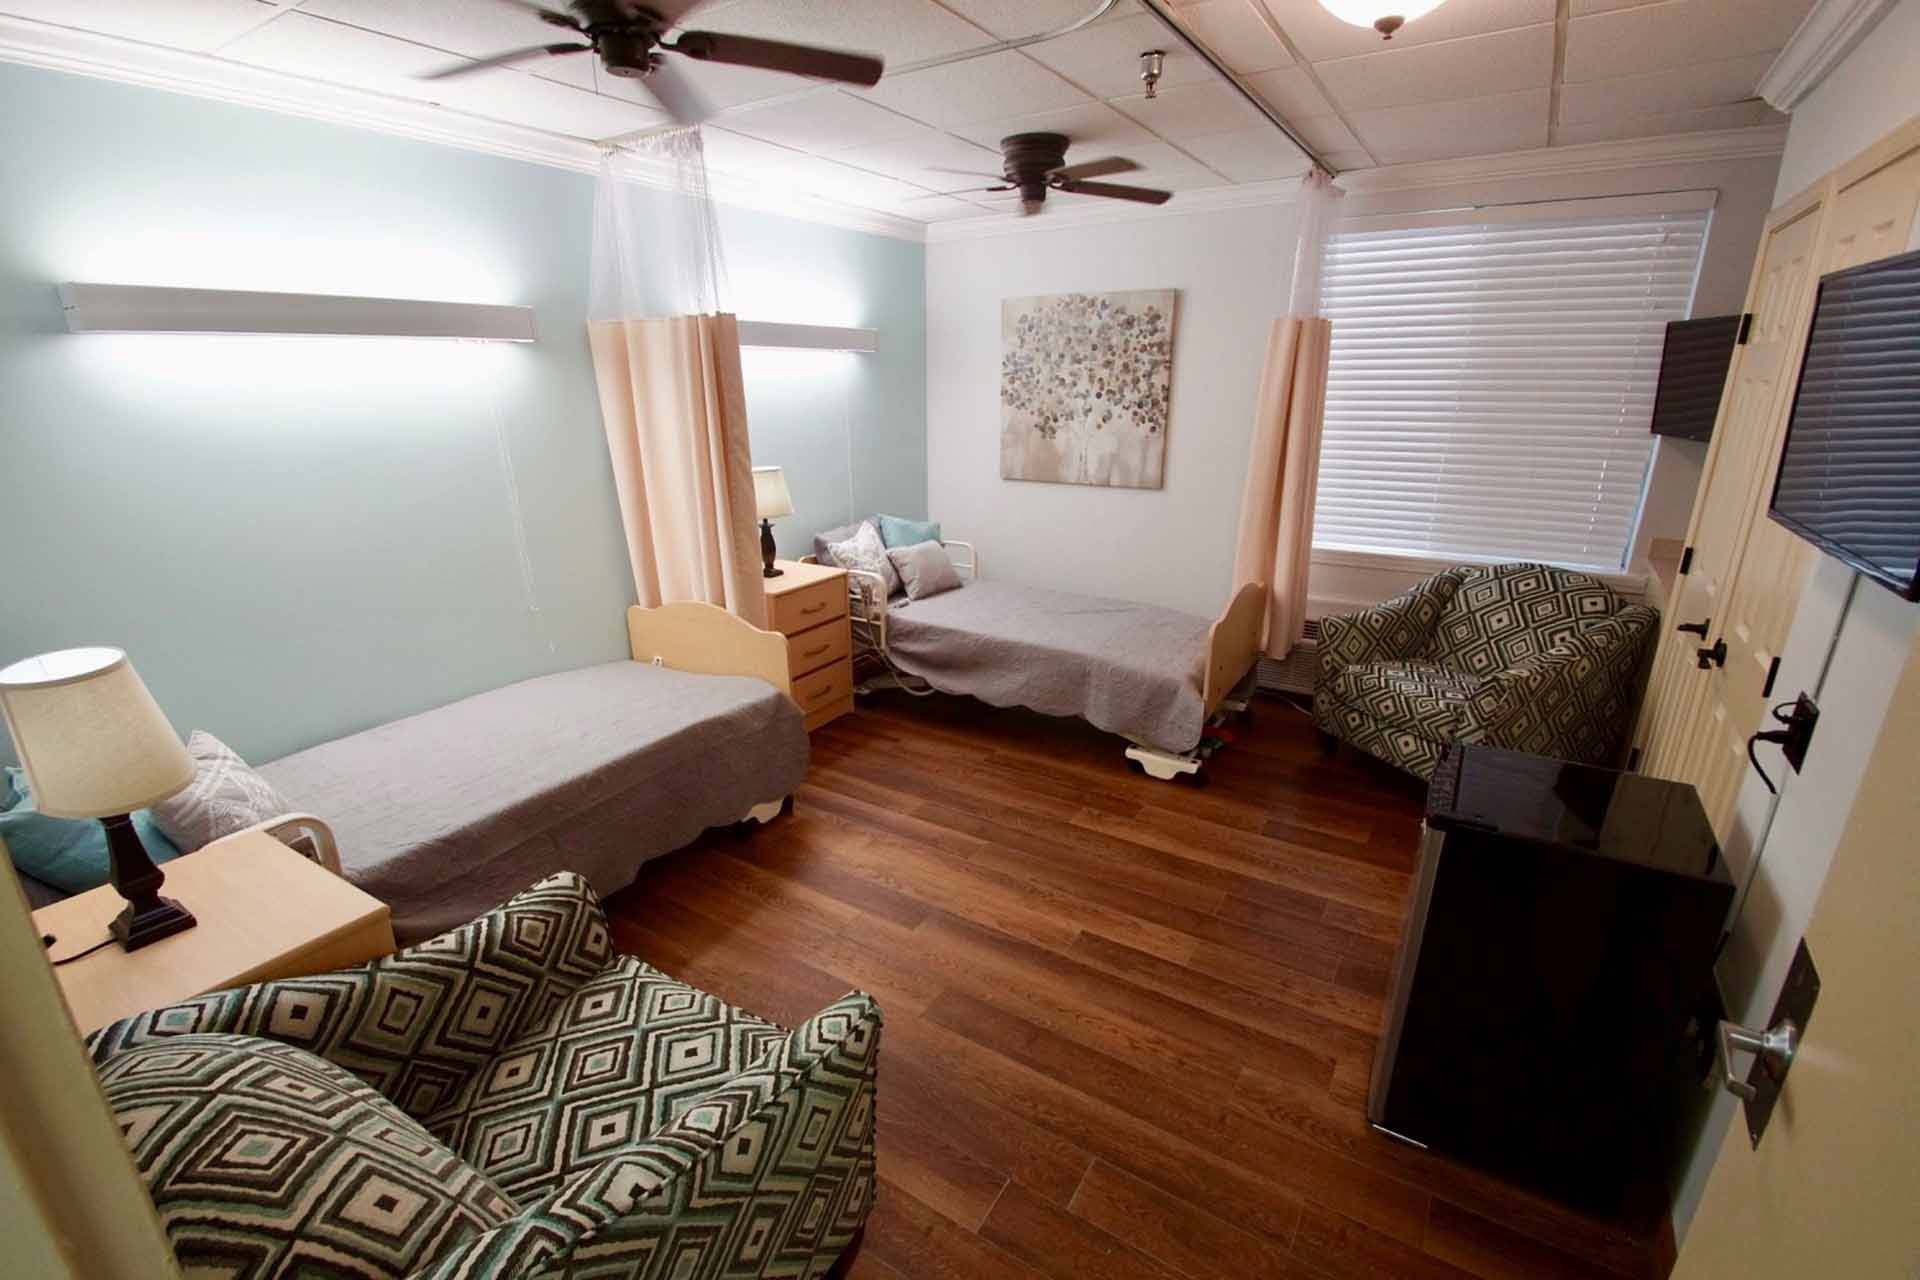
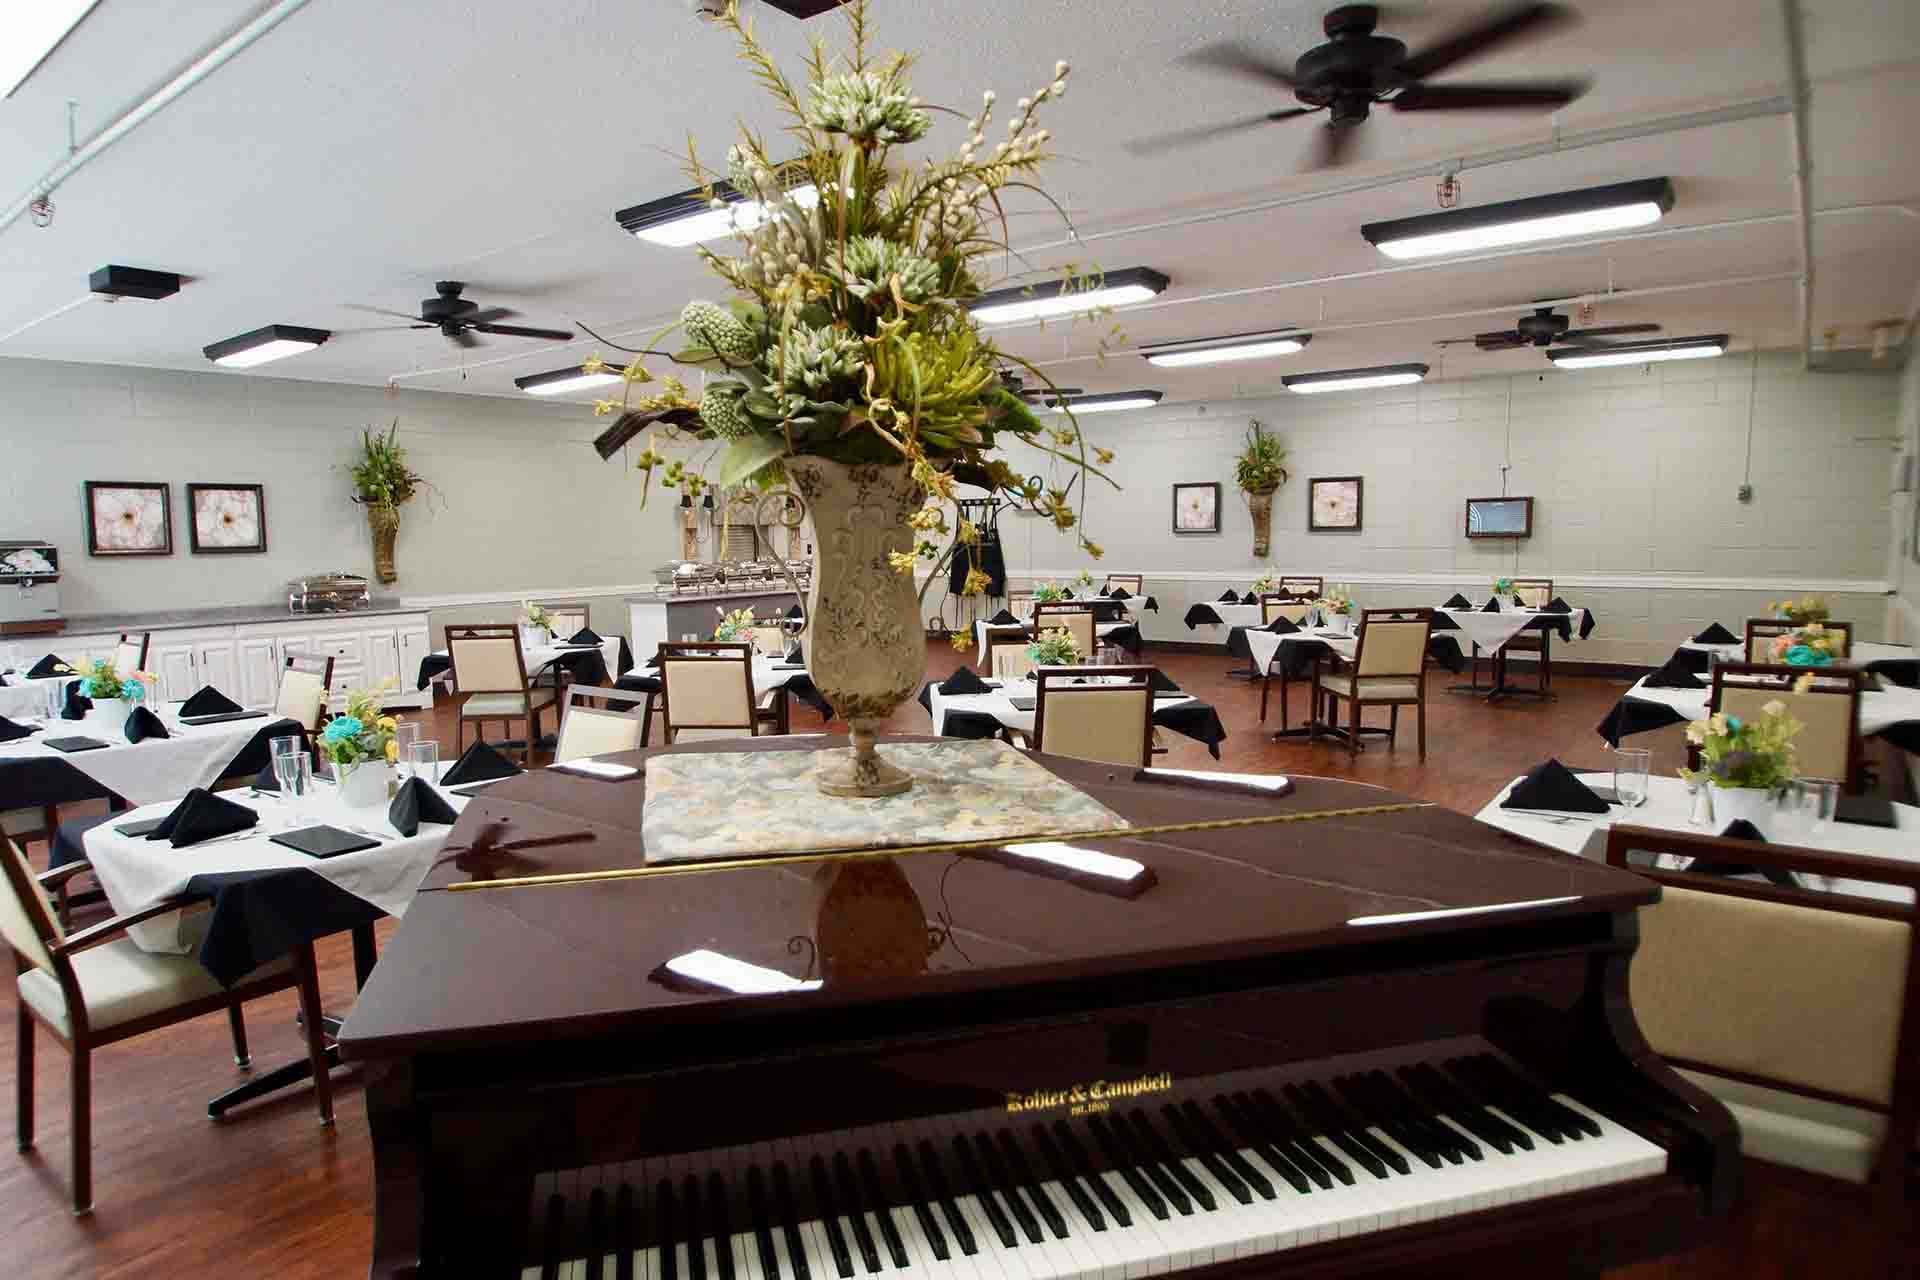
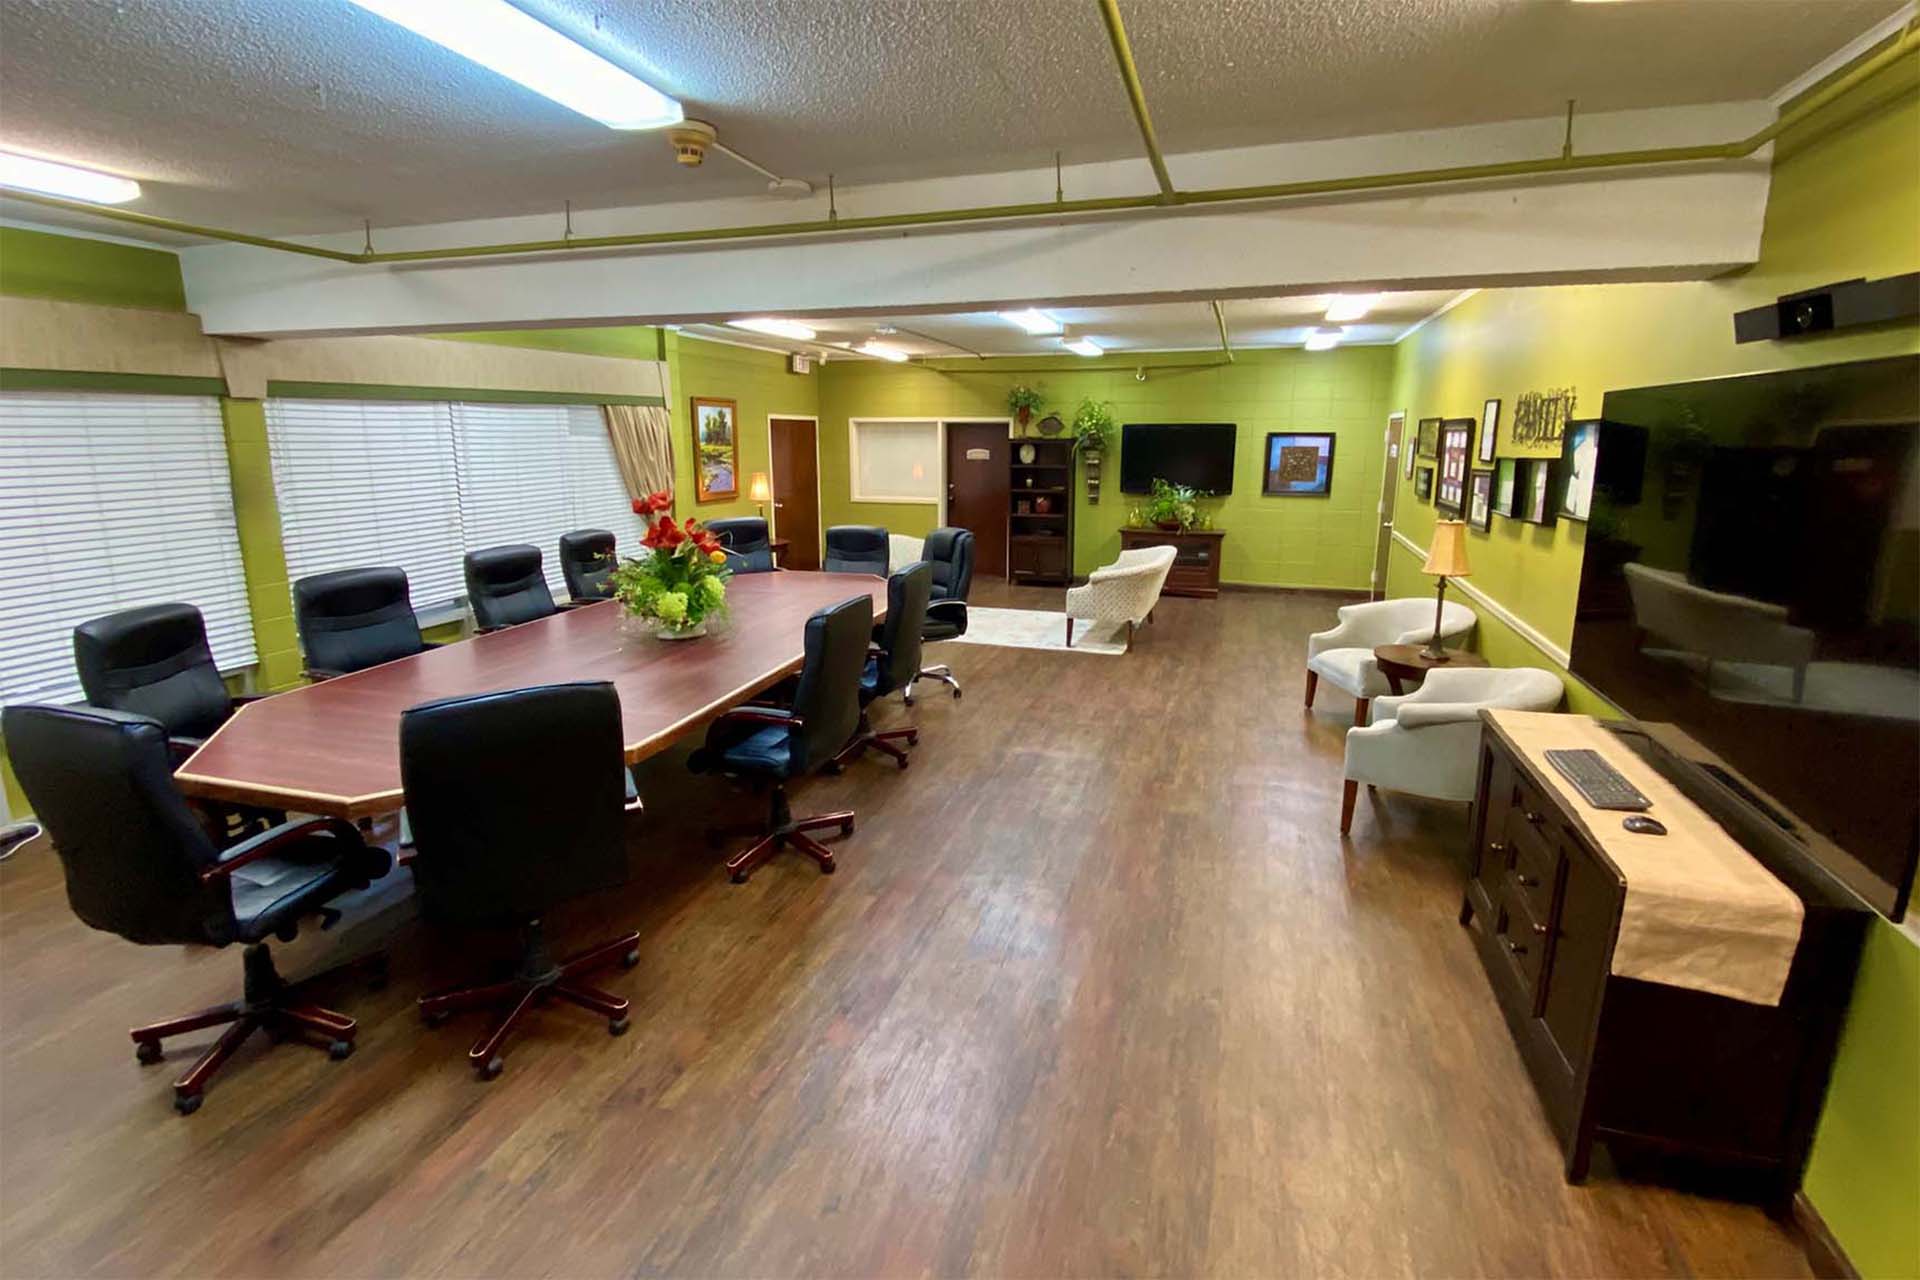
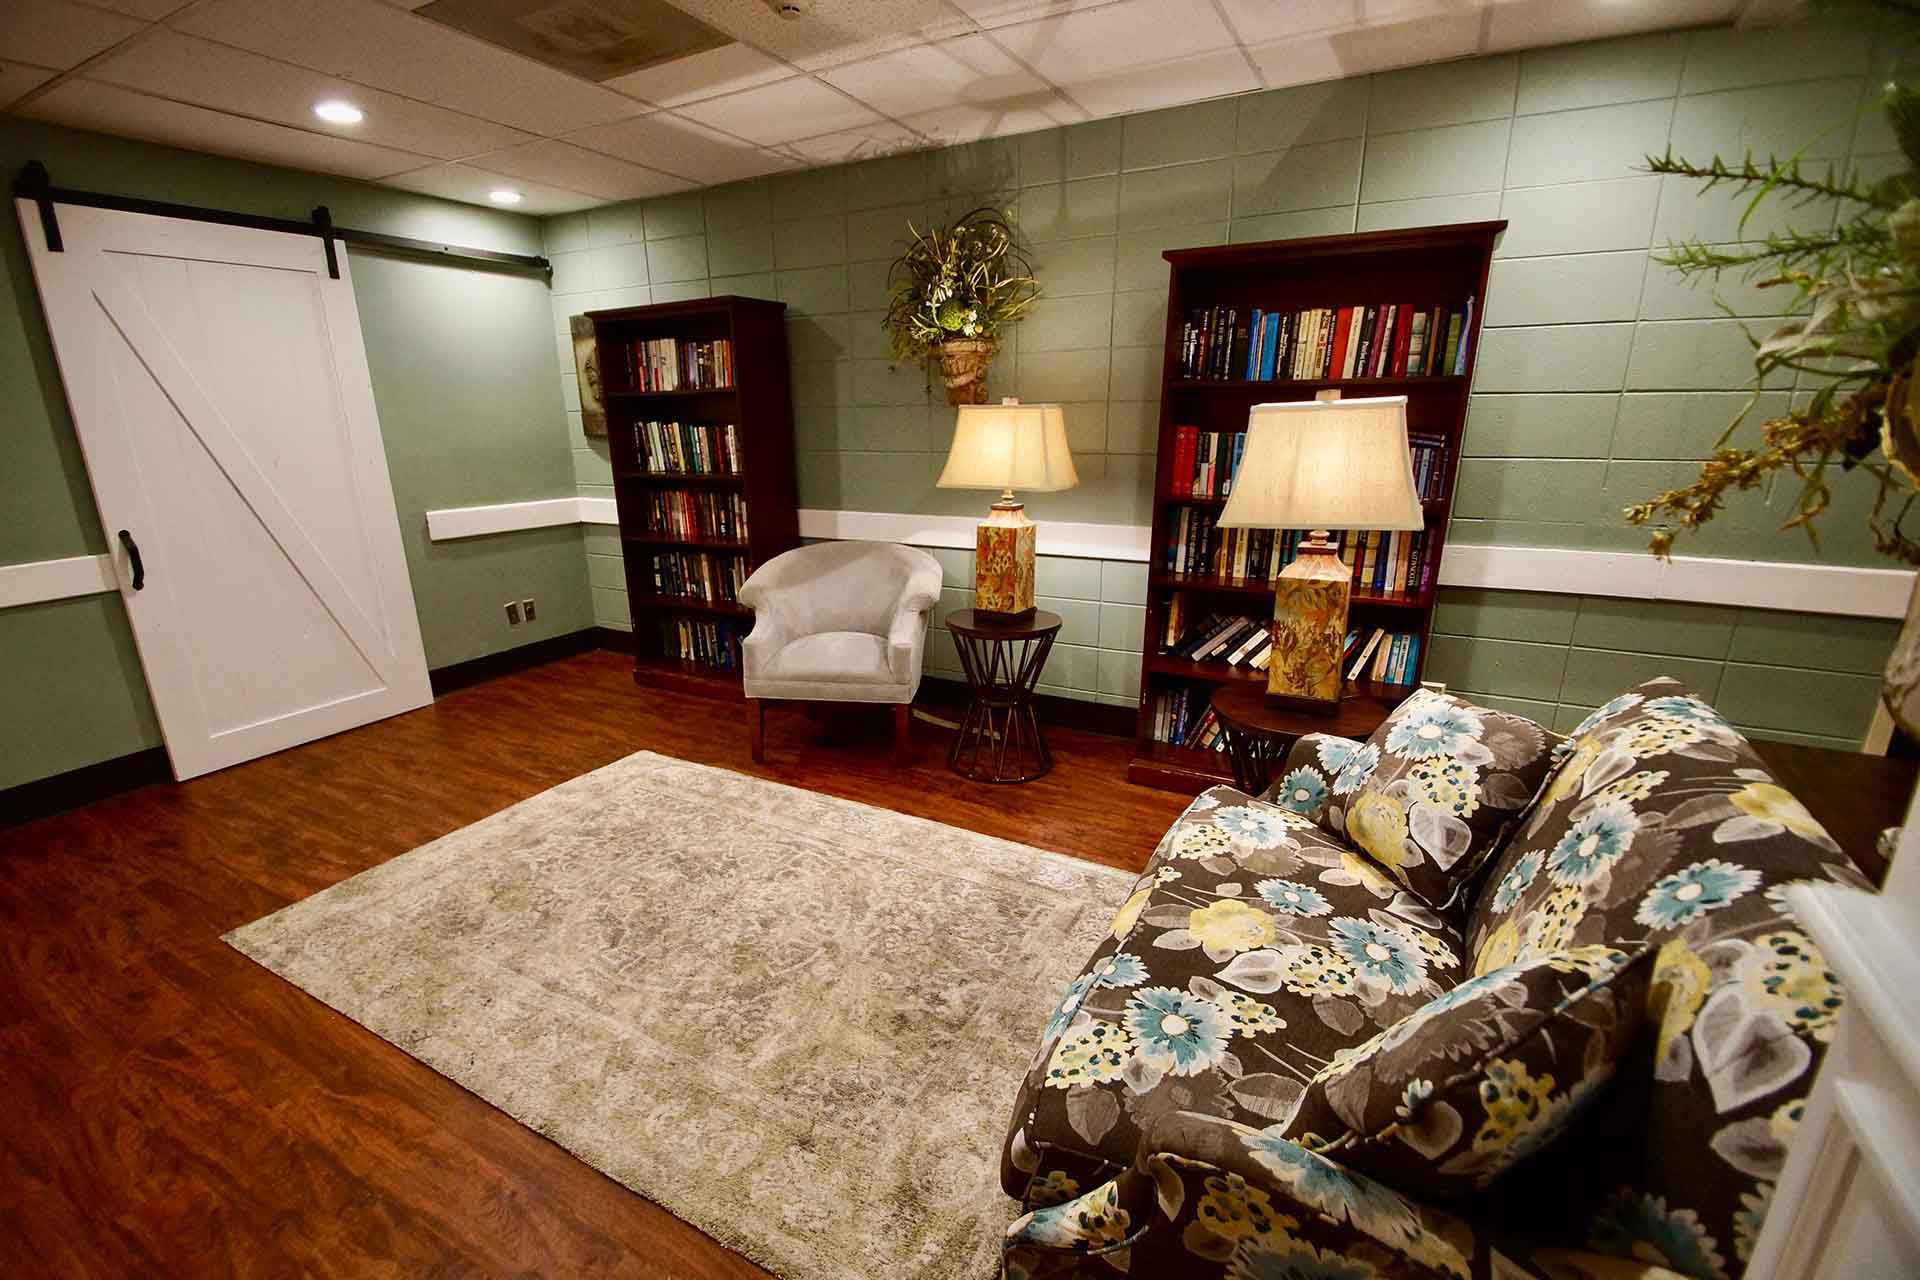
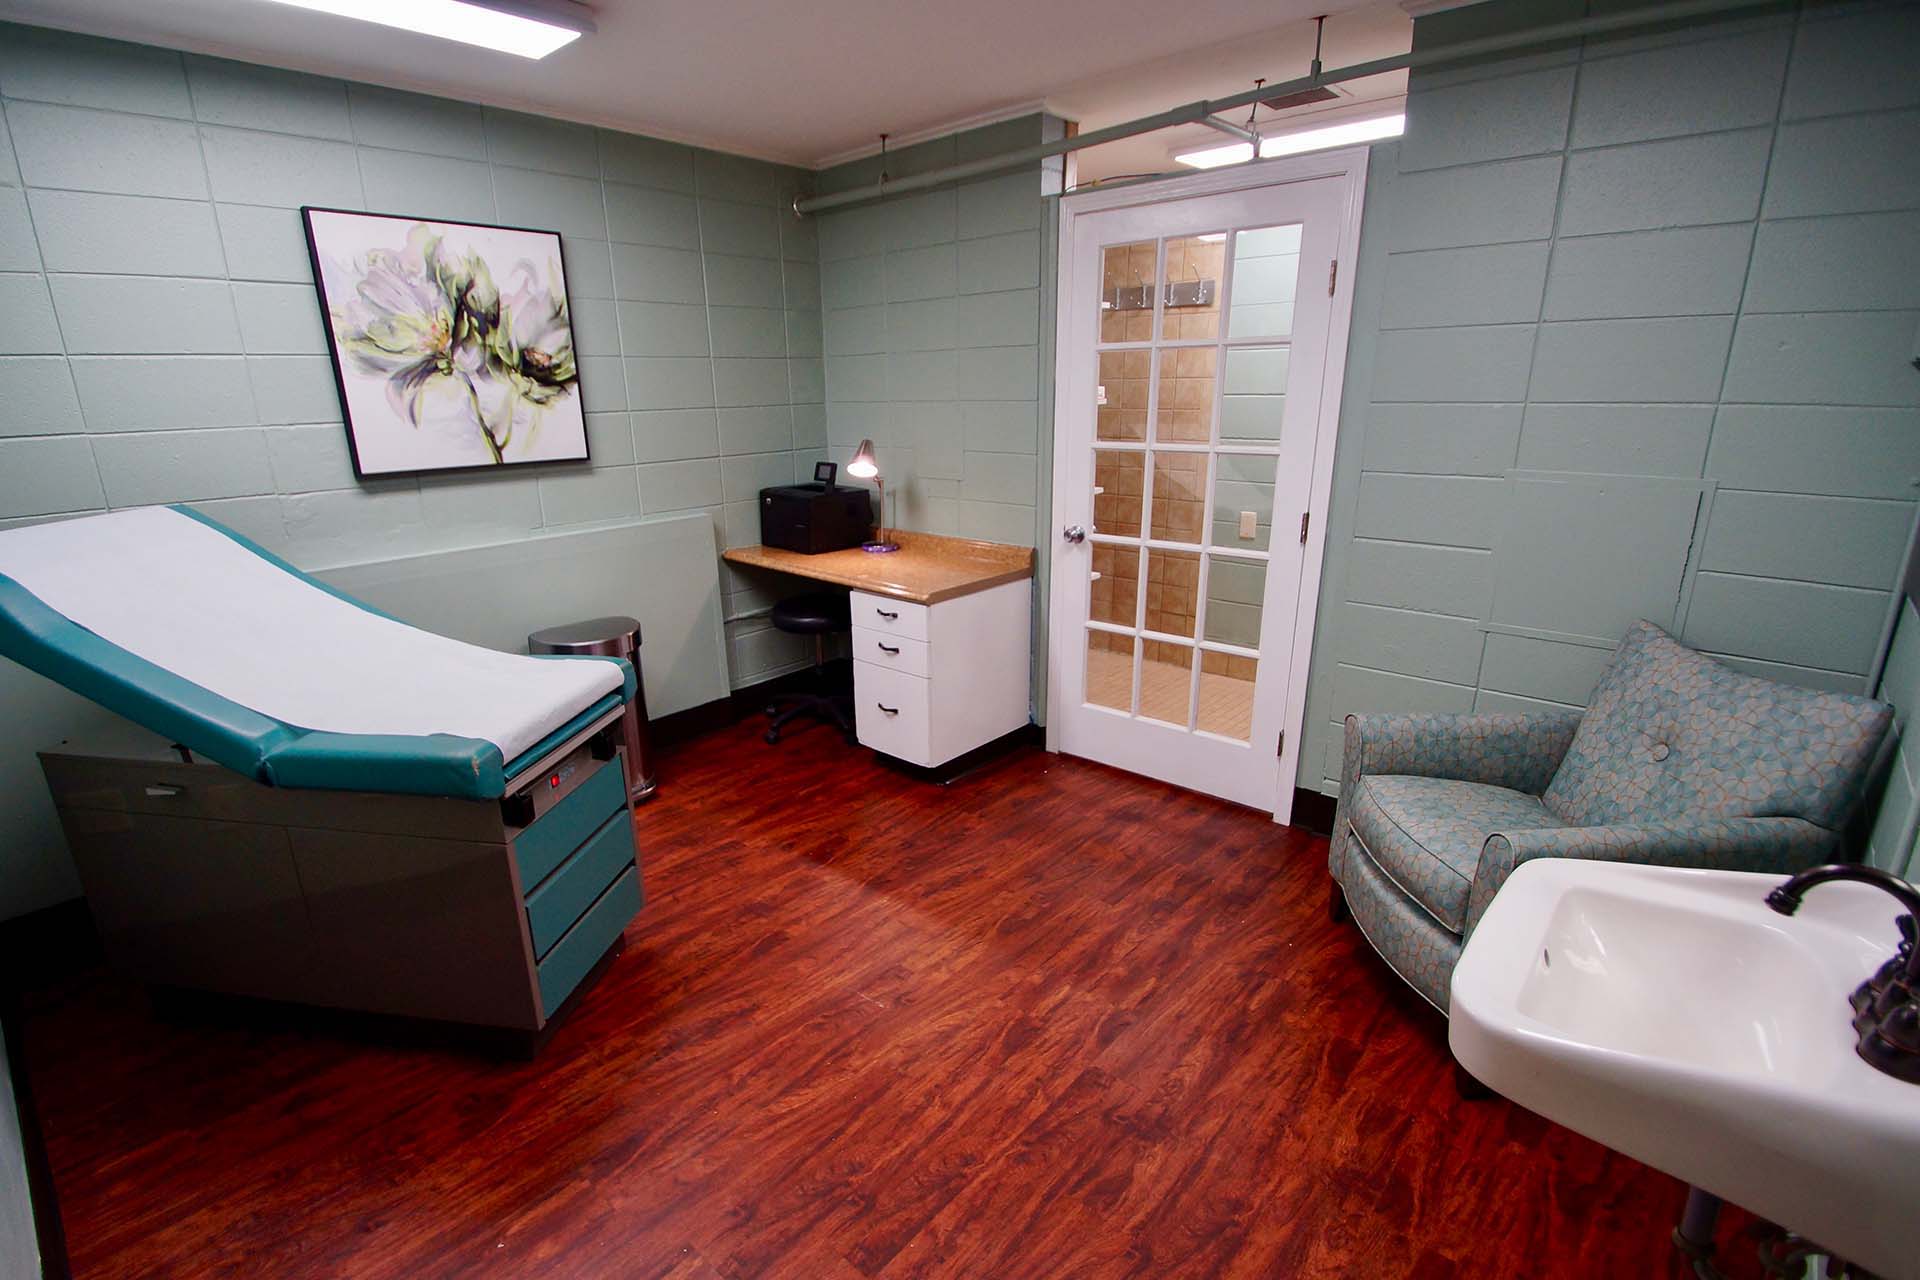
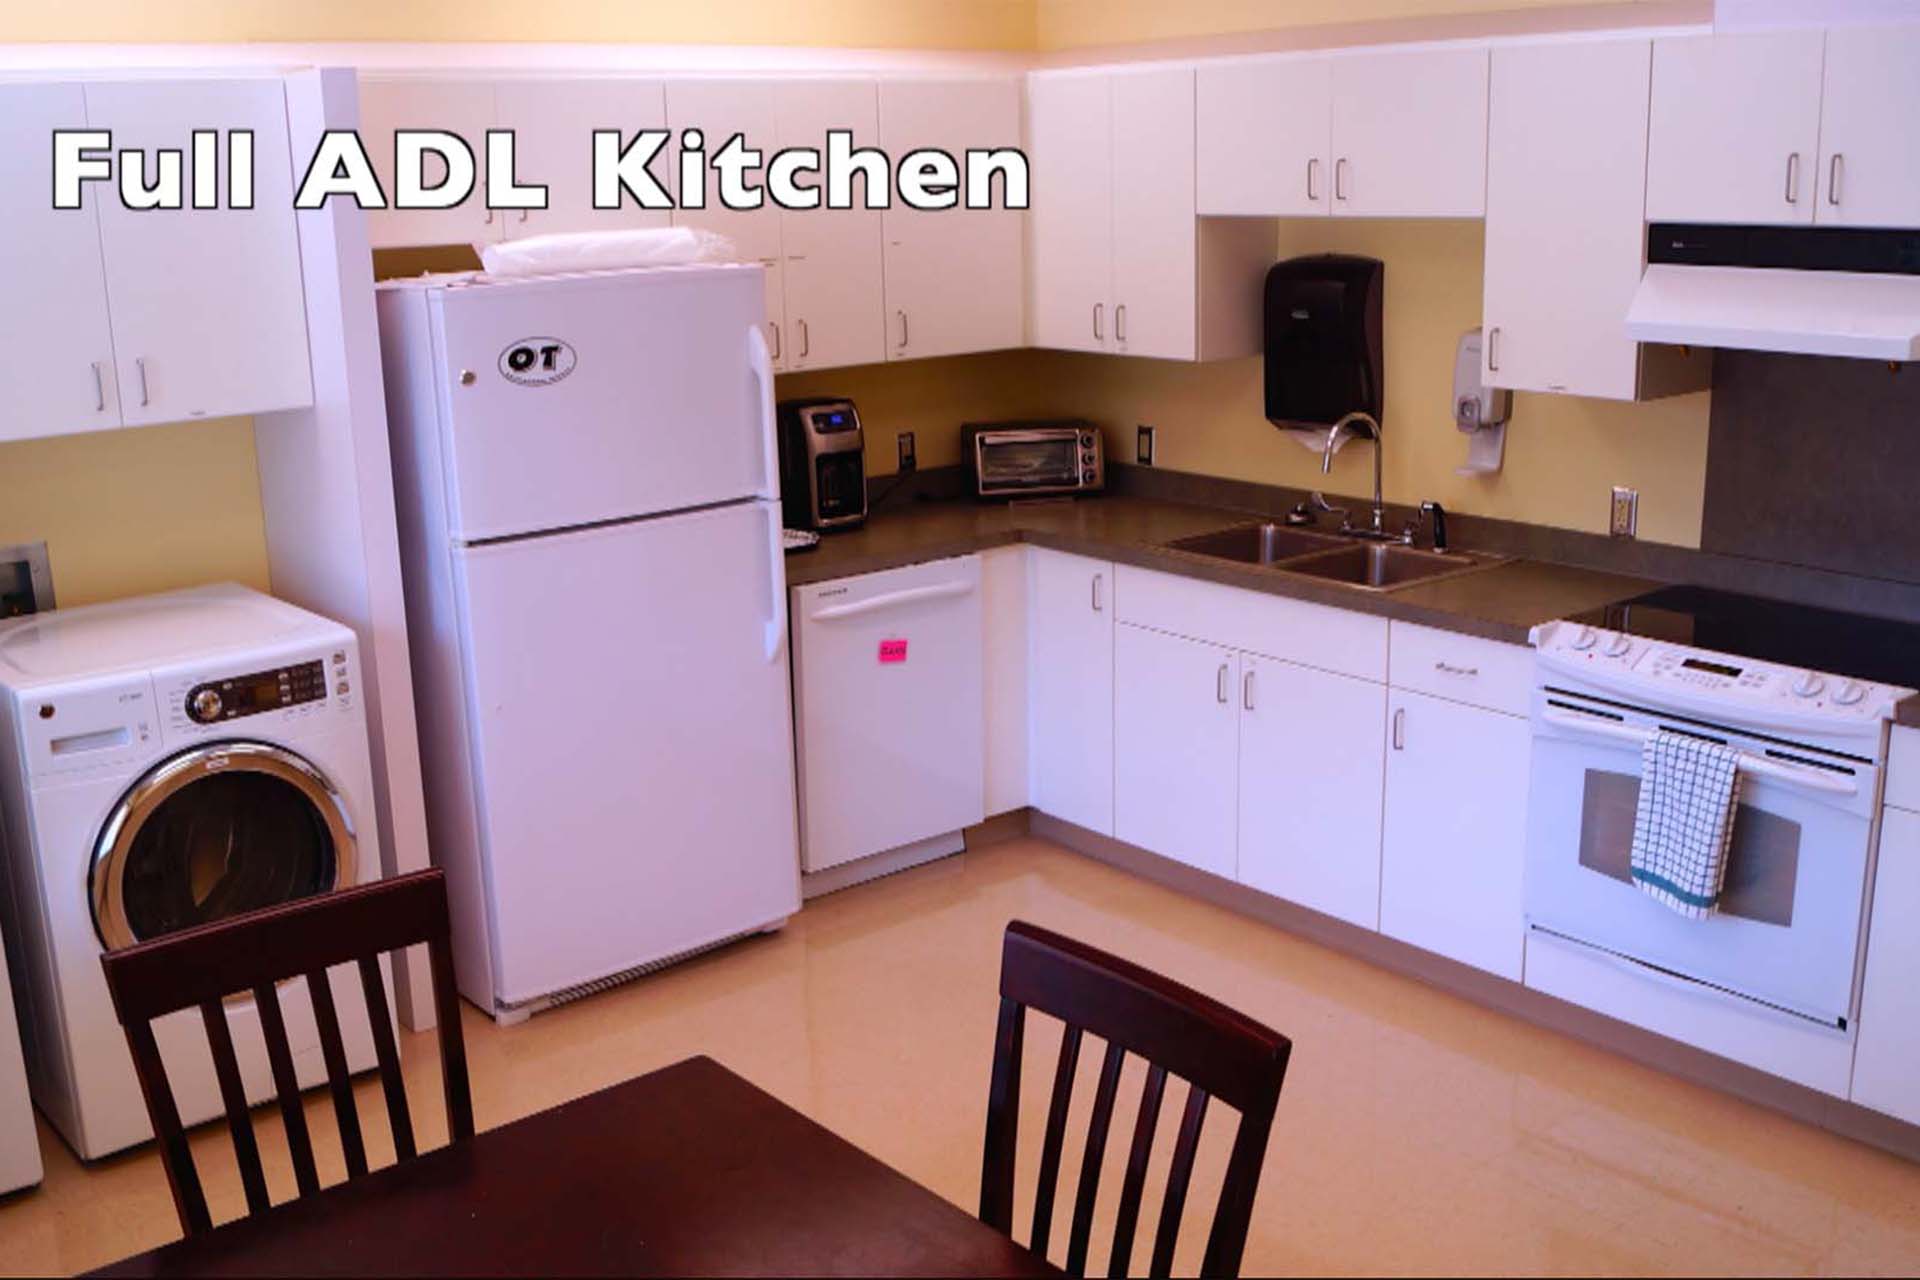
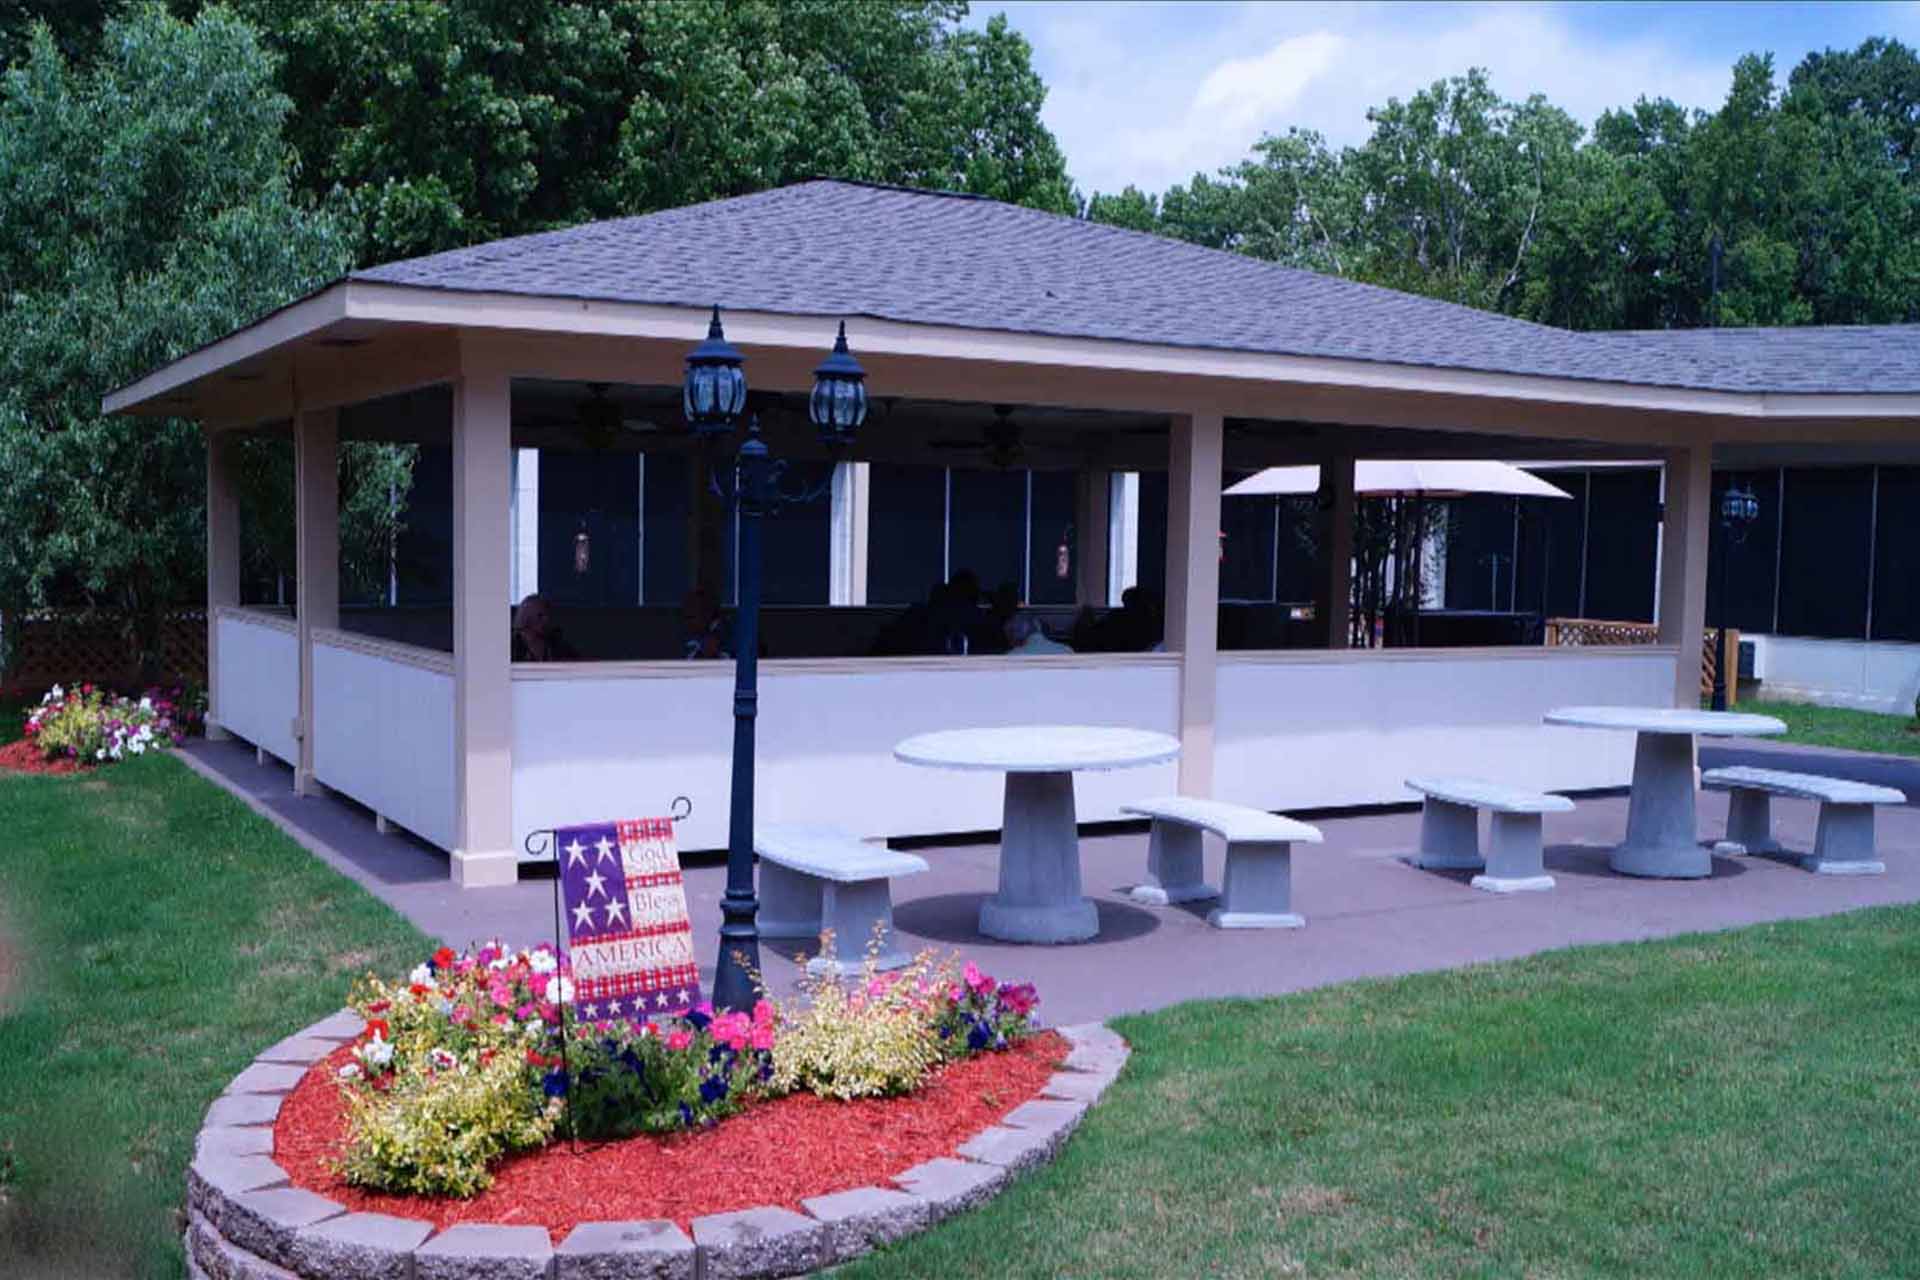
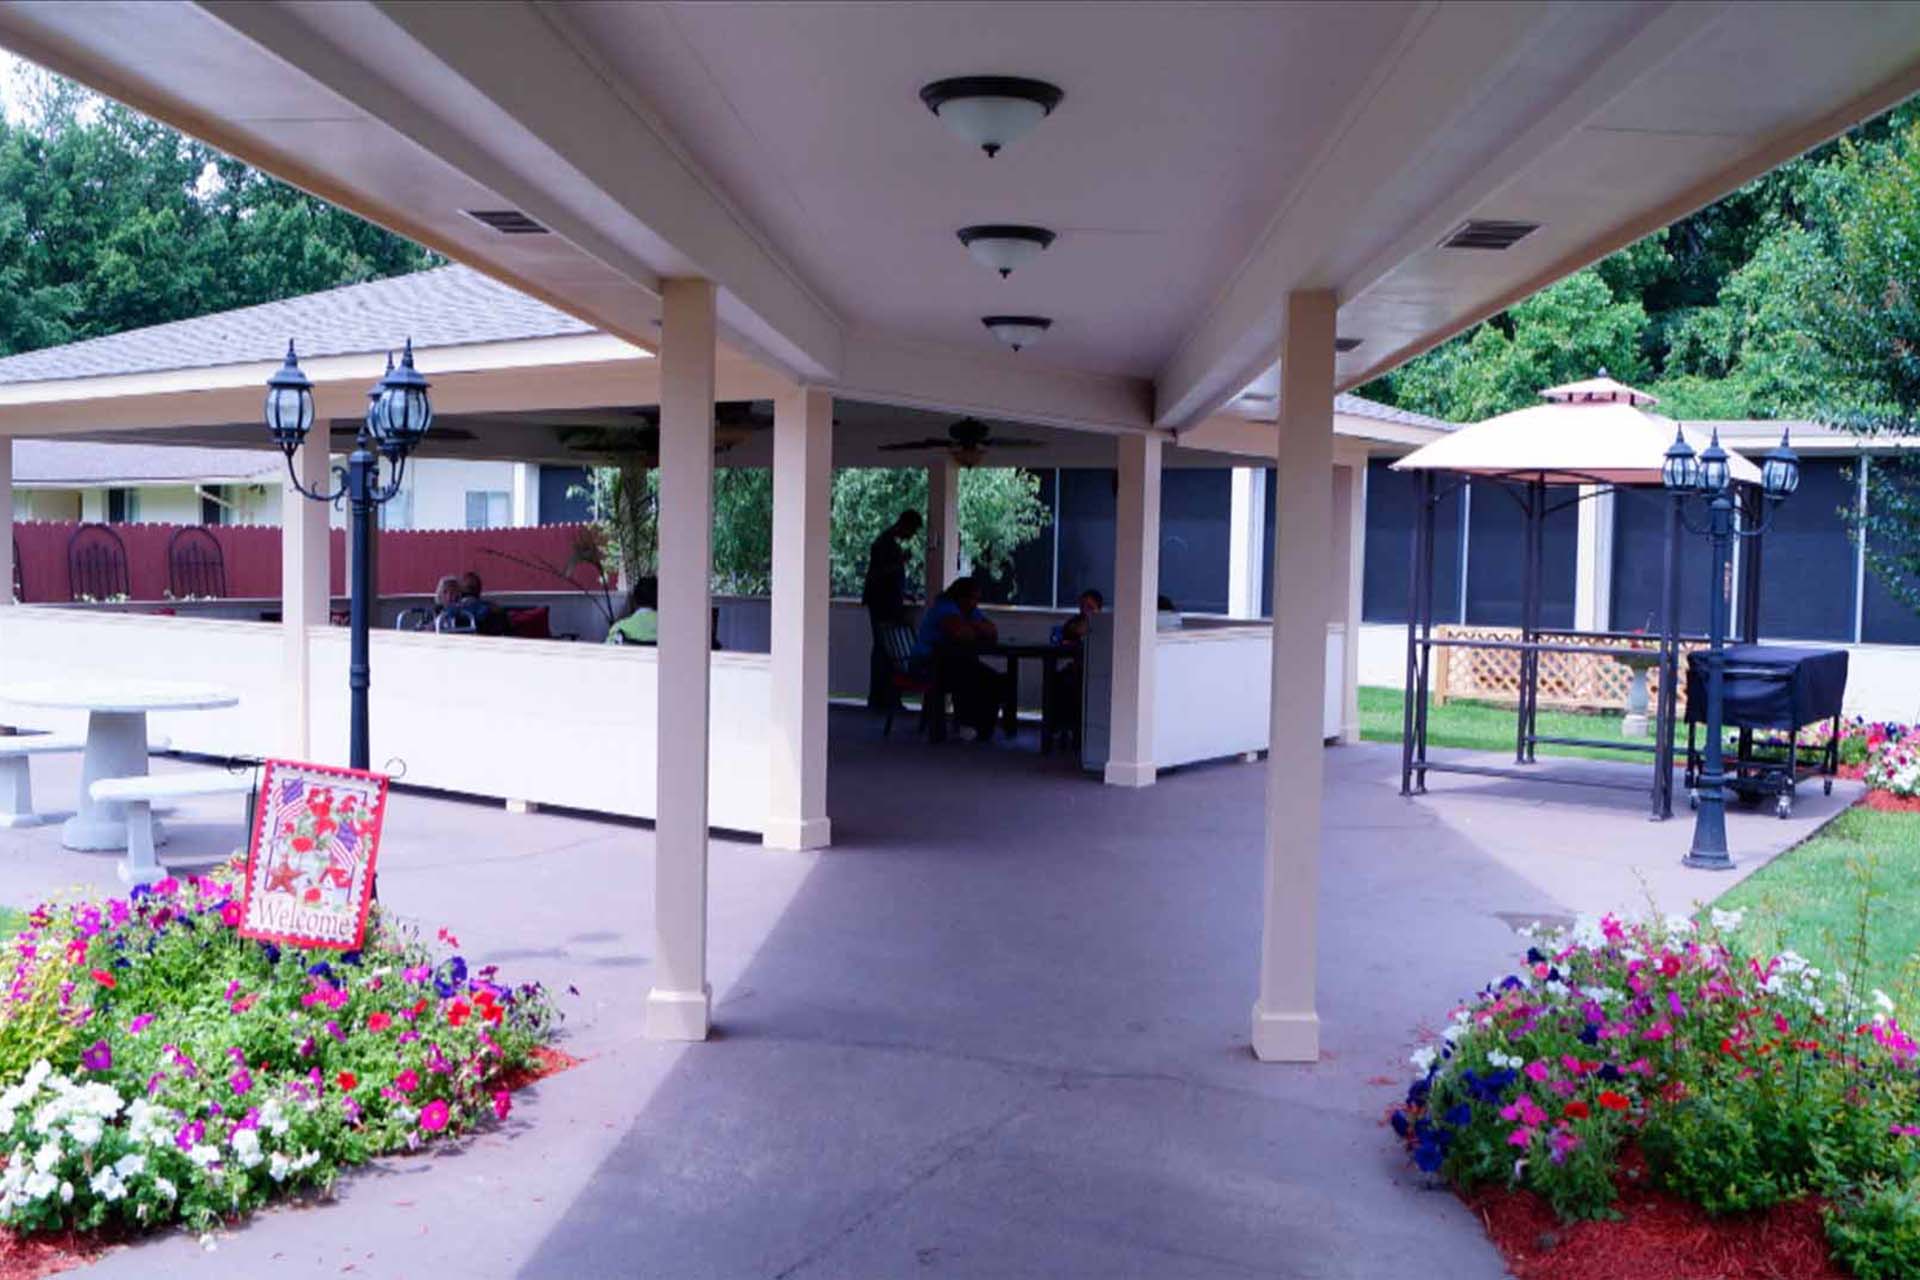
Yes — there are 10 photos of Brandon Community Carew Center in the photo gallery on this page.

What is the address of Brandon Community Carew Center?

Brandon Community Carew Center is located at 355 Crossgate Boulevard.

What is the phone number of Brandon Community Carew Center?

(601) 825-3192 will put you in contact with the team at Brandon Community Carew Center.

What county is Brandon Community Carew Center located in?

Brandon Community Carew Center is in Rankin County.

Explore Open Rooms
1 Contact details
2 What type of senior care service are you looking for?
3 What budget do you have in mind for senior care?
4 How soon do you need to find care?
5 Additional details

Thank you for your interest!

Our team will be in touch shortly to help with next steps.