Explore Open Rooms

1 Contact details
2 What type of senior care service are you looking for?
3 What budget do you have in mind for senior care?
4 How soon do you need to find care?
5 Additional details

Thank you for your interest!

Our team will be in touch shortly to help with next steps.

Nursing Home

Briarcliff Manor Center For Rehabilitation & Nursing

Nursing Home

Briarcliff Manor Center For Rehabilitation & Nursing

620 Sleepy Hollow Rd, Briarcliff Manor, NY 10510 View map
Overview of Briarcliff Manor Center for Rehabilitation & Nursing

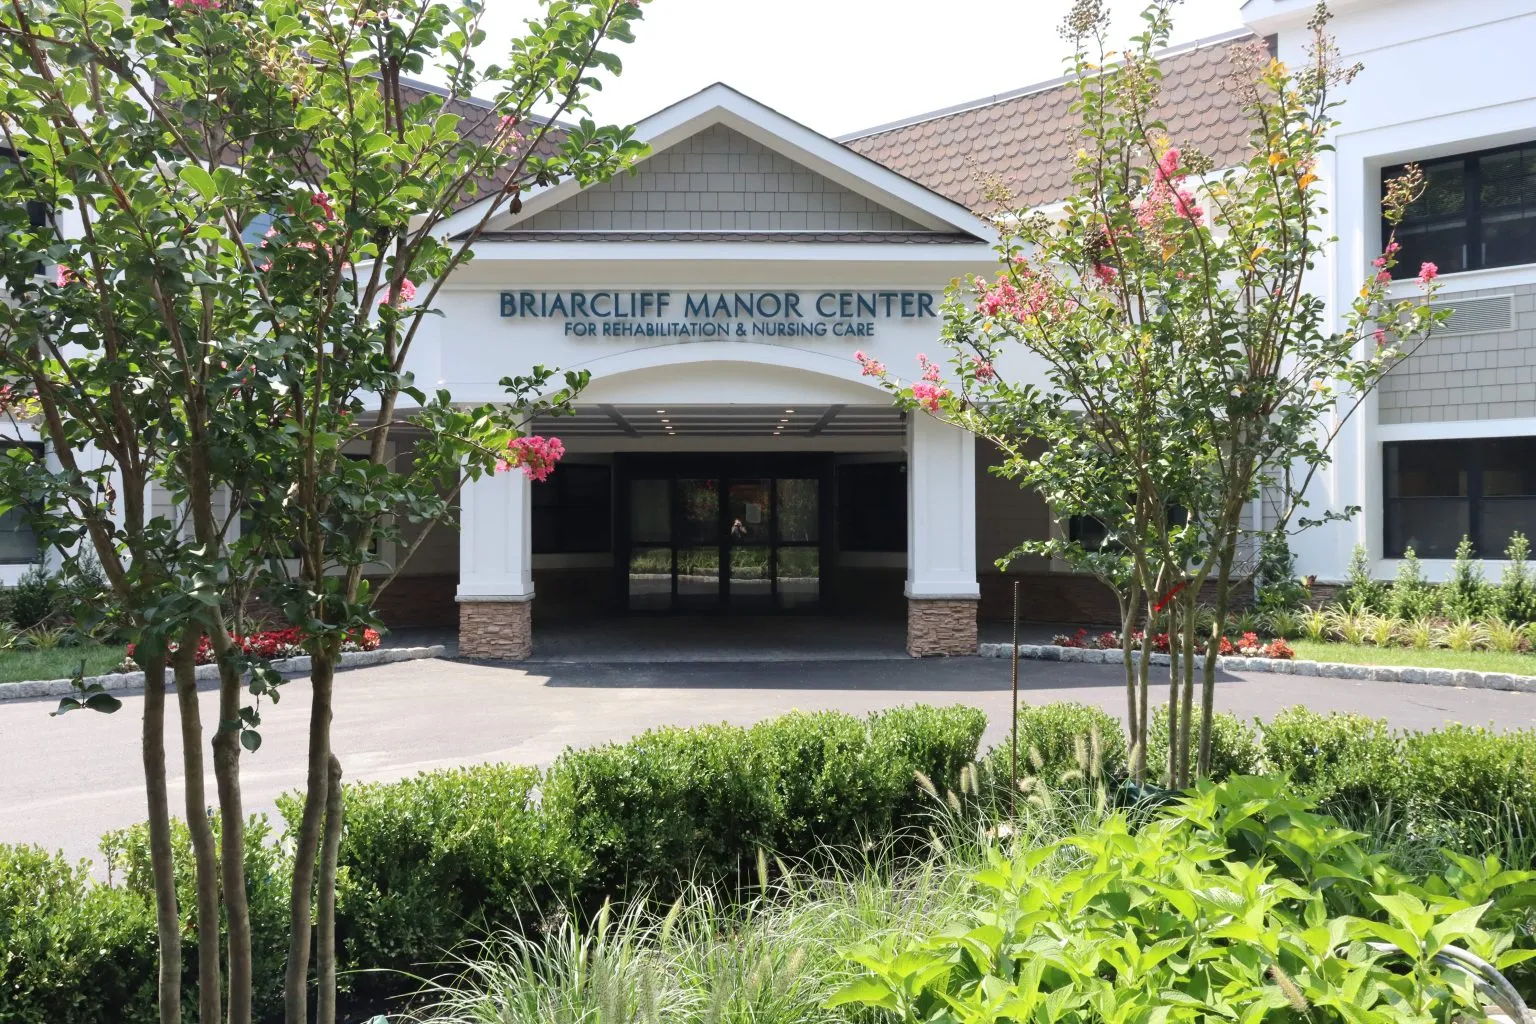
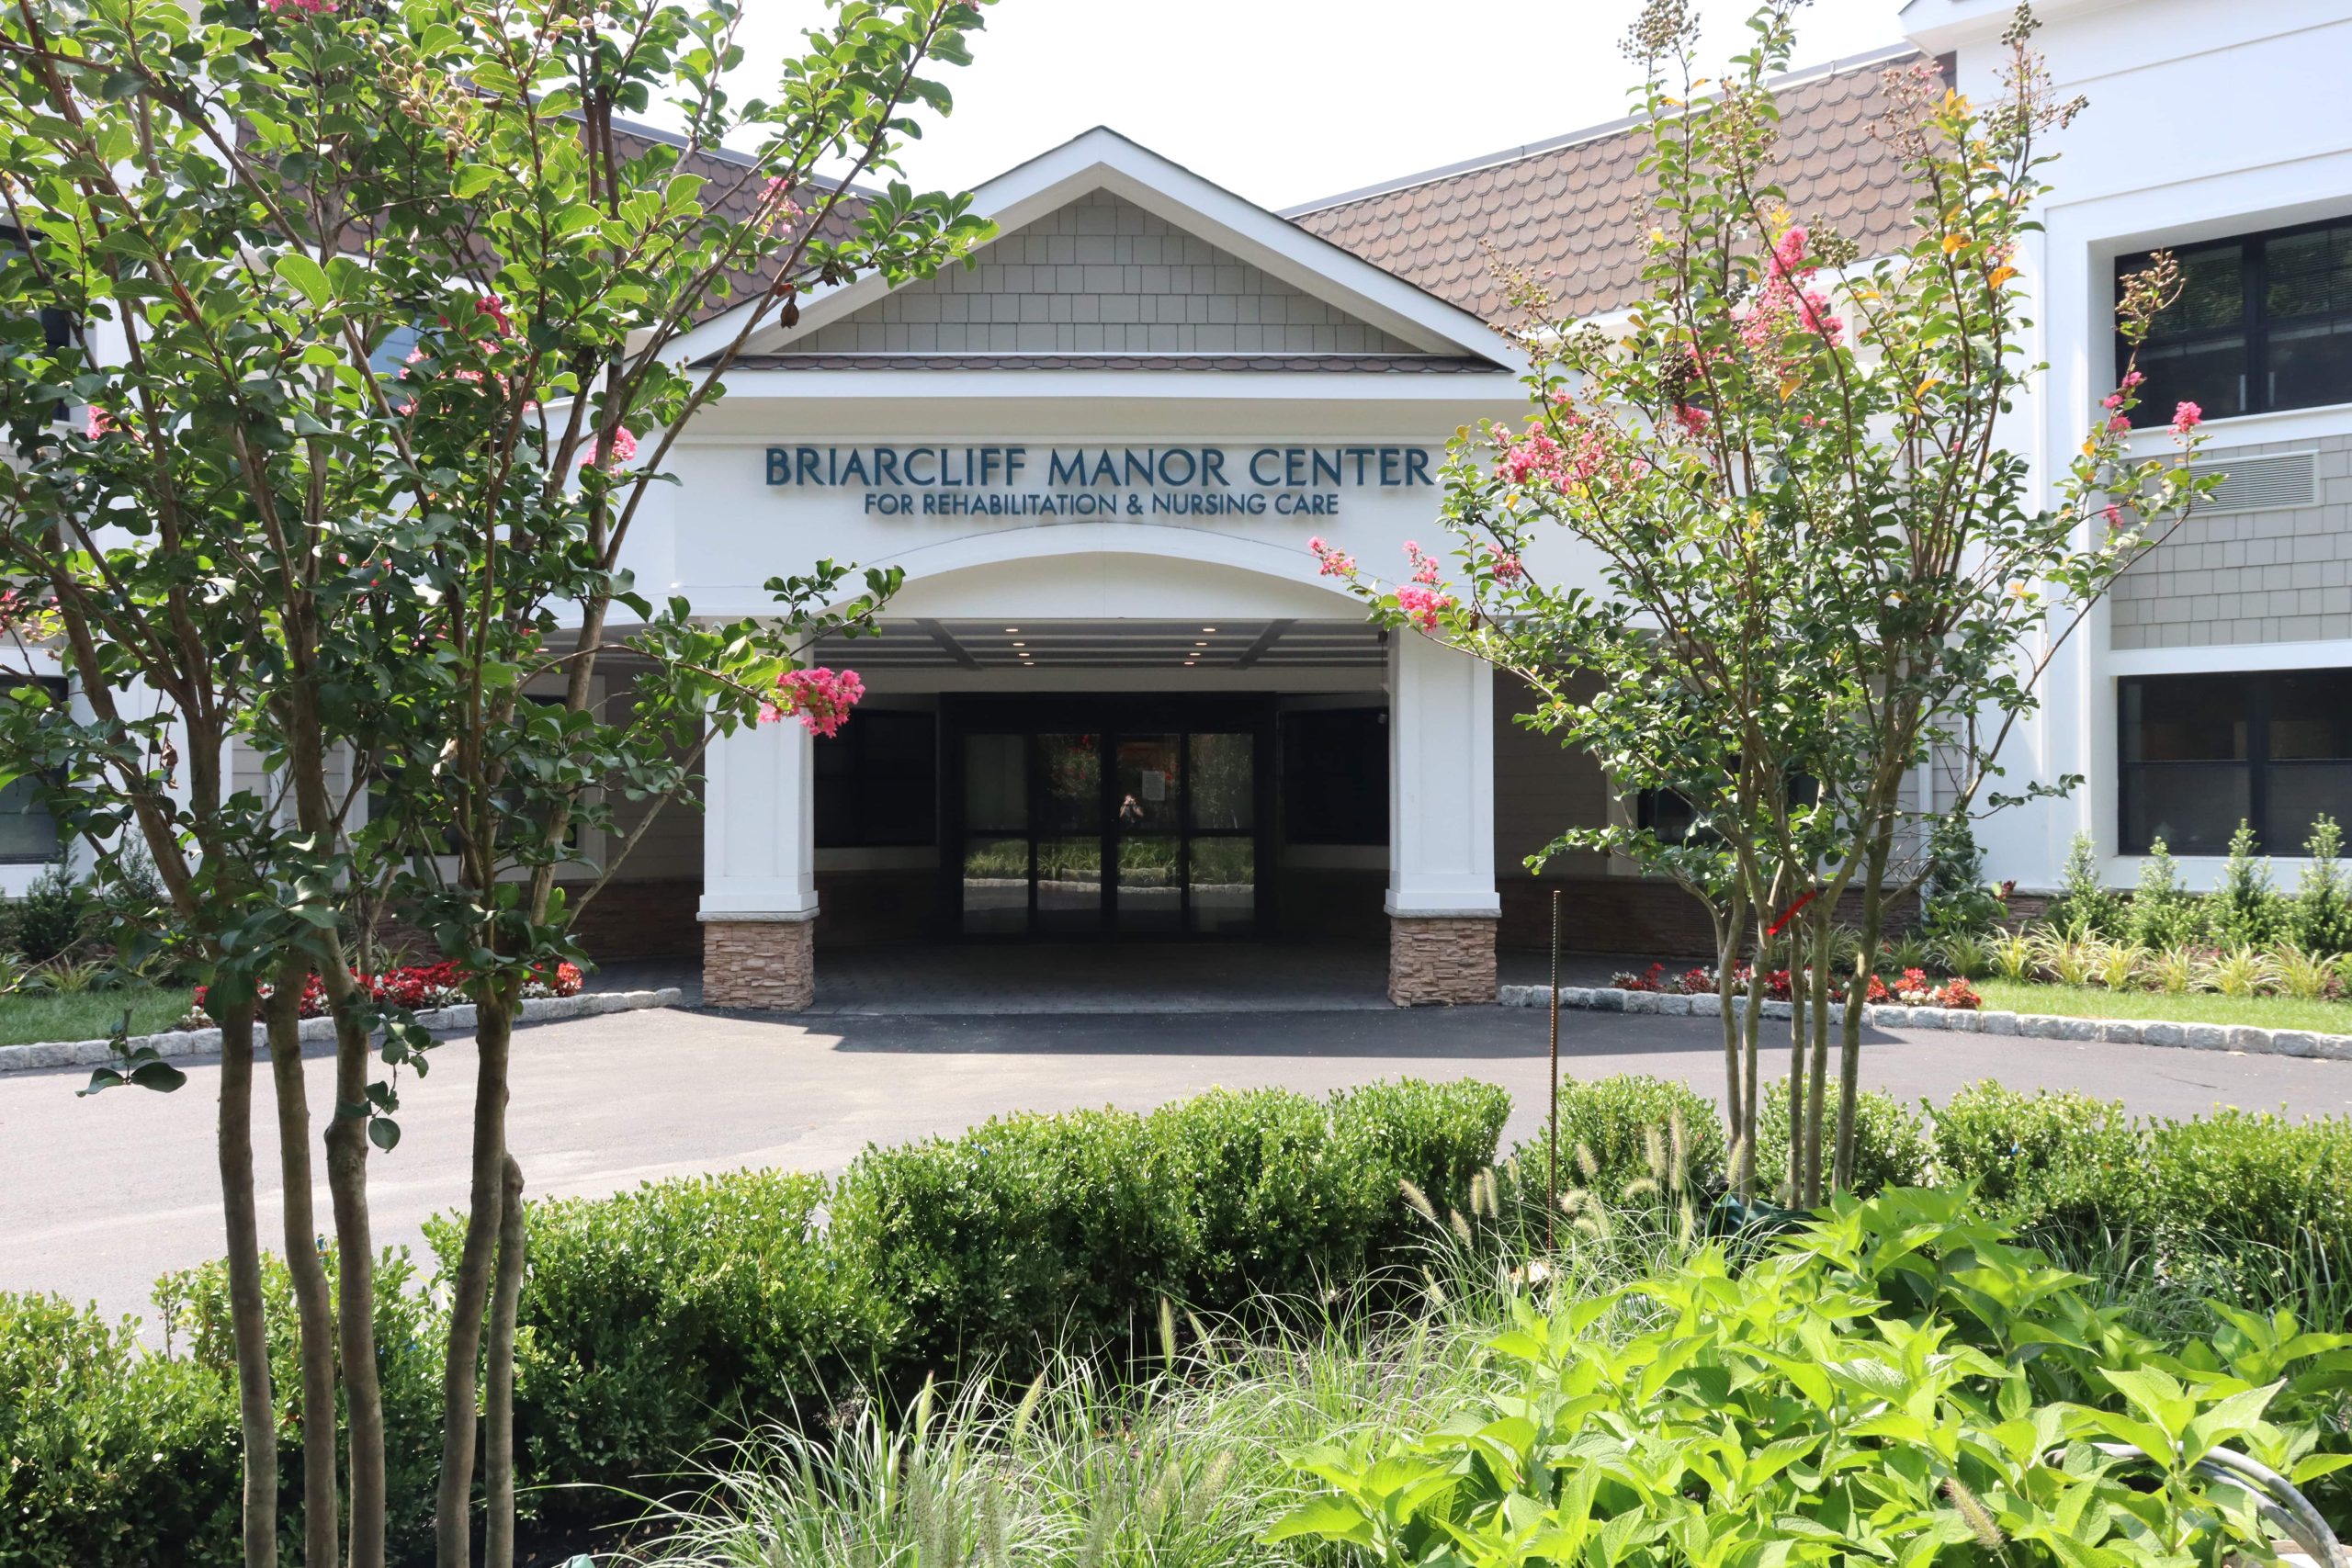
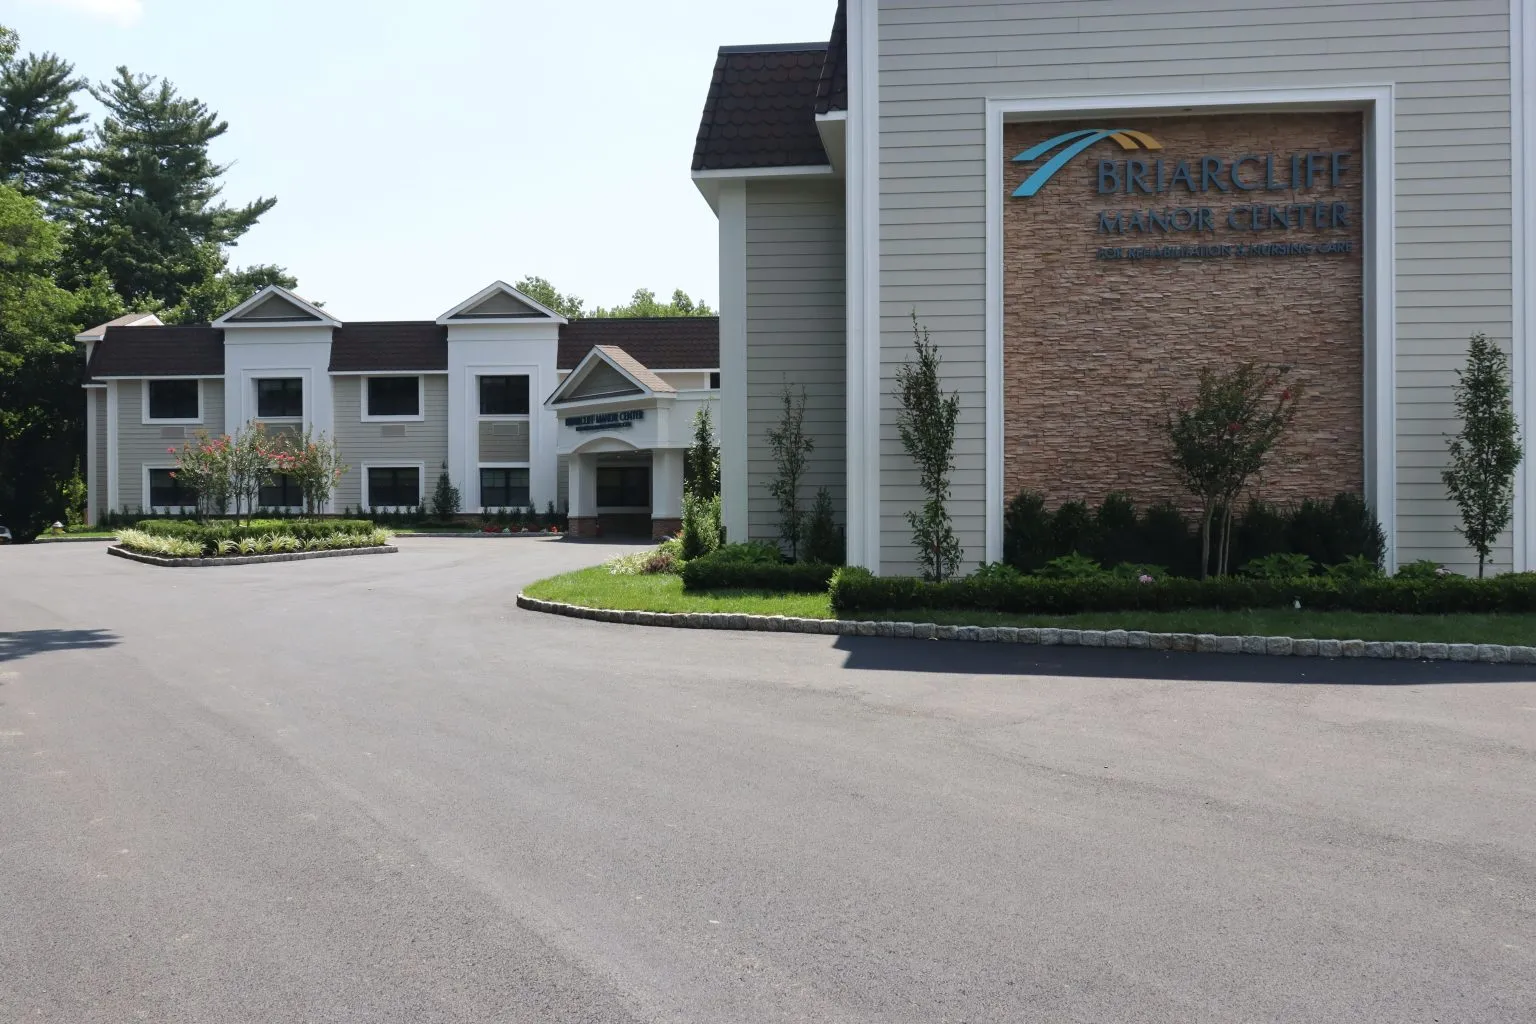
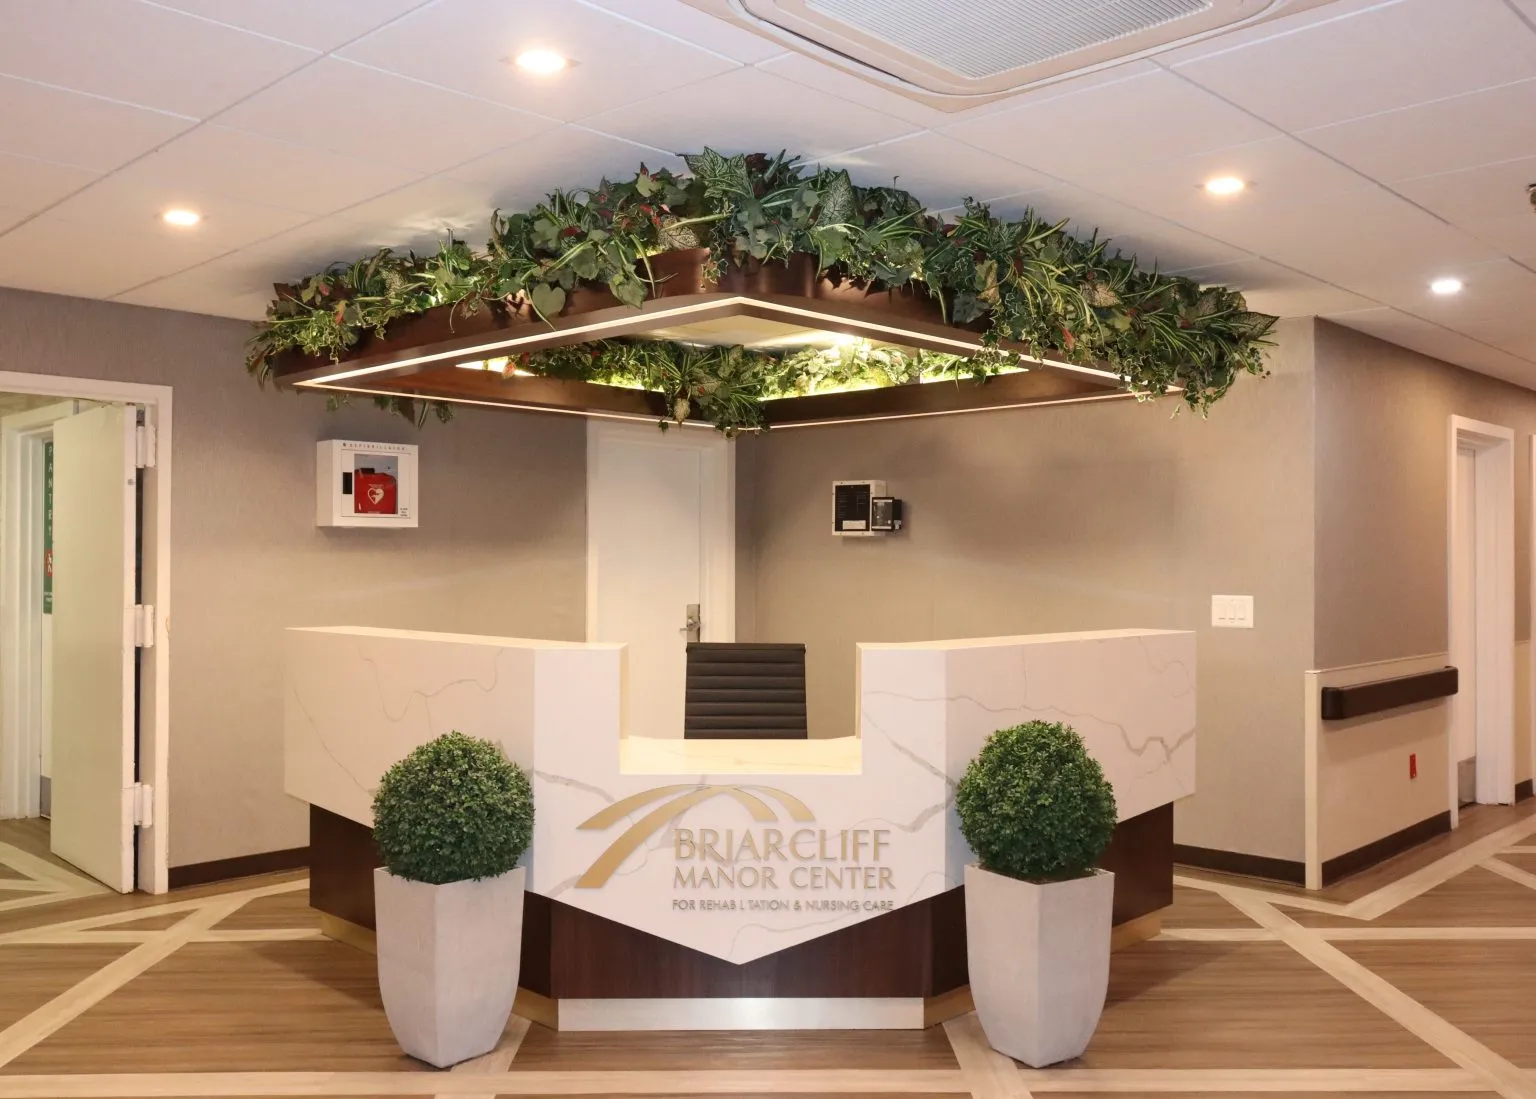
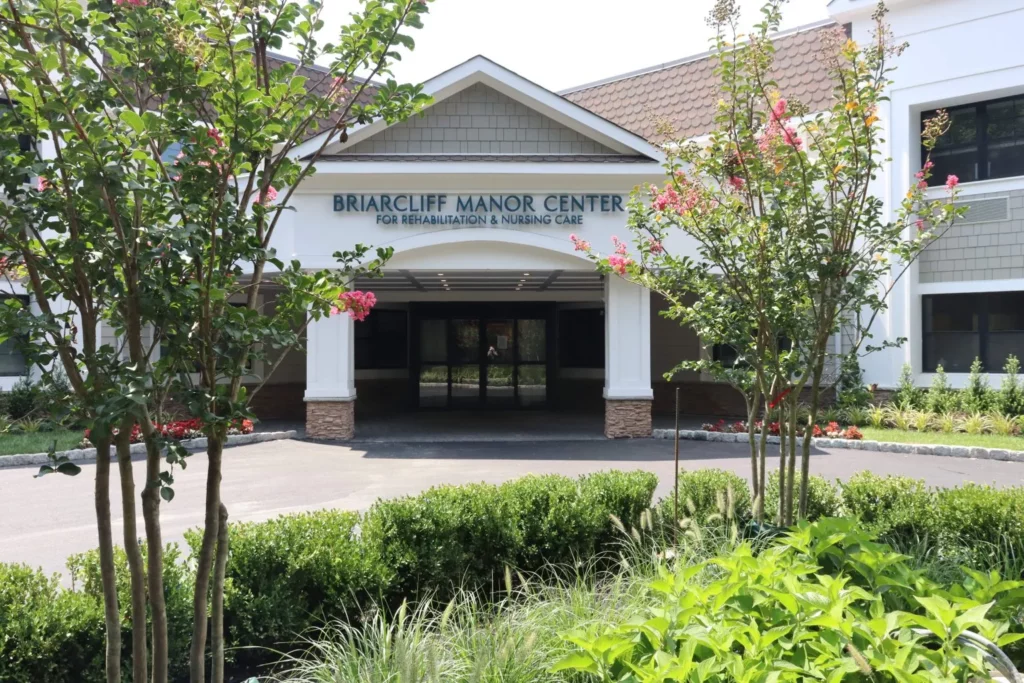
Located in a tranquil setting, Briarcliff Manor Center stands out as a beacon of exceptional care. Their outstanding subacute rehab program and specialized Alzheimer’s care create an unparalleled experience for senior residents. This community prides itself on fostering an environment that boasts the finest clinical accommodations, where the success of the approach is measured by positive experiences.
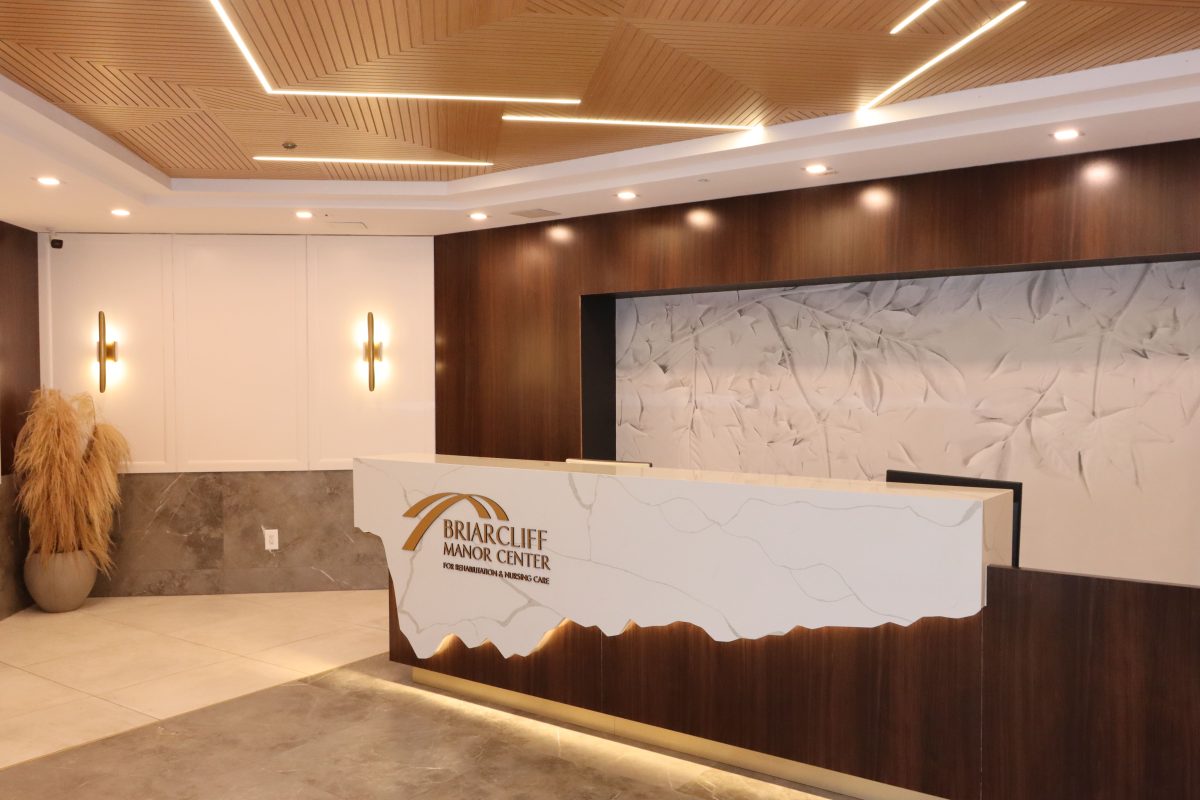
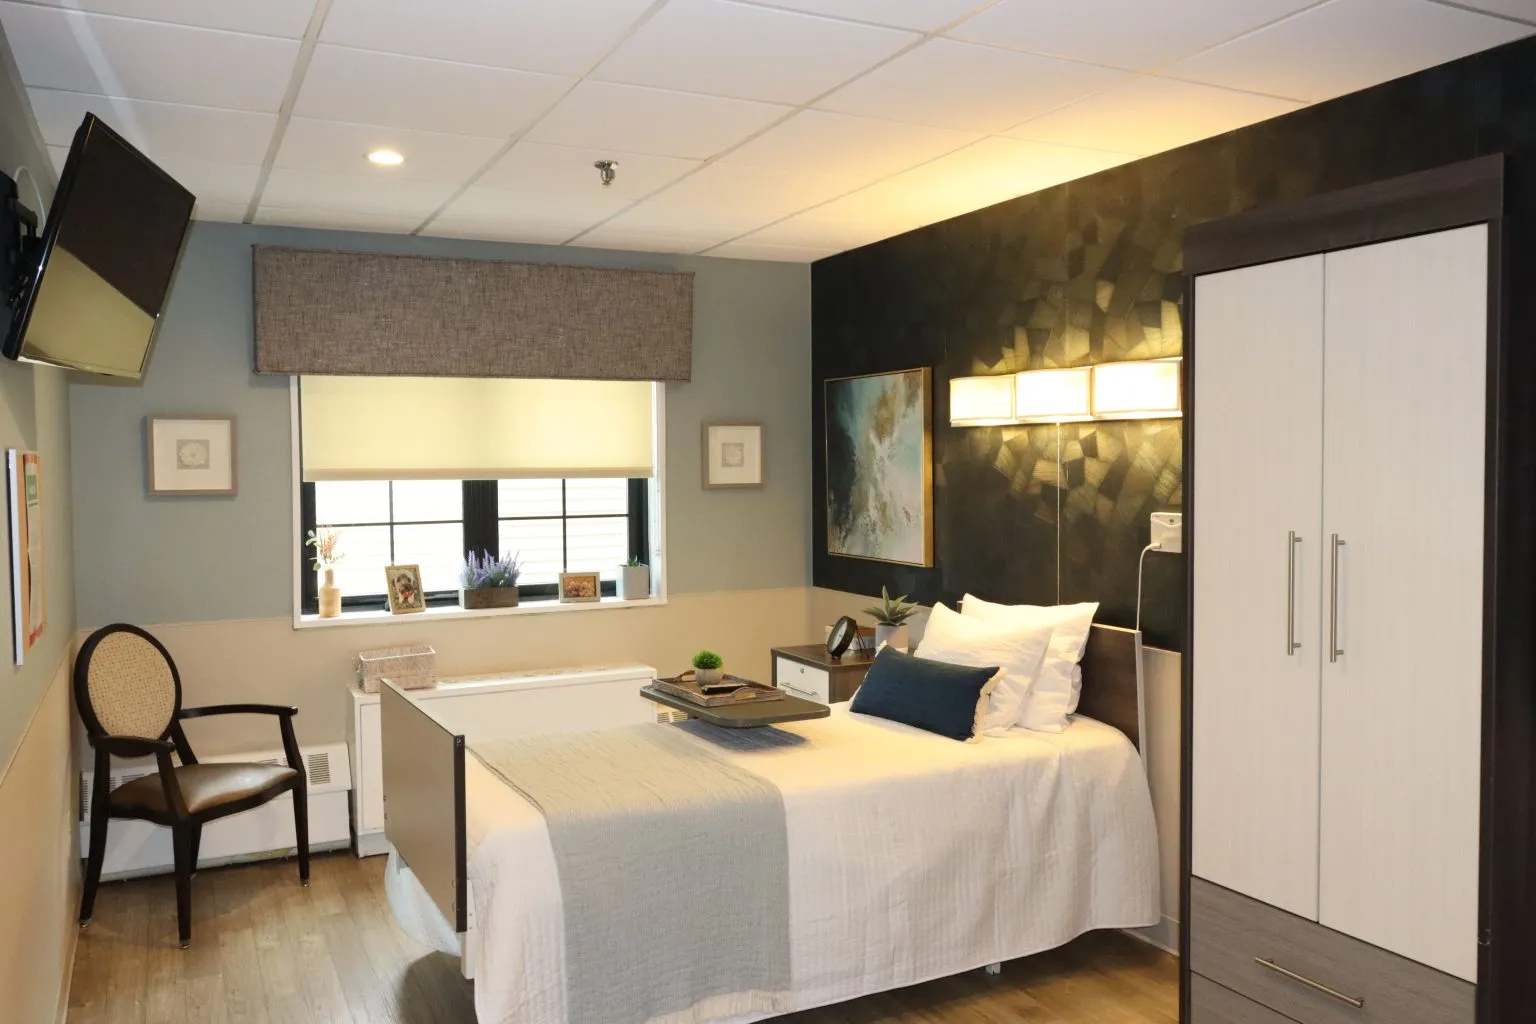
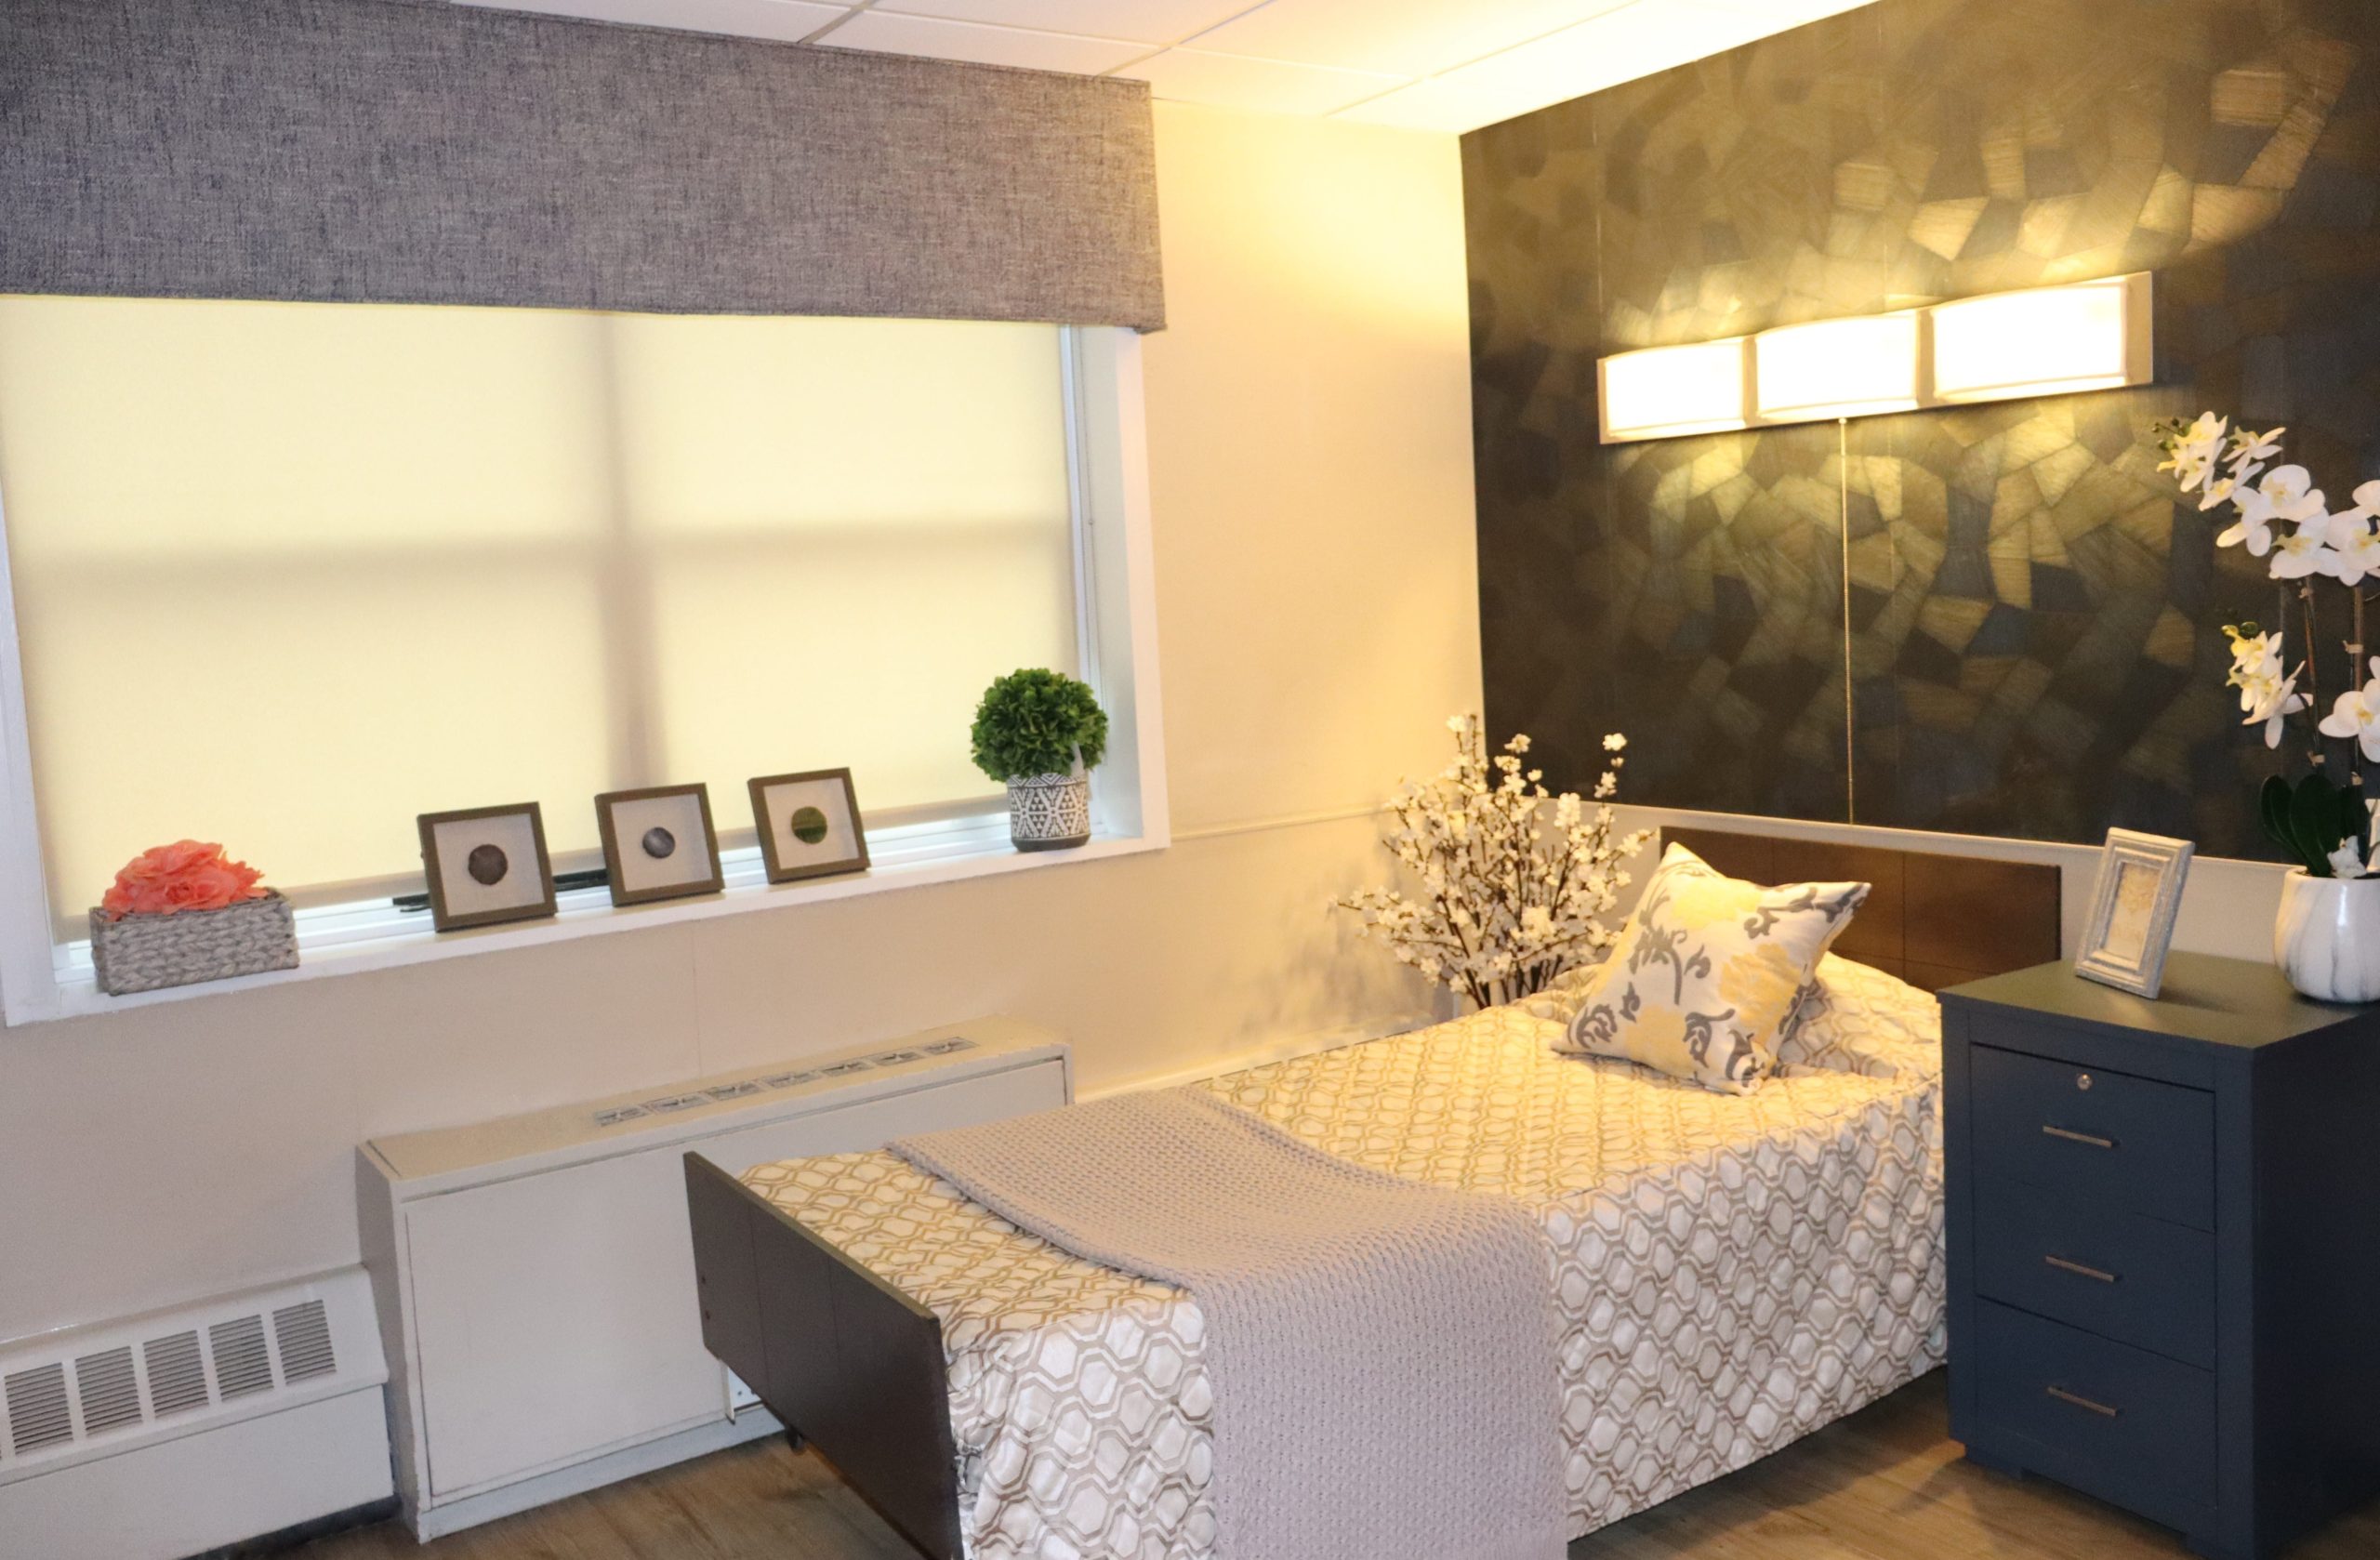
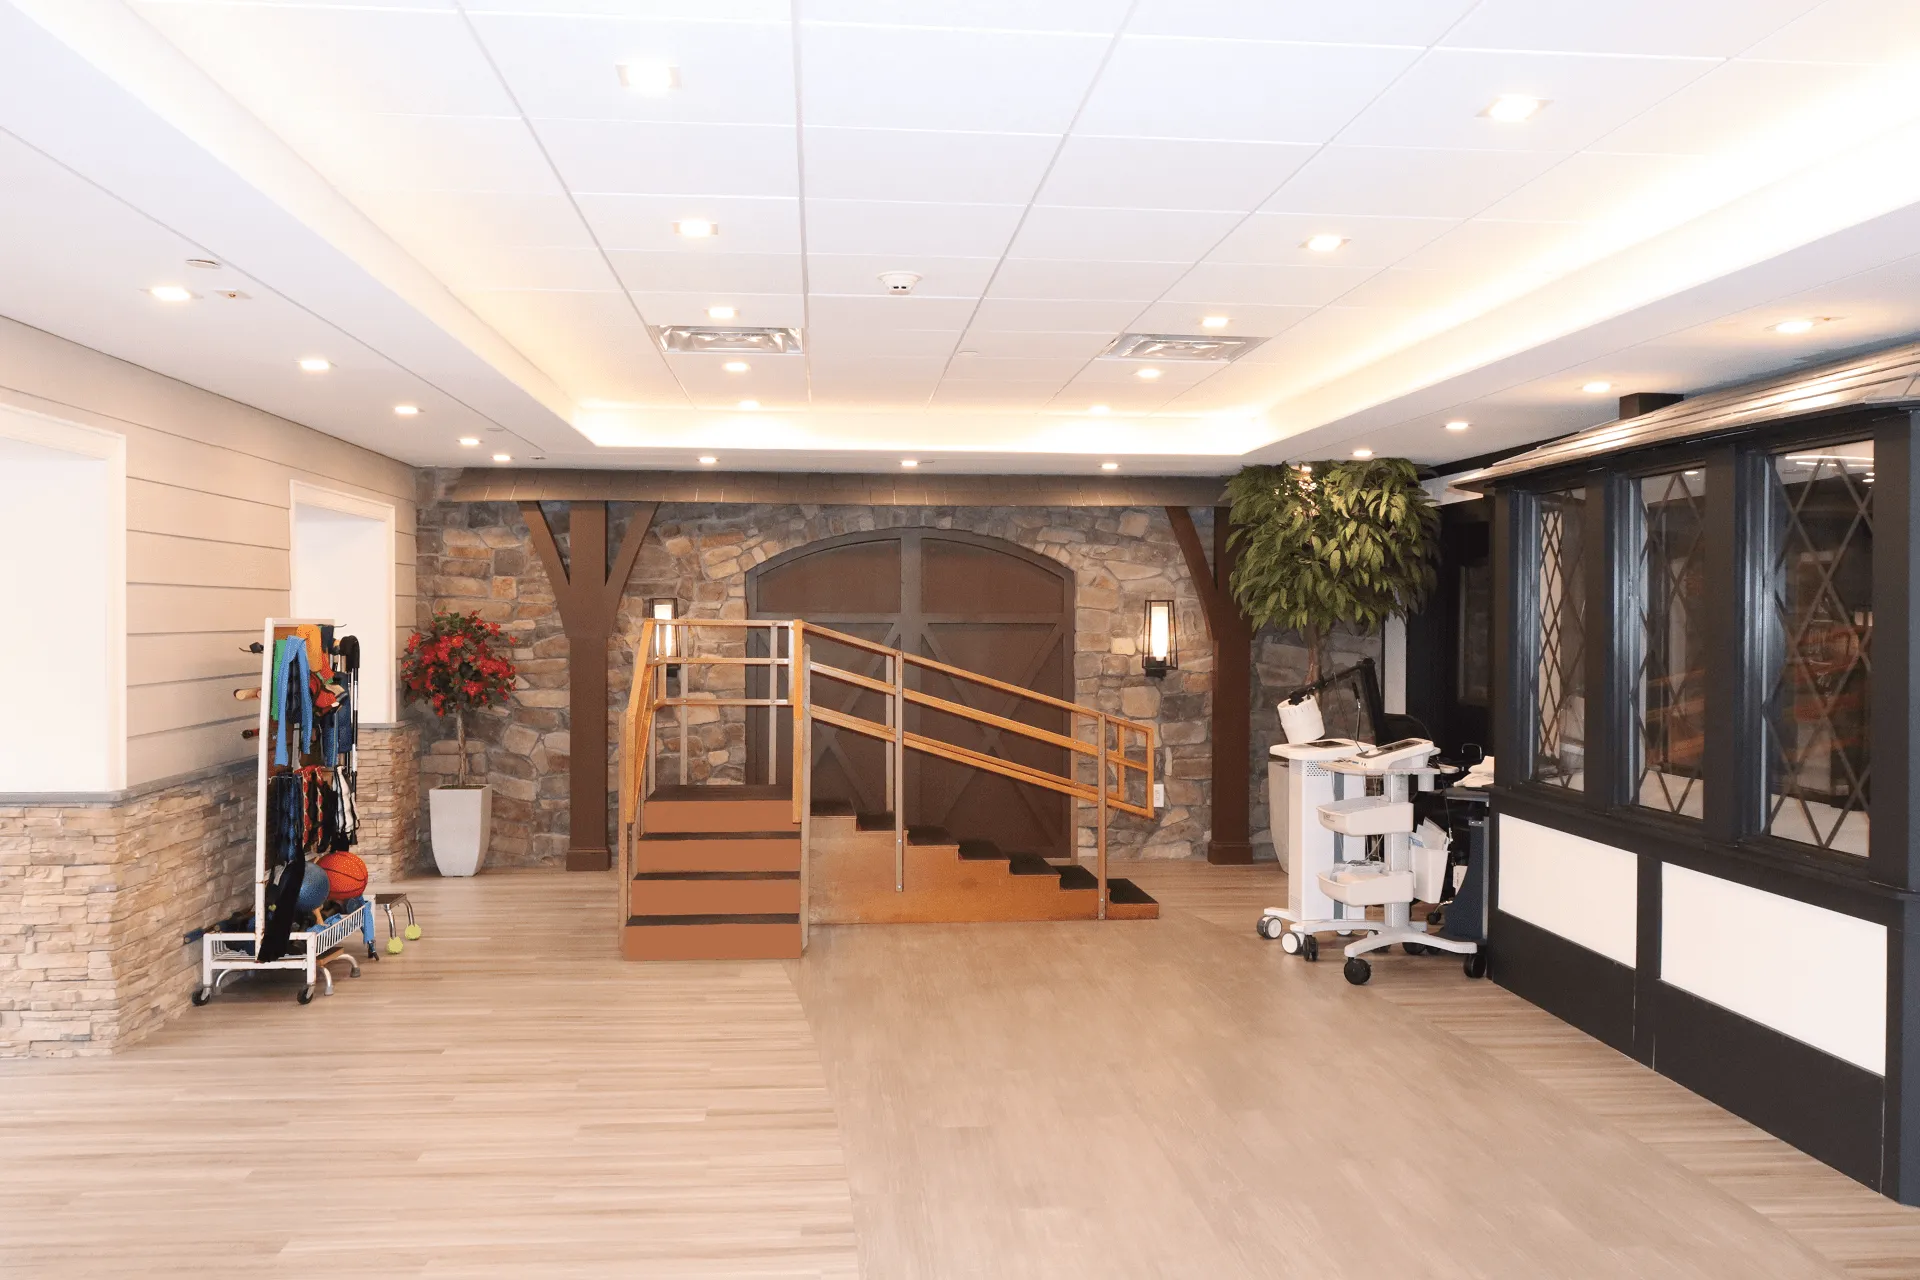
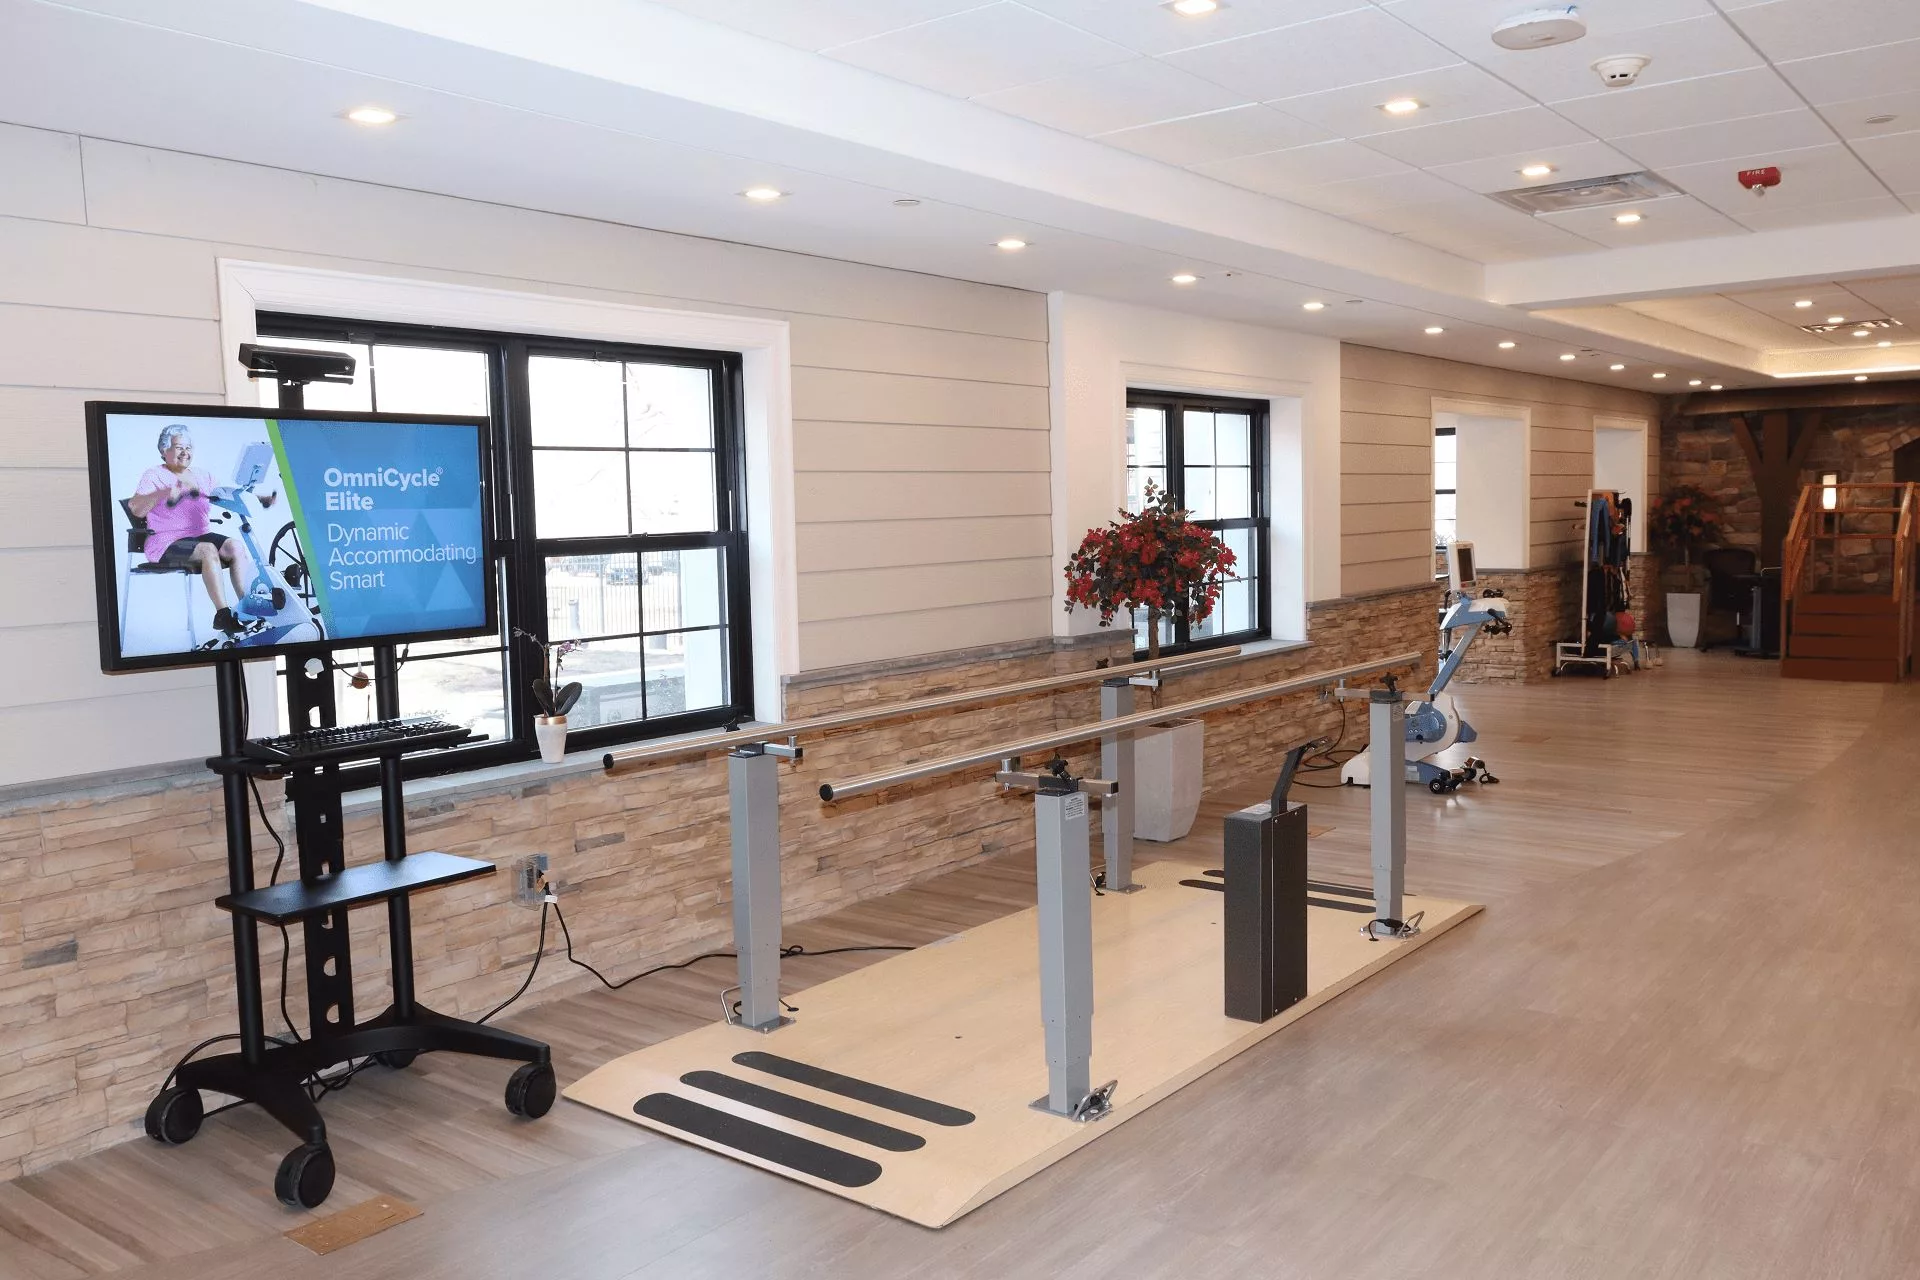
Briarcliff Manor prioritizes compassionate care. The dynamic staff continuously enhances every senior’s experience, offering rehabilitation through proficient professionals and cutting-edge rehab technology. They provide a range of enriching amenities, including spacious well-appointed rooms, complimentary WiFi, cable, and Smart TVs, bilingual staff, restaurant-style dining, nutritional programs, a Registered Dietitian, and so much more. At Briarcliff Manor Center, they go beyond care – creating an environment where recovery is accompanied by comfort, support, and a sense of well-being.

Quality ratings

Measured by Centers for Medicare & Medicaid Services (CMS)

Overall rating Info The Overall CMS Rating combines results from health inspections, staffing levels and quality measures. Health inspections carry the most weight. Staffing and quality scores can increase or decrease the final rating based on performance compared to state and national standards.
1/5
New York average: 3.2/5
Health Inspection Info Based on the results of the facility's three most recent standard inspections and any complaint investigations. CMS reviews the number, scope, and severity of deficiencies, with more recent findings weighted more heavily.
1/5
New York average: 2.9/5
Staffing Info Measures average nursing staff hours per resident per day, including Registered Nurses (RNs) and total nursing staff. Ratings are adjusted based on the level of care residents require and are compared to state and national benchmarks.
1/5
New York average: 2.7/5
Quality Measures Info Based on clinical and physical health indicators reported to CMS, such as hospital readmissions, falls, pressure ulcers, and improvements in mobility. These measures reflect how well residents' health needs are being managed.
4/5
New York average: 4.0/5

Nursing care per resident

Info This shows how many total hours of nursing staff time are available per resident each day. Higher numbers usually mean more staff support.
2h 42m per day

This home provides 22% less nursing time per resident than the New York average.

New York average: 3h 29m per day

Staffing hours breakdown

Info Hours of care per resident per day, broken down by staff type. Data from CMS Medicare.
Staff type Facility State avg National avg
Registered Nurse (RN) Info Registered nurse hours per resident per day. 33m per day 42m per day 41m per day
Nurse Aide Info Nurse aide hours per resident per day. 1h 56m per day 2h 11m per day 2h 21m per day
Total Nursing (Weekend) Info Total number of nurse staff hours per resident per day on weekends. 3h 0m per day 3h 10m per day 3h 26m per day
Physical Therapist Info Physical therapist staff hours per resident per day. 8m per day 7m per day 4m per day
RN (Weekend) Info Registered nurse hours per resident per day on weekends. 28m per day 28m per day 29m per day

Capacity and availability

Medium-capacity home

Offers a balance of services and community atmosphere.

Total beds 120

This home usually has limited availability

Occupancy is moderate, suggesting balanced demand.

Similar demand to the New York average
Occupancy rate 85%
Residents per day (avg) 124
Occupancy rate
85%
Residents per day (avg)
124

Who this home usually serves

TYPE OF STAY

Mostly short-term rehab stays

Most residents typically stay for a few weeks or months before returning home or moving on.

Might be optimal for
Short stays Recovery Medicare-covered care

Breakdown by payment type

Medicare

57% of new residents, usually for short-term rehab.

Typical stay 1 - 2 months

Private pay

32% of new residents, often for short stays.

Typical stay 1 - 2 months

Medicaid

11% of new residents, often for long-term daily care.

Typical stay 1 - 2 years

Finances and operations

Privately-owned community
Operated by a partnership between two or more business owners.
Home revenue
$22.0M
Operating loss
-$2.4M
Privately-owned community Operated by a partnership between two or more business owners.
Home revenue
$21,963,337.00
Operating loss
$-2,407,687.00
Payroll costs Info The portion of the home's budget spent on staff, including nurses, caregivers, and other employees who support care and operations.
$6.2M
28% of revenue
Other operating costs Info All remaining costs needed to run the home, such as food, utilities, building maintenance, supplies and administrative expenses.
$18.2M
Total costs $24.4M
Bed community size
120-bed community
A larger shared setting that may offer more common spaces and organized community services.
Walk Score
Walk Score: 0 / 100
Car-dependent. Most errands require a car, with limited nearby walkable options.

About this community

License details

Facility type
Nursing Home
County: Westchester

Additional licensing details

CMS Certification Number: 335005
Inspection Rating: 1

Ownership & operating entity

Briarcliff Manor Center For Rehabilitation & Nursing is legally operated by Sapphire HC LLC (For Profit).

Care Services

Nursing Services
Rehabilitation Services
Licensed Nurses/CNAs

Amenities & Lifestyle

Spacious well-appointed rooms
complimentary WiFi & cable & smart TVs
bilingual staff
restaurant style dining
individualized nutritional program
registered dietitian on staff
spacious lounges & family room
outdoor patio & deck
magnificent scenic views
well-stocked library
therapeutic recreation
beautician & barber.

Programs & Activities

Specific Programs
Subacute Care, Orthopedic Rehab, EksoNR Rehab, Amenities, Events, Activity Calendar

Dining & Nutrition

Food Description
Restaurant style dining with individualized nutritional programs.

Types of Care at Briarcliff Manor Center For Rehabilitation & Nursing

Memory Care Nursing Home
Contact Briarcliff Manor Center For Rehabilitation & Nursing

Inspection History

In New York, the Department of Health, Office of Aging and Long Term Care performs unannounced onsite inspections to monitor compliance with state and federal healthcare regulations.

14 inspections

10 with citations, 4 without citations

20 on-site complaint investigations

New York average: 9 inspections (5 with citations), 15 on-site complaint investigations

81 complaints

73 complaints per 100 occupied beds

New York average: 49.9 complaints per 100 occupied beds

Formal expressions of dissatisfaction or concern made by residents, or their families regarding various aspects of the care, services, and environment provided.

New York average: 93 complaints

Latest inspection

Date:June 20, 2025
Type:Complaint Investigation

34 total citations

30 health citations 4 life safety citations

Citations indicate regulatory violations. A higher number implies the facility had several areas requiring improvement.

New York average: 29 citations

New York average: 20 health citations

New York average: 4 life safety citations

91 deficiencies

Deficiencies indicate regulatory issues. A higher number implies the facility had several areas requiring improvement.

3 enforcement actions

Penalties or interventions imposed by state regulators when facilities do not comply with quality, safety or regulatory standards.

June 20, 2025: Stipulation & Order #NH-25-070

Quality of Care

September 29, 2023: Stipulation & Order #NH-24-023

Quality of Care

August 6, 2015: Stipulation & Order #NH-16-146

Multiple Deficiencies

Health Inspection History

Inspections
Total health inspections 9

New York average 3.6


Last Health inspection on Jun 2025

Total health citations 37

New York average 18.5

Citations per inspection
4.11

New York average 5.05


Health citations are formal notices following inspections when they fail to comply with safety and care standards.

21 of 37 citations resulted from standard inspections; 11 of 37 resulted from complaint investigations; and 5 of 37 came from combined inspections (standard and complaint).

Breakdown of citation severity (last 3 years)
Critical Health citations More info 1
400% worse than New York average

New York average: 0.2


Serious Health citations More info 1
400% worse than New York average

New York average: 0.2

1 critical citation More info New York average: 0.2

1 serious citation More info New York average: 0.2

33 moderate citations More info New York average: 17.4

2 minor citations More info New York average: 0.7
Citations history (last 3 years)
Abuse/Neglect serious citation Info Issues related to protecting resident's from harm, including abuse, neglect, or mistreatment. Jun 20, 2025
Corrected

Abuse/Neglect moderate citation Info Issues related to protecting resident's from harm, including abuse, neglect, or mistreatment. Mar 12, 2025
Corrected

Infection Control moderate citation Info Issues related to preventing and controlling infections, including hygiene practices and safety protocols. Mar 12, 2025
Corrected

Nursing Services moderate citation Info Issues related to the availability and quality of nursing staff and the care they provide. Mar 12, 2025
Corrected

Compare Nursing Homes around Briarcliff Manor The information below is reported by the New York State Department of Health.

2 facilities compared · CMS & NY Dept. of Health data · Updated Mar 2026

White Plains Center for Nursing Care
NH

Nursing Home Licensed facility providing 24/7 skilled nursing care for residents with complex, ongoing medical needs. Staffed by RNs, LPNs, and CNAs. Inspected and star-rated annually by CMS. Accepts Medicare (short-term rehab) and Medicaid (long-term care).

White Plains
88
91.8%
+4%
3.78
+39%
+5%
0
18
0
82
65
Heschel, Moshe
$16,2M
$5,6M
34.9%
335224
Briarcliff Manor Center For Rehabilitation & Nursing
MC

Memory Care Secured, specialized care for people living with Alzheimer's or dementia. Staff trained in cognitive impairment, with higher staff-to-resident ratios and an environment designed to reduce confusion and wandering risk.

NH

Nursing Home Licensed facility providing 24/7 skilled nursing care for residents with complex, ongoing medical needs. Staffed by RNs, LPNs, and CNAs. Inspected and star-rated annually by CMS. Accepts Medicare (short-term rehab) and Medicaid (long-term care).

Briarcliff Manor
131
85.0%
-4%
2.70
-37%
-25%
1
37
2
124
0
Pollack, Jacob
$21,9M
$6,2M
28.1%
335005

Places of interest near Briarcliff Manor Center For Rehabilitation & Nursing

Address 4.8 miles from city center — 1.63 miles to nearest hospital (Phelps Hospital)

Address 620 Sleepy Hollow Rd, Briarcliff Manor, NY 10510

Calculate Travel Distance to Briarcliff Manor Center For Rehabilitation & Nursing

Add your location

Address

Staffing Data (Q2 2025)

This data corresponds to Q2 2025 and is based on CMS Payroll-Based Journal.

Total staff 154
Employees 120
Contractors 34
Staff to resident ratio 1.60:1
815% better than New York average

New York average ratio: 0.18:1

Avg staff/day 62
Average shift 7.8 hours
0% compared with New York average

New York average: 7.7 hours

Total staff hours (quarter) 43,910
Nursing staff breakdown
Registered Nurse

Manages medical care and health needs.

Total count 12
Average shift length Info Average shift length. Calculated as total hours divided by days worked and average staff per day. 7.5 hours

This role is partially covered by contractors.

Licensed Practical Nurse

Assists with medical care and medications.

Total count 33
Average shift length Info Average shift length. Calculated as total hours divided by days worked and average staff per day. 8 hours

This role is partially covered by contractors.

Certified Nursing Assistant

Helps with daily care and mobility.

Total count 65
Average shift length Info Average shift length. Calculated as total hours divided by days worked and average staff per day. 7.8 hours

This role is partially covered by contractors.

Contractor staffing

Total hours from contractors

21.6%

9,482 contractor hours this quarter

Certified Nursing Assistant: 11 Clinical Nurse Specialist: 4 Physical Therapy Assistant: 4 Respiratory Therapy Technician: 4 Physical Therapy Aide: 3 Registered Nurse: 2 Licensed Practical Nurse: 1 Therapeutic Recreation Specialist: 1 Speech Language Pathologist: 1 Qualified Social Worker: 1 Nurse Aide in Training: 1 Administrator: 1
Staff by category
Certified Nursing Assistant54116517,49091100%7.8
Licensed Practical Nurse321338,11891100%8
Clinical Nurse Specialist84123,54691100%8.8
Registered Nurse102123,25391100%7.5
Nurse Aide in Training6172,2678998%8.7
Physical Therapy Assistant0441,5397886%7.3
Respiratory Therapy Technician0441,5137886%7.6
Other Dietary Services Staff3031,3229099%7.1
Physical Therapy Aide0331,2947886%6.9
Mental Health Service Worker3038866774%7.6
Nurse Practitioner1015036369%8
Therapeutic Recreation Specialist1125016066%6.4
Administrator1124926571%7.4
Qualified Social Worker0114566066%7.6
Dietitian1014475864%7.7
Speech Language Pathologist0112837481%3.8
65 Certified Nursing Assistant
% of Days 100%
33 Licensed Practical Nurse
% of Days 100%
12 Clinical Nurse Specialist
% of Days 100%
12 Registered Nurse
% of Days 100%
7 Nurse Aide in Training
% of Days 98%
4 Physical Therapy Assistant
% of Days 86%
4 Respiratory Therapy Technician
% of Days 86%
3 Other Dietary Services Staff
% of Days 99%
3 Physical Therapy Aide
% of Days 86%
3 Mental Health Service Worker
% of Days 74%
1 Nurse Practitioner
% of Days 69%
2 Therapeutic Recreation Specialist
% of Days 66%
2 Administrator
% of Days 71%
1 Qualified Social Worker
% of Days 66%
1 Dietitian
% of Days 64%
1 Speech Language Pathologist
% of Days 81%

Facility Characteristics

Source: CMS Long-Term Care Facility Characteristics (Data as of Jan 2026)

Total census
96 residents
Residents by payment source
Medicare
33 residents (34.4%)
Medicaid
58 residents (60.4%)
Private pay or other
5 residents (5.2%)

Quality of care over time

These measures show how residents usually do over time at this home, based on health outcomes and preventive care.

High-risk clinical events score Info A composite score based on pressure ulcers, falls with injury, weight loss, walking ability decline, and activities of daily living decline. 7.1
28% better than New York average

New York average: 9.8

Functional decline score Info A composite score based on activities of daily living decline, walking ability decline, and incontinence. 7.5
59% better than New York average

New York average: 18.1

Long-stay resident measures
Significantly above average New York avg: 4.3 Info CMS star rating based on long-stay quality measure performance. 5 stars = significantly above average, 1 star = significantly below average.
Need for Help with Daily Activities Increased Info Percent of long-stay residents whose need for help with daily activities has increased 10.5%
36% better than New York average

New York average: 16.4%

Walking Ability Worsened Info Percent of long-stay residents whose ability to move independently worsened 6.9%
58% better than New York average

New York average: 16.6%

Low Risk Residents with Bowel/Bladder Incontinence Info Percent of low risk long-stay residents who lose control of their bowels or bladder 5.0%
76% better than New York average

New York average: 21.4%

Falls with Major Injury Info Percent of long-stay residents experiencing one or more falls with major injury 0.6%
80% better than New York average

New York average: 3.0%

High Risk Residents with Pressure Ulcers Info Percent of long-stay high risk residents with pressure ulcers 6.7%
6% better than New York average

New York average: 7.2%

Urinary Tract Infection Info Percent of long-stay residents with a urinary tract infection 0.6%
54% better than New York average

New York average: 1.4%

Lost Too Much Weight Info Percent of long-stay residents who lose too much weight 10.7%
75% worse than New York average

New York average: 6.1%

Depressive Symptoms Info Percent of long-stay residents who have depressive symptoms 88.9%
391% worse than New York average

New York average: 18.1%

Antipsychotic Use Info Percent of long-stay residents who received an antipsychotic medication 14.3%
14% worse than New York average

New York average: 12.6%

Pneumococcal Vaccine Info Percent of long-stay residents assessed and appropriately given the pneumococcal vaccine 97.9%
7% better than New York average

New York average: 91.4%

Influenza Vaccine Info Percent of long-stay residents assessed and appropriately given the seasonal influenza vaccine 95.4%
In line with New York average

New York average: 95.2%

Hospitalizations per 1,000 days Info Number of hospitalizations per 1,000 long-stay resident days. 2.77
62% worse than New York average

New York average: 1.71

ED visits per 1,000 days Info Number of outpatient emergency department visits per 1,000 long-stay resident days. 1.52
13% worse than New York average

New York average: 1.35

Short-stay resident measures
Above average New York avg: 3.7 Info CMS star rating based on short-stay quality measure performance. 5 stars = much above average, 1 star = much below average.
Pneumococcal Vaccine Info Percent of short-stay residents assessed and appropriately given the pneumococcal vaccine 89.8%
17% better than New York average

New York average: 76.6%

Antipsychotic medication increase Info Percent of short-stay residents who newly received an antipsychotic medication 2.4%
88% worse than New York average

New York average: 1.3%

Influenza Vaccine Info Percent of short-stay residents assessed and appropriately given the seasonal influenza vaccine 74.1%
6% worse than New York average

New York average: 78.8%

Re-hospitalized after SNF stay Info Percentage of short-stay residents who were re-hospitalized after their nursing home admission. 17.3%
16% better than New York average

New York average: 20.6%

Emergency department visits Info Percentage of short-stay residents who had an outpatient emergency department visit. 12.6%
30% worse than New York average

New York average: 9.7%

Falls with major injury Info Percentage of SNF residents who experience falls with major injury during their stay. 0.0%
100% better than New York average

New York average: 0.8%

Ability to care for self at discharge Info Percentage of residents at or above expected ability to care for themselves at discharge. 60.8%
13% better than New York average

New York average: 53.7%

Successful return to home or community Info Rate of successful return to home or community from a skilled nursing facility. 59.9%
19% better than New York average

New York average: 50.6%

Penalties and fines

Federal penalties imposed by CMS for regulatory violations, including civil money penalties (fines) and denials of payment for new Medicare/Medicaid admissions.

Source: CMS Penalties Database (Data as of Jan 2026)

Total fines amount $117K
77% higher than New York average

New York average: $66K

Number of fines 2
In line with New York average

New York average: 2.0

Payment Denials Info Serious action where Medicare and/or Medicaid temporarily stops payments for new residents until issues are fixed. 0
100% fewer payment denials than New York average

New York average: 0.1

Fines amount comparison
This facility $117K
New York average $66K
Penalty History

Penalties are imposed by CMS for violations of federal nursing home regulations.

Civil Money Penalty Info Fines imposed for noncompliance, which can be assessed per day or per instance of violation. Jun 20, 2025
$57K
Civil Money Penalty Info Fines imposed for noncompliance, which can be assessed per day or per instance of violation. Sep 29, 2023
$60K

Last updated: Jan 2026

Guides for Better Senior Living

Care Cost Calculator: See Prices in Your Area

Nursing Home Data Explorer

Don’t Wait Too Long: 7 Red Flag Signs Your Parent Needs Assisted Living Now

The True Cost of Assisted Living in 2025 – And How Families Are Paying For It

Understanding Senior Living Costs: Pricing Models, Discounts & Financial Assistance

Financial Aid for New York Seniors

Get financial aid guidance

Community First Choice Option

NY Medicaid CFCO

Age 65+ or disabled, New York resident, Medicaid- eligible, care need (not necessarily nursing home level).

~$2,829/month (300% FBR, individual).

$30,182 (individual, higher due to NY Medicaid expansion).

Higher asset limit; urban density increases demand.

Expanded In-Home Services for the Elderly Program (EISEP)

NY EISEP

Age 60+, New York resident, at risk of decline but not nursing home level.

~$2,500/month (individual, varies).

$15,000 (individual).

Cost-sharing required above certain income; urban/rural balance.

Senior Citizen Rent Increase Exemption (SCRIE)

NY SCRIE

Age 62+, NYC resident, live in rent-controlled/stabilized apartment, spend >1/3 of income on rent.

$50,000/year (household).

No strict asset cap, but income-focused eligibility.

Limited to NYC’s rent-regulated units; high demand in urban areas.

Senior Citizen Homeowners’ Exemption (SCHE)

NY SCHE

Age 65+, NYC resident, own and live in a 1-3 family home, co-op, or condo.

$58,399/year (household).

No strict asset cap, income-driven eligibility.

Applies only in NYC; excludes large apartment buildings.

New York Foundation for Senior Citizens (NYFSC) Home Sharing Program

NYFSC Home Sharing

One participant must be 60+ (host or guest), NYC resident, able to share living space.

No strict limit, but targets those needing cost relief.

Not applicable; focus on housing need.

Primarily NYC-focused; limited slots due to demand.