Bridgeway Residential Care Facility
Nursing Home, Assisted Living & Memory Care · Jefferson City, MO
CMS overall rating Info CMS (the Centers for Medicare & Medicaid Services) is the federal agency that rates nursing home quality. Its Overall Rating runs from 1 to 5 stars, combining health inspections, staffing, and quality measures, with inspections weighted most heavily.

Bridgeway Residential Care Facility

Nursing Home, Assisted Living & Memory Care · Jefferson City, MO
CMS overall rating Info CMS (the Centers for Medicare & Medicaid Services) is the federal agency that rates nursing home quality. Its Overall Rating runs from 1 to 5 stars, combining health inspections, staffing, and quality measures, with inspections weighted most heavily.
Calculator: See prices in your area
Bridgeway Residential Care Facility accepts Medicare, Medicaid, and private pay.

Overview of Bridgeway Residential Care Facility

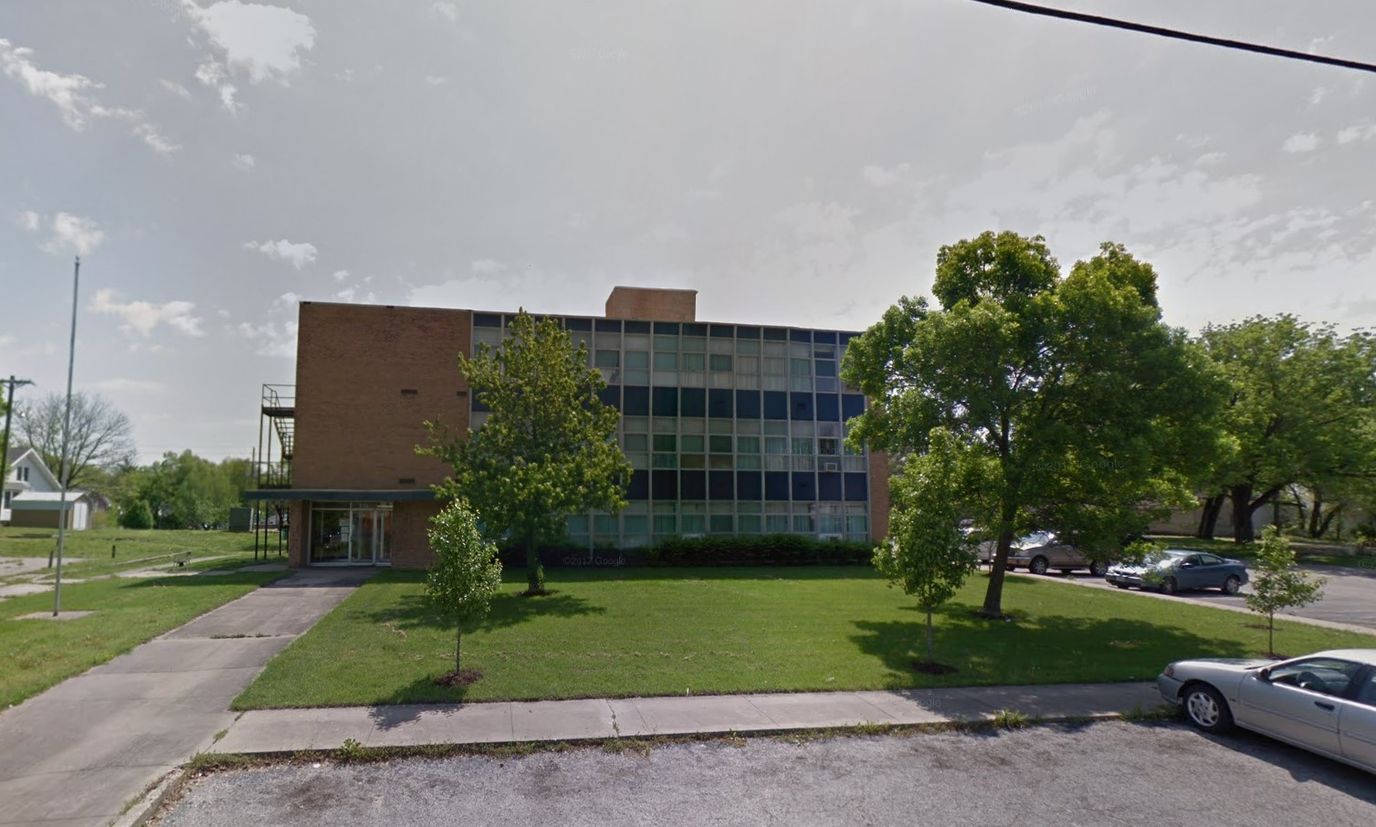
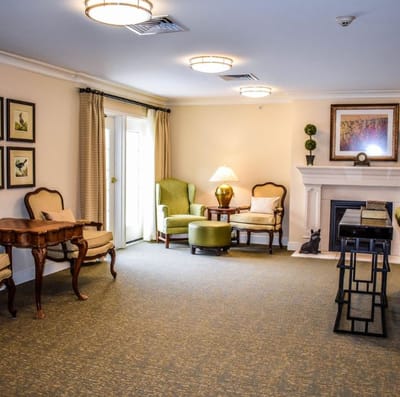
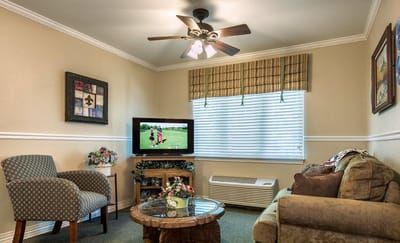
Situated in Fulton, Missouri, Bridgeway Residential Care Facility stands as an inviting home that specializes in assisted living and memory care services. Their holistic approach extends to encompass diabetes care, attentive non ambulatory support, and a dedicated staffing team committed to auxiliary services. Indoors, residents find inviting common areas fostering social connection, while engaging on-site activities create a vibrant atmosphere. The hallmark of this community is its family-style living, accompanied by round-the-clock supervision and person-centered care services, ensuring a nurturing environment that uplifts residents’ self-esteem.

Nestled within close proximity to recreational facilities, cultural events, and essential medical services, Bridgeway Residential Care Facility offers a comprehensive setting that prioritizes both well-being and engagement. With a focus on assisted living and memory care, coupled with their range of specialized services, Bridgeway provides a warm and supportive home where residents can feel at ease.


(573) 642-7770

Quality ratings

Measured by Centers for Medicare & Medicaid Services (CMS)

Overall rating Info The Overall CMS Rating combines results from health inspections, staffing levels and quality measures. Health inspections carry the most weight. Staffing and quality scores can increase or decrease the final rating based on performance compared to state and national standards.
▲ 101.3% Above MO avg. ▲ 101.3% Above MO avg.MO average: 2.5Click the badge to see the full State ranking.Click here to see the full State ranking.
Health Inspection Info Based on the results of the facility's three most recent standard inspections and any complaint investigations. CMS reviews the number, scope, and severity of deficiencies, with more recent findings weighted more heavily.
▲ 44.2% Above MO avg. ▲ 44.2% Above MO avg.MO average: 2.8Click the badge to see the full State ranking.Click here to see the full State ranking.
Staffing Info Measures average nursing staff hours per resident per day, including Registered Nurses (RNs) and total nursing staff. Ratings are adjusted based on the level of care residents require and are compared to state and national benchmarks.
▲ 37.1% Above MO avg. ▲ 37.1% Above MO avg.MO average: 2.2Click the badge to see the full State ranking.Click here to see the full State ranking.
Quality Measures Info Based on clinical and physical health indicators reported to CMS, such as hospital readmissions, falls, pressure ulcers, and improvements in mobility. These measures reflect how well residents' health needs are being managed.
▲ 88.1% Above MO avg. ▲ 88.1% Above MO avg.MO average: 2.7Click the badge to see the full State ranking.Click here to see the full State ranking.

Staffing hours breakdown

Info Daily nursing hours per resident by staff type, reported to CMS. Higher is generally better — compare this facility to state and national averages to see where staffing stands.

Hours per resident per day — compared to Missouri state averages

Total nursing care / resident Info This home is ranked 124th out of 276 homes in Missouri for nurse hours. Total adjusted nursing hours per resident per day, combining RN, LPN, and aide time. CMS adjusts this for case-mix so facilities can be fairly compared.
3h 46m per day
Rank #124 / 276Nurse hours — State benchmarkedThis home is ranked 124th out of 276 homes in Missouri. Shows adjusted nurse hours per resident per day benchmarked to the Missouri average, with a ranking across 276 Missouri facilities. More hours mean more direct care. The national average is about 3.5 hrs; below 3.0 is a red flag.Click the rank badge to see the full State ranking.Click here to see the full State ranking.
This facility Missouri avg (3h 44m per day)
vs Missouri avg
+1%

3 of 6 metrics below state avg

Standout metric Physical Therapist is +192% above state avg
Staff typeHours / Day / Residentvs state avg
Registered Nurse (RN) Info RNs hold the highest nursing license and can assess residents, interpret test results, and direct care plans. More RN hours per day often signals stronger clinical oversight and faster response to health changes. 25m per day ▼ 9% State avg: 28m per day · National avg: 41m per day
LPN / LVN Info Licensed Practical Nurses (LPNs) or Licensed Vocational Nurses (LVNs) deliver routine hands-on care — medication administration, wound dressing, and monitoring vital signs. They work under RN supervision and make up a large share of daily bedside care. 28m per day ▼ 32% State avg: 41m per day · National avg: 52m per day
Nurse Aide Info Certified Nurse Aides (CNAs) provide the most direct day-to-day assistance: bathing, dressing, feeding, and mobility. Nurse aide hours are typically the largest staffing category and directly affect residents' quality of life. 2h 35m per day ▲ 12% State avg: 2h 19m per day · National avg: 2h 20m per day
Weekend Total Nursing Info Combined nursing hours (RN + LPN + Nurse Aide) per resident per day on weekends. Staffing often drops on weekends — this figure reveals whether the facility maintains adequate coverage outside of weekday hours. 3h 9m per day ▲ 3% State avg: 3h 3m per day · National avg: 3h 27m per day
Physical Therapist Info Hours per resident per day provided by licensed Physical Therapists (PTs) or PT Assistants. PT services help residents recover mobility after injury or illness and are especially important for post-acute (short-stay) rehabilitation. 8m per day ▲ 192% State avg: 3m per day · National avg: 4m per day
Weekend RN Info Registered nurse hours specifically on weekends. Facilities sometimes reduce RN presence on Saturdays and Sundays — a low weekend RN figure compared to weekday hours can indicate reduced clinical oversight when most administrative staff are absent. 19m per day ▼ 6% State avg: 20m per day · National avg: 29m per day

Capacity and availability

This home usually has limited availability

Higher occupancy than the Missouri average: 66.6%
Occupancy rate
90.5% Rank #38 / 428Occupancy rate — State benchmarkedThis home is ranked 38th out of 428 homes in Missouri. Shows this facility's occupancy rate versus the Missouri average, with its Statewide rank out of 428. Higher occupancy signals strong local demand and financial stability.Click the rank badge to see the full State ranking.Click here to see the full State ranking.
Avg. Length of Stay
79 days
Walk Score
Walk Score: 58 / 100 Rank #170 / 563Walk Score — State benchmarkedThis home is ranked 170th out of 563 homes in Missouri. Shows how walkable this facility's neighborhood is compared to the average Walk Score across Missouri facilities. Higher scores benefit residents, families, and staff.Click the rank badge to see the full State ranking.Click here to see the full State ranking.
Moderately walkable. Some errands can be accomplished on foot, with a mix of nearby amenities.

About this community

Payment & Insurance

1 service
Accept Medicaid

Staffing & Medical

1 service
24-Hour Staffing

Additional Policies & Features

Admission CriteriaMust have a psychological approved for Intellectual Disability waiver services; Adult Male and female 18 years and older with Intellectual Disability Mild to Profound; Approve for MR waiver services; Can be ambulatory or non-ambulatory; Complete an admission application; Have a current assessment, indicating needs; Medical and social history; Current physical examination report and TB screening results; Face to-Face Interview.
Minimum Age18

Amenities & Lifestyle

Specific ProgramsCommunity Engagement, Group Day Services, Monitoring health care needs, Community integration activities, Training in Daily Living Skills, Social Skills Training, Recreational Opportunities, Medication Management assistance
Touring HoursOffice hours: 9am - 5pm; Community Engagement: 8am - 4pm

Contact Bridgeway Residential Care Facility

Staffing Data

Reporting period: October 1 – December 31, 2025 (Q4 2025). Source: CMS Payroll-Based Journal report.

Total staff 150
Employees 147
Contractors 3
Staff to resident ratio 2.31 : 1
36% more staff per resident than Missouri average
Missouri average ratio: 1.69 : 1 Missouri average ratio: 1.69 : 1See full Missouri ranking
Avg staff/day 44
Average shift 7.4 hours
9% worse than Missouri average
Missouri average: 8.1 hours Missouri average shift: 8.1 hoursSee full Missouri ranking
Total staff hours (quarter) 29,833

Nursing staff breakdown

Q4 2025 · Oct 1 – Dec 31 More info This data comes from the CMS Payroll-Based Journal report covering October 1 – December 31, 2025.
Registered Nurse

Manages medical care and health needs.

RN Staff Info All 8 RN Staff are full-time employees. No contractors work on this role. 8
Average shift length Info Average shift length. Calculated as total hours divided by days worked and average staff per day. 8.1 hours
Licensed Practical Nurse

Assists with medical care and medications.

LPN Staff Info All 7 LPN Staff are full-time employees. No contractors work on this role. 7
Average shift length Info Average shift length. Calculated as total hours divided by days worked and average staff per day. 9.5 hours
Certified Nursing Assistant

Helps with daily care and mobility.

CNA Staff Info All 50 CNA Staff are full-time employees. No contractors work on this role. 50
Average shift length Info Average shift length. Calculated as total hours divided by days worked and average staff per day. 7.6 hours

Contractor staffing

Q4 2025 · Oct 1 – Dec 31 More info This data comes from the CMS Payroll-Based Journal report covering October 1 – December 31, 2025.

Total hours from contractors

0.1%

41 contractor hours this quarter

Medical Director: 2 Physical Therapy Assistant: 1

Staff by category

Q4 2025 · Oct 1 – Dec 31 More info This data comes from the CMS Payroll-Based Journal report covering October 1 – December 31, 2025.
Certified Nursing Assistant5005013,05892100%7.6
Medication Aide/Technician9092,90792100%8.1
Licensed Practical Nurse7072,5459098%9.5
Registered Nurse8081,2838390%8.1
Dental Services Staff4041,1106874%7.6
Nurse Aide in Training120121,1067480%6.9
Clinical Nurse Specialist5051,0088087%7
Respiratory Therapy Technician150158878390%4.4
Other Dietary Services Staff3038818592%6.8
Physical Therapy Aide8086436571%5.6
RN Director of Nursing1015357683%7
Administrator1015016368%7.9
Speech Language Pathologist5054955863%6.8
Dietitian1014816368%7.6
Nurse Practitioner1014805661%8.6
Physical Therapy Assistant7184546267%5.3
Qualified Social Worker5054476166%7.3
Therapeutic Recreation Specialist2024445257%8
Mental Health Service Worker1014256368%6.8
Occupational Therapy Aide1011086368%1.7
Occupational Therapy Assistant101281617%1.8
Medical Director0221055%2
50 Certified Nursing Assistant
% of Days 100%
9 Medication Aide/Technician
% of Days 100%
7 Licensed Practical Nurse
% of Days 98%
8 Registered Nurse
% of Days 90%
4 Dental Services Staff
% of Days 74%
12 Nurse Aide in Training
% of Days 80%
5 Clinical Nurse Specialist
% of Days 87%
15 Respiratory Therapy Technician
% of Days 90%
3 Other Dietary Services Staff
% of Days 92%
8 Physical Therapy Aide
% of Days 71%
1 RN Director of Nursing
% of Days 83%
1 Administrator
% of Days 68%
5 Speech Language Pathologist
% of Days 63%
1 Dietitian
% of Days 68%
1 Nurse Practitioner
% of Days 61%
8 Physical Therapy Assistant
% of Days 67%
5 Qualified Social Worker
% of Days 66%
2 Therapeutic Recreation Specialist
% of Days 57%
1 Mental Health Service Worker
% of Days 68%
1 Occupational Therapy Aide
% of Days 68%
1 Occupational Therapy Assistant
% of Days 17%
2 Medical Director
% of Days 5%

Penalties and fines

Federal penalties imposed by CMS for regulatory violations, including civil money penalties (fines) and denials of payment for new Medicare/Medicaid admissions.

Source: CMS Penalties Database

No penalties in the past 3 years

No civil money penalties or payment denials were reported in the last 3 years.

Quality of care over time

These measures show how residents usually do over time at this home, based on health outcomes and preventive care.

High-risk clinical events score Info A composite score based on pressure ulcers, falls with injury, weight loss, walking ability decline, and activities of daily living decline. 12.2
11% worse than Missouri average

Missouri average: 10.9

Functional decline score Info A composite score based on activities of daily living decline, walking ability decline, and incontinence. 22.9
18% worse than Missouri average

Missouri average: 19.5

Long-stay resident measures
Need for Help with Daily Activities Increased Info Percent of long-stay residents whose need for help with daily activities has increased 23.0%
16% worse than Missouri average

Missouri average: 19.8%

Walking Ability Worsened Info Percent of long-stay residents whose ability to move independently worsened 21.7%
5% worse than Missouri average

Missouri average: 20.6%

Low Risk Residents with Bowel/Bladder Incontinence Info Percent of low risk long-stay residents who lose control of their bowels or bladder 24.1%
33% worse than Missouri average

Missouri average: 18.1%

Falls with Major Injury Info Percent of long-stay residents experiencing one or more falls with major injury 8.2%
104% worse than Missouri average

Missouri average: 4.0%

High Risk Residents with Pressure Ulcers Info Percent of long-stay high risk residents with pressure ulcers 4.7%
6% better than Missouri average

Missouri average: 5.0%

Urinary Tract Infection Info Percent of long-stay residents with a urinary tract infection 1.3%
52% better than Missouri average

Missouri average: 2.7%

Lost Too Much Weight Info Percent of long-stay residents who lose too much weight 3.2%
42% better than Missouri average

Missouri average: 5.6%

Depressive Symptoms Info Percent of long-stay residents who have depressive symptoms 3.6%
72% better than Missouri average

Missouri average: 12.8%

Antipsychotic Use Info Percent of long-stay residents who received an antipsychotic medication 14.3%
35% better than Missouri average

Missouri average: 22.0%

Pneumococcal Vaccine Info Percent of long-stay residents assessed and appropriately given the pneumococcal vaccine 97.8%
15% better than Missouri average

Missouri average: 85.2%

Influenza Vaccine Info Percent of long-stay residents assessed and appropriately given the seasonal influenza vaccine 95.0%
5% better than Missouri average

Missouri average: 90.9%

Short-stay resident measures
Pneumococcal Vaccine Info Percent of short-stay residents assessed and appropriately given the pneumococcal vaccine 95.4%
43% better than Missouri average

Missouri average: 66.6%

Antipsychotic medication increase Info Percent of short-stay residents who newly received an antipsychotic medication 1.3%
40% better than Missouri average

Missouri average: 2.2%

Influenza Vaccine Info Percent of short-stay residents assessed and appropriately given the seasonal influenza vaccine 89.6%
41% better than Missouri average

Missouri average: 63.5%

Breakdown by payment type

Medicare

21% of new residents, usually for short-term rehab.

Typical stay 26 days

Private pay

68% of new residents, often for short stays.

Typical stay 1 - 2 months

Medicaid

11% of new residents, often for long-term daily care.

Typical stay 11 - 12 months

Facility Characteristics

Source: CMS Long-Term Care Facility Characteristics (Data as of Jan 2026)

Total residents 65
Medicare
13
20% of residents
Medicaid
27
41.5% of residents
Private pay or other
25
38.5% of residents
Programs & Services
Residents Group

Residents meet regularly to discuss policies, care quality, and activities

Nurse Aide Training

State-approved Nurse Aide Training and Competency Evaluation Program on-site

Active Resident Council

Organized group of residents that meets regularly to discuss facility policies, quality of life, and activities.

Finances and operations

Based on the 2024 CMS SNF Cost Report.

Governmental community
Operated by a subsidized facility district.
Home revenue
$75.6M
Surplus of revenue
$1.1M
Governmental community Operated by a subsidized facility district.
Home revenue
$75.6M Rank #2 / 286Revenue — State benchmarkedThis home is ranked 2nd out of 286 homes in Missouri. Shows this facility's annual revenue compared to the Missouri average. Higher revenue generally means more resources for staffing and capital — read alongside Payroll %.Click the rank badge to see the full State ranking.Click here to see the full State ranking.
Surplus of revenue
$1.1M
Payroll costs Info The portion of the home's budget spent on staff, including nurses, caregivers, and other employees who support care and operations. Rank #71 / 286Payroll — State benchmarkedThis home is ranked 71st out of 286 homes in Missouri. Shows total annual staff payroll benchmarked to the Missouri average. Higher payroll investment relative to peers often signals better staffing and less reliance on cheaper contract labor.Click the rank badge to see the full State ranking.Click here to see the full State ranking.
$5.3M
7% of revenue Rank #285 / 286Payroll % — State benchmarkedThis home is ranked 285th out of 286 homes in Missouri. Shows payroll as a percentage of revenue versus the Missouri average. Well-run Missouri facilities typically land around 60–71% — the top third Statewide. Below 25% may signal understaffing or heavy agency use — read with Staffing ratings.Click the rank badge to see the full State ranking.Click here to see the full State ranking.
Other operating costs Info All remaining costs needed to run the home, such as food, utilities, building maintenance, supplies and administrative expenses.
$69.2M
Total costs $74.5M

What does this home offer?

Housing options icon

Housing Options: Private Rooms / Semi-Private Rooms

Building type icon
Building type icon

Building Type: Mid-rise

Fitness and recreation icon

Fitness and Recreation

Who this home usually serves

TYPE OF STAY

Primarily short stays

Residents typically stay for brief periods, with frequent admissions and discharges throughout the year.

Most new residents arrive under private pay (68% of admissions), and a typical private pay stay runs around 1 - 2 months.

Admissions
311 total

Coverage residents most often arrive under.

Medicare 21%
Private pay 68%
Medicaid 11%
Discharges
328 total

Coverage residents most often leave under.

Medicare 20%
Private pay 68%
Medicaid 12%

Places of interest near Bridgeway Residential Care Facility

Address 24.8 miles from city center Info Estimated distance in miles from Fulton's city center to Bridgeway Residential Care Facility's address, calculated via Google Maps.

Calculate Travel Distance to Bridgeway Residential Care Facility

Add your location

Address

Financial Assistance for
Nursing Home in Missouri

Bridgeway Residential Care Facility is located in Fulton, Missouri.
Here are the financial assistance programs available to residents in Missouri.

Get Financial aid guidance

Aged and Disabled Waiver

Missouri Medicaid A&D Waiver

Age 65+ or disabled
General Missouri resident, Medicaid- eligible, nursing home-level care need.
Income Limits (2025) ~$2,829/month 300% FBR, individual
Asset Limits $2,000 (individual), $3,000 (couple).
MO

Rural access prioritized.

Benefits
Personal care (5-7 hours/day) Respite (240 hours/year) Adult day care (~$65/day) Home health services

Missouri Supplemental Nursing Care (SNC)

MO SNC

Age 65+
General Missouri resident, in approved facility.
Income Limits ~$1,215/month individual
Asset Limits $2,000 individual
MO

Supplements SSI; facility-based only.

Benefits
Monthly cash payment (~$156-$292/month) for care costs

Structured Family Caregiving Waiver (SFCW)

Missouri Structured Family Caregiving Waiver

Age 65+
General Missouri resident, MO HealthNet-eligible, NFLOC, dementia diagnosis, live with caregiver.
Income Limits (2025) ~$2,901/month (300% FBR, individual); QIT required.
Asset Limits $5,909.25 (individual), $11,818.45 (couple).
MO

Caregiver must be family; small program size.

Benefits
Cash stipend ($1,000-$1,500/month) to family caregiver Respite Training Supplies ($500/year)

MO HealthNet Aged, Blind, and Disabled (ABD)

Missouri MO HealthNet ABD

Age 65+ or disabled
General Missouri resident, MO HealthNet-eligible, needs help with 1+ ADL.
Income Limits (2025) ~$1,690/month (individual, projected); spenddown allowed.
Asset Limits $5,909.25 (individual), $11,818.45 (couple).
MO

Less intensive than waivers; statewide access.

Benefits
Personal care (2-4 hours/day) Homemaker services Limited respite Medical equipment

Medicare Savings Program (MSP)

Missouri Medicare Savings Program

Age 65+ or disabled
General Missouri resident, Medicare Part A/B.
Income Limits (2025) ~$2,510/month (QMB), ~$3,380/month (SLMB), ~$3,598/month (QI)—individual.
Asset Limits $9,430 (individual), $14,130 (couple).
MO

Three tiers; no waitlist; includes Extra Help for Part D.

Benefits
Covers Part B premiums ($174.70/month) Deductibles ($240/year) Copays (~20%)

Missouri Caregiver Program (Customized Caregiver Training & Relief)

Missouri Caregiver Program

Age
General Caregivers of 60+ with dementia, Missouri resident, functional needs (2+ ADLs).
Income Limits (2025) No strict cap; prioritizes low-income ~$24,980/year individual
Asset Limits Not assessed; need-based.
MO

Administered via AAAs and Alzheimer’s Association; rural focus.

Benefits
Respite (4-6 hours/week) Training Assistive tech ($500/year) Supplies

VA Aid and Attendance (A&A) and Housebound Benefits

Missouri VA Aid and Attendance/Housebound

Age 65+ or disabled veteran/spouse
General Missouri resident, wartime service, need for ADL help (A&A) or homebound.
Income Limits (2025) Net income < ~$1,984/month (veteran with dependent, A&A); pension offsets income.
Asset Limits ~$155,356 net worth limit
MO

High veteran demand in rural/urban areas.

Benefits
Cash (~$1,433-$2,642/month veteran, ~$951-$1,318 spouse) for care costs (e.g., in-home, assisted living)

Compare Nursing Home around Jefferson City

The information below is reported by the Missouri Department of Health and Senior Services, Division of Regulation and Licensure.

5 facilities compared · CMS & MO Dept. of Health data

Bridgeway Residential Care Facility
NH

Nursing Home Licensed facility providing 24/7 skilled nursing care for residents with complex, ongoing medical needs. Staffed by RNs, LPNs, and CNAs. Inspected and star-rated annually by CMS. Accepts Medicare (short-term rehab) and Medicaid (long-term care).

AL

Assisted Living A licensed, long-term care setting for seniors or individuals with disabilities who need help with daily activities — like bathing, dressing, and medication management — but not 24-hour skilled nursing. Offers housing, meals, and around-the-clock support while aiming to maximize resident independence.

MC

Memory Care Secured, specialized care for people living with Alzheimer's or dementia. Staff trained in cognitive impairment, with higher staff-to-resident ratios and an environment designed to reduce confusion and wandering risk.

Fulton
78
Facility 78
MO AVG 97
Rank #278 / 454
90.5%
Facility 90.5%
MO AVG 66.6%
Rank #38 / 428
+36%
3.77
Facility 3.77
MO AVG 3.74
Rank #124 / 276
-31%+1%
$0
Facility $0
MO AVG $76.9k
Rank #1 / 283
9
Facility 9
MO AVG 36.5
Rank #11 / 281
3.0
Facility 3.0
MO AVG 5.7
Rank #23 / 281
-72-
58
Facility 58
MO AVG 45
Rank #170 / 563
-
$75.6M
Facility $75.6M
MO AVG $8.4M
Rank #2 / 286
$5.3M
Facility $5.3M
MO AVG $3.3M
Rank #71 / 286
7%
Facility 7%
MO AVG 45.6%
Rank #285 / 286
265519
Heisinger Bluffs
NH

Nursing Home Licensed facility providing 24/7 skilled nursing care for residents with complex, ongoing medical needs. Staffed by RNs, LPNs, and CNAs. Inspected and star-rated annually by CMS. Accepts Medicare (short-term rehab) and Medicaid (long-term care).

AL

Assisted Living A licensed, long-term care setting for seniors or individuals with disabilities who need help with daily activities — like bathing, dressing, and medication management — but not 24-hour skilled nursing. Offers housing, meals, and around-the-clock support while aiming to maximize resident independence.

IL

Independent Living Lifestyle-focused communities for older adults offering dining, activities, and transportation with minimal personal care. Best for active, independent seniors who want community without medical support.

MC

Memory Care Secured, specialized care for people living with Alzheimer's or dementia. Staff trained in cognitive impairment, with higher staff-to-resident ratios and an environment designed to reduce confusion and wandering risk.

RC

Respite Care Short-term temporary care — days to weeks — to give family caregivers a break. Full care provided during the stay. Often used after hospitalization or to trial a facility before a permanent placement decision.

Jefferson City
111
Facility 111
MO AVG 97
Rank #156 / 454
49.5%
Facility 49.5%
MO AVG 66.6%
Rank #370 / 428
-26%
3.36
Facility 3.36
MO AVG 3.74
Rank #184 / 276
+42%-10%
$8.1k
Facility $8.1k
MO AVG $76.9k
Rank #206 / 283
17
Facility 17
MO AVG 36.5
Rank #61 / 281
5.7
Facility 5.7
MO AVG 5.7
Rank #169 / 281
-56-
32
Facility 32
MO AVG 45
Rank #376 / 563
Hb Operations Holdco LLC
$5.4M
Facility $5.4M
MO AVG $8.4M
Rank #183 / 286
$3.7M
Facility $3.7M
MO AVG $3.3M
Rank #138 / 286
68.1%
Facility 68.1%
MO AVG 45.6%
Rank #43 / 286
265794
StoneBridge Senior Living Oak Tree
NH

Nursing Home Licensed facility providing 24/7 skilled nursing care for residents with complex, ongoing medical needs. Staffed by RNs, LPNs, and CNAs. Inspected and star-rated annually by CMS. Accepts Medicare (short-term rehab) and Medicaid (long-term care).

AL

Assisted Living A licensed, long-term care setting for seniors or individuals with disabilities who need help with daily activities — like bathing, dressing, and medication management — but not 24-hour skilled nursing. Offers housing, meals, and around-the-clock support while aiming to maximize resident independence.

MC

Memory Care Secured, specialized care for people living with Alzheimer's or dementia. Staff trained in cognitive impairment, with higher staff-to-resident ratios and an environment designed to reduce confusion and wandering risk.

Jefferson City
42
Facility 42
MO AVG 97
Rank #413 / 454
71.4%
Facility 71.4%
MO AVG 66.6%
Rank #173 / 428
+7%- -60%-
$0
Facility $0
MO AVG $76.9k
Rank #1 / 283
21
Facility 21
MO AVG 36.5
Rank #80 / 281
3.5
Facility 3.5
MO AVG 5.7
Rank #57 / 281
132-
27
Facility 27
MO AVG 45
Rank #414 / 563
Ricky Doerhoff
$5.0M
Facility $5.0M
MO AVG $8.4M
Rank #203 / 286
$2.3M
Facility $2.3M
MO AVG $3.3M
Rank #231 / 286
46.9%
Facility 46.9%
MO AVG 45.6%
Rank #208 / 286
265819
The Jefferson City Nursing and Rehabilitation Center
NH

Nursing Home Licensed facility providing 24/7 skilled nursing care for residents with complex, ongoing medical needs. Staffed by RNs, LPNs, and CNAs. Inspected and star-rated annually by CMS. Accepts Medicare (short-term rehab) and Medicaid (long-term care).

AL

Assisted Living A licensed, long-term care setting for seniors or individuals with disabilities who need help with daily activities — like bathing, dressing, and medication management — but not 24-hour skilled nursing. Offers housing, meals, and around-the-clock support while aiming to maximize resident independence.

Jefferson City
120
Facility 120
MO AVG 97
Rank #89 / 454
67.5%
Facility 67.5%
MO AVG 66.6%
Rank #203 / 428
+1%
4.28
Facility 4.28
MO AVG 3.74
Rank #66 / 276
-27%+14%
$14.4k
Facility $14.4k
MO AVG $76.9k
Rank #208 / 283
31
Facility 31
MO AVG 36.5
Rank #146 / 281
3.4
Facility 3.4
MO AVG 5.7
Rank #46 / 281
368A+
33
Facility 33
MO AVG 45
Rank #369 / 563
Victoria Gilbert
$8.3M
Facility $8.3M
MO AVG $8.4M
Rank #97 / 286
$5.7M
Facility $5.7M
MO AVG $3.3M
Rank #66 / 286
68.5%
Facility 68.5%
MO AVG 45.6%
Rank #39 / 286
265530
Jefferson City Manor
NH

Nursing Home Licensed facility providing 24/7 skilled nursing care for residents with complex, ongoing medical needs. Staffed by RNs, LPNs, and CNAs. Inspected and star-rated annually by CMS. Accepts Medicare (short-term rehab) and Medicaid (long-term care).

MC

Memory Care Secured, specialized care for people living with Alzheimer's or dementia. Staff trained in cognitive impairment, with higher staff-to-resident ratios and an environment designed to reduce confusion and wandering risk.

NC

Nursing Care

Jefferson City
102
Facility 102
MO AVG 97
Rank #169 / 454
66.7%
Facility 66.7%
MO AVG 66.6%
Rank #210 / 428
0%
3.53
Facility 3.53
MO AVG 3.74
Rank #168 / 276
-22%-5%
$8.3k
Facility $8.3k
MO AVG $76.9k
Rank #154 / 283
34
Facility 34
MO AVG 36.5
Rank #161 / 281
3.4
Facility 3.4
MO AVG 5.7
Rank #46 / 281
269-
4
Facility 4
MO AVG 45
Rank #530 / 563
Cynthia Juckette
$13.2M
Facility $13.2M
MO AVG $8.4M
Rank #54 / 286
$4.2M
Facility $4.2M
MO AVG $3.3M
Rank #111 / 286
31.9%
Facility 31.9%
MO AVG 45.6%
Rank #276 / 286
265285

Frequently Asked Questions about Bridgeway Residential Care Facility

What neighborhood is Bridgeway Residential Care Facility in?

Bridgeway Residential Care Facility is in the Fulton neighborhood.

Is Bridgeway Residential Care Facility in a walkable area?

Bridgeway Residential Care Facility has a walk score of 58. Moderately walkable. Some errands can be accomplished on foot, with a mix of nearby amenities.

What is the occupancy rate at Bridgeway Residential Care Facility?

Bridgeway Residential Care Facility's occupancy is 90.5%.

Are there photos of Bridgeway Residential Care Facility?

Yes — there are 4 photos of Bridgeway Residential Care Facility in the photo gallery on this page.

What is the phone number of Bridgeway Residential Care Facility?

(573) 642-7770 will put you in contact with the team at Bridgeway Residential Care Facility.

Is Bridgeway Residential Care Facility Medicare or Medicaid certified?

Yes — Bridgeway Residential Care Facility is a CMS-certified provider of Medicare and Medicaid.

Guides for Better Senior Living

Care Cost Calculator: See Prices in Your Area

Nursing Home Data Explorer

Don’t Wait Too Long: 7 Red Flag Signs Your Parent Needs Assisted Living Now

The True Cost of Assisted Living in 2025 – And How Families Are Paying For It

Understanding Senior Living Costs: Pricing Models, Discounts & Financial Assistance

Explore Open Rooms
1 Contact details
2 What type of senior care service are you looking for?
3 What budget do you have in mind for senior care?
4 How soon do you need to find care?
5 Additional details

Thank you for your interest!

Our team will be in touch shortly to help with next steps.