


Brightview Columbia
Memory Care, Independent Living & Assisted Living · Columbia, MD
Brightview Columbia
Memory Care, Independent Living & Assisted Living · Columbia, MD
Overview of Brightview Columbia
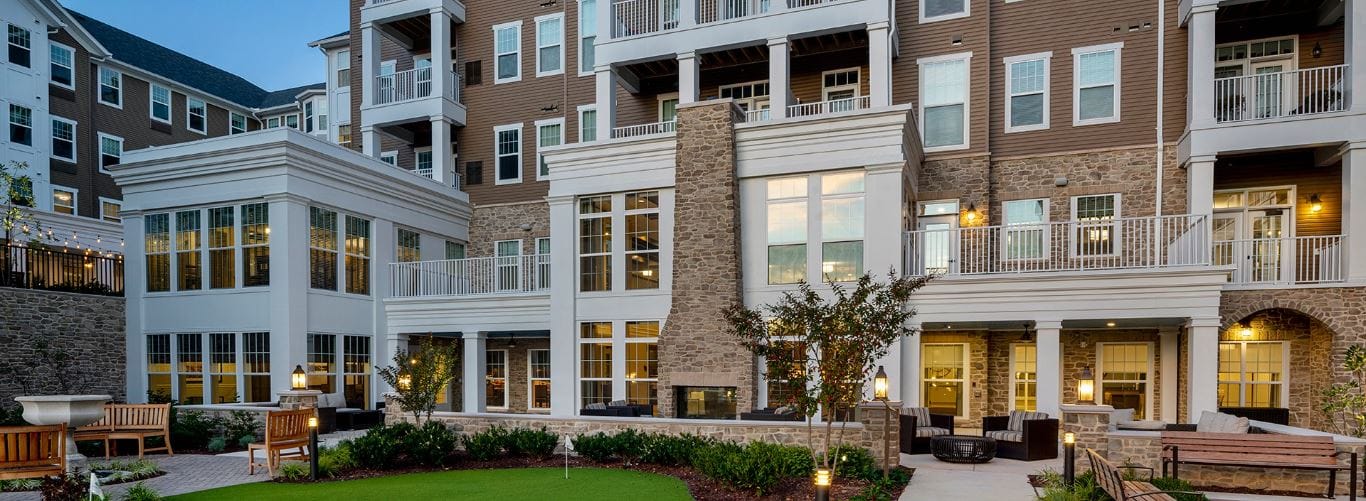
Nestled in the vibrant town of Columbia, MD, the Brightview Columbia is a remarkable senior living community that provides independent living, assisted living, and memory care services. Beautifully appointed and spacious accommodations with varying floor plans are available for its residents based on their preferences. In terms of memory care, this community offers innovative memory care services through its Wellspring Village Neighborhood for those with cognitive conditions.
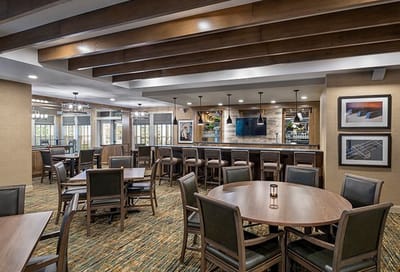
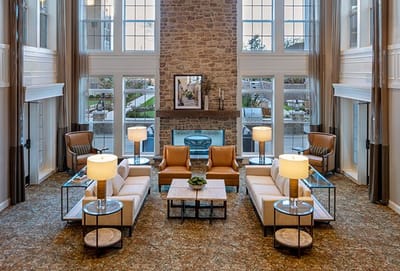
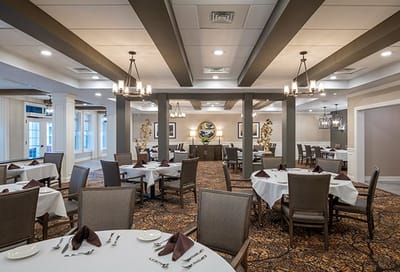
As an award-winning community for senior living experience, it is committed to delivering exceptional amenities and services. Indulge in delightful and healthy chef-prepared meals daily, beauty salon, fitness room, and art studio. Explore its beautifully designed common spaces such as the courtyard and outdoor gardens. Have fun in its interactive full-packed programs and activities to further social engagement. With Brightview Columbia, seniors are guaranteed a glorious living experience.
80-bed community Rank #180 / 697Bed count — State benchmarkedThis home is ranked 180th out of 697 homes in Maryland. Shows this facility's certified or reported bed count compared to other Maryland SNFs. Larger communities may offer more amenities, programs, and on-site services for residents and families.Click the rank badge to see the full State ranking.Click here to see the full State ranking.
A larger shared setting that may offer more common spaces and organized community services.
4 years in operation Rank #191 / 208Years in operation — State benchmarkedThis home is ranked 191st out of 208 homes in Maryland. Shows how long this facility has been in operation compared to other Maryland SNFs. Longer operating histories may benefit residents, families, and staff.Click the rank badge to see the full State ranking.Click here to see the full State ranking.
An established community with some operational experience and growing routines.
Walk Score: 26 / 100 Rank #677 / 985Walk Score — State benchmarkedThis home is ranked 677th out of 985 homes in Maryland. Shows how walkable this facility's neighborhood is compared to the average Walk Score across Maryland SNFs. Higher scores benefit residents, families, and staff.Click the rank badge to see the full State ranking.Click here to see the full State ranking.
Somewhat walkable. A few nearby services may be reachable on foot, but most trips require transportation.
About this community
Facility TypeAl
CountyHoward
Brightview Columbia is legally operated by Brightview Senior Living.
Profit StatusTrue
Private Room
$271 - $295 per day
Apartment
$350 - $393 per day
Hospice Affiliations
Staffing
Key information about the people who lead and staff this community.
No CNA training program
No Alzheimer's certification
Dedicated Alzheimer's Unit
Mild Alzheimer's Level
Moderate Alzheimer's Level
Severe Alzheimer's Level
Chef-Prepared Meals
Vibrant Daily Activities
Food DescriptionResidents enjoy chef-prepared meals with menus designed based on local cuisine and resident interests.
Demographics
Resident demographic information for this facility.
Gender
- Female 67.9%
- Male 32.1%
Age Distribution
- 85-94 39.3%
- 75-84 33.9%
- 65-74 14.3%
- 95+ 12.5%
Ethnicity
- White 92.9%
- African American 7.1%
What does this home offer?
Housing Options: Studio / 1 Bed / 2 Bed
Building Type: Mid-rise
Fitness and Recreation
Over 10 years of experience
Katie A. serves as the Community Executive Director at Brightview Columbia. She joined Brightview over 10 years ago, beginning as a concierge and progressing through several community director roles. Katie now leads the community with extensive experience and a strong commitment to vibrant senior living.
Places of interest near Brightview Columbia
![]() 20.0 miles from city center
20.0 miles from city center
![]() Estimated distance in miles from Columbia's city center to Brightview Columbia's address, calculated via Google Maps.
Estimated distance in miles from Columbia's city center to Brightview Columbia's address, calculated via Google Maps.
Calculate Travel Distance to Brightview Columbia
Add your location
Financial Assistance for
Memory Care in Maryland
Brightview Columbia is located in Columbia, Maryland.
Here are the financial assistance programs available to residents in Maryland.
Compare Memory Care around Columbia
The information below is reported by the Maryland Department of Health, Office of Health Care Quality.
Filter by care type
| Sunrise of Columbia |
AL Assisted Living A licensed, long-term care setting for seniors or individuals with disabilities who need help with daily activities — like bathing, dressing, and medication management — but not 24-hour skilled nursing. Offers housing, meals, and around-the-clock support while aiming to maximize resident independence.
MC Memory Care Secured, specialized care for people living with Alzheimer's or dementia. Staff trained in cognitive impairment, with higher staff-to-resident ratios and an environment designed to reduce confusion and wandering risk. | Columbia (Hickory Ridge) | 96
Facility
96
MD AVG
44
Rank
#143 / 697 | Yes |
53
Facility
53
MD AVG
43
Rank
#393 / 985 | Studio / 1 Bed / 2 Bed | 45
Facility
45
MD AVG
21
Rank
#4 / 208 | A- |
31% Male Residents — State Benchmarked 31% of residents are male, compared to the Maryland average of 31%. This facility caters to a majority female resident pool (69% female), consistent with the broader assisted living trend where women significantly outnumber men. |
69% Female Residents — State Benchmarked 69% of residents are female, compared to the Maryland average of 69%. Women comprise the large majority, consistent with national assisted living demographics where women live longer and enter care facilities at higher rates. |
88% White Residents — State Benchmarked 88% of residents are reported as White, compared to the Maryland average of 81%. Close to the average for this category among assisted living facilities in Maryland with reported race/ethnicity data. |
5% African American Residents — State Benchmarked 5% of residents are reported as African American or Black, compared to the Maryland average of 13%. In line with the Maryland average for African American residents among facilities reporting this breakdown. |
6% Other Ethnicity Residents — State Benchmarked 6% of residents fall into categories other than White or African American (combined), compared to the Maryland average of 6%. This column aggregates Hispanic, Asian, multiracial, and any other labeled groups that are not classified as White or African American. Reported subgroups in this total: Asian (4%), American Indian (1%), Hispanic (1%). |
6% Residents Age 65–74 — State Benchmarked 6% of residents are 65–74, compared to the Maryland average of 13%. Fewer younger seniors suggests the resident population skews older, likely requiring higher acuity care and more hands-on support. |
38% Residents Age 75–84 — State Benchmarked 38% of residents are 75–84, compared to the Maryland average of 31%. A high concentration in this mid-range bracket, where residents typically need moderate support with daily activities. |
36% Residents Age 85–94 — State Benchmarked 36% of residents are 85–94, compared to the Maryland average of 44%. The population here skews younger than the statewide norm, which may indicate a more active, lower-acuity community. |
19% Residents Age 95+ — State Benchmarked 19% of residents are 95 or older, compared to the Maryland average of 16%. In line with the statewide profile for the oldest resident bracket. |
| Brightview Columbia |
MC Memory Care Secured, specialized care for people living with Alzheimer's or dementia. Staff trained in cognitive impairment, with higher staff-to-resident ratios and an environment designed to reduce confusion and wandering risk.
AL Assisted Living A licensed, long-term care setting for seniors or individuals with disabilities who need help with daily activities — like bathing, dressing, and medication management — but not 24-hour skilled nursing. Offers housing, meals, and around-the-clock support while aiming to maximize resident independence.
IL Independent Living Lifestyle-focused communities for older adults offering dining, activities, and transportation with minimal personal care. Best for active, independent seniors who want community without medical support. | Columbia (Martin Road) | 80
Facility
80
MD AVG
44
Rank
#180 / 697 | No |
26
Facility
26
MD AVG
43
Rank
#677 / 985 | Studio / 1 Bed / 2 Bed | 4
Facility
4
MD AVG
21
Rank
#191 / 208 | - |
32% Male Residents — State Benchmarked 32% of residents are male, compared to the Maryland average of 31%. This facility caters to a majority female resident pool (68% female), consistent with the broader assisted living trend where women significantly outnumber men. |
68% Female Residents — State Benchmarked 68% of residents are female, compared to the Maryland average of 69%. Women comprise the large majority, consistent with national assisted living demographics where women live longer and enter care facilities at higher rates. |
93% White Residents — State Benchmarked 93% of residents are reported as White, compared to the Maryland average of 81%. A higher White share than is typical for assisted living in Maryland in this dataset — compare with peer facilities for local context. |
7% African American Residents — State Benchmarked 7% of residents are reported as African American or Black, compared to the Maryland average of 13%. In line with the Maryland average for African American residents among facilities reporting this breakdown. |
0% Other Ethnicity Residents — State Benchmarked 0% of residents fall into categories other than White or African American (combined), compared to the Maryland average of 6%. This column aggregates Hispanic, Asian, multiracial, and any other labeled groups that are not classified as White or African American. |
14% Residents Age 65–74 — State Benchmarked 14% of residents are 65–74, compared to the Maryland average of 13%. In line with the statewide profile for this youngest senior bracket in assisted living. |
34% Residents Age 75–84 — State Benchmarked 34% of residents are 75–84, compared to the Maryland average of 31%. This is the second most common age bracket in assisted living, representing residents with moderate care needs. |
39% Residents Age 85–94 — State Benchmarked 39% of residents are 85–94, compared to the Maryland average of 44%. This is typically the most common age bracket in assisted living — this facility is in line with the statewide norm. |
13% Residents Age 95+ — State Benchmarked 13% of residents are 95 or older, compared to the Maryland average of 16%. In line with the statewide profile for the oldest resident bracket. |
| Charter Senior Living of Columbia |
MC Memory Care Secured, specialized care for people living with Alzheimer's or dementia. Staff trained in cognitive impairment, with higher staff-to-resident ratios and an environment designed to reduce confusion and wandering risk. | Columbia (Long Reach) | 64
Facility
64
MD AVG
44
Rank
#205 / 697 | No |
59
Facility
59
MD AVG
43
Rank
#327 / 985 | Studio / 1 Bed / 2 Bed | 24
Facility
24
MD AVG
21
Rank
#92 / 208 | - |
36% Male Residents — State Benchmarked 36% of residents are male, compared to the Maryland average of 31%. This facility caters to a majority female resident pool (64% female), consistent with the broader assisted living trend where women significantly outnumber men. |
64% Female Residents — State Benchmarked 64% of residents are female, compared to the Maryland average of 69%. Closer to an even gender split than most assisted living facilities, which typically have 65–75% female residents. |
81% White Residents — State Benchmarked 81% of residents are reported as White, compared to the Maryland average of 81%. Close to the average for this category among assisted living facilities in Maryland with reported race/ethnicity data. |
16% African American Residents — State Benchmarked 16% of residents are reported as African American or Black, compared to the Maryland average of 13%. In line with the Maryland average for African American residents among facilities reporting this breakdown. |
3% Other Ethnicity Residents — State Benchmarked 3% of residents fall into categories other than White or African American (combined), compared to the Maryland average of 6%. This column aggregates Hispanic, Asian, multiracial, and any other labeled groups that are not classified as White or African American. Reported subgroups in this total: Asian (2%), Other (2%). |
17% Residents Age 65–74 — State Benchmarked 17% of residents are 65–74, compared to the Maryland average of 13%. A higher share of younger seniors often signals a more independent, active resident community with lower acuity care needs. |
52% Residents Age 75–84 — State Benchmarked 52% of residents are 75–84, compared to the Maryland average of 31%. A high concentration in this mid-range bracket, where residents typically need moderate support with daily activities. |
26% Residents Age 85–94 — State Benchmarked 26% of residents are 85–94, compared to the Maryland average of 44%. The population here skews younger than the statewide norm, which may indicate a more active, lower-acuity community. |
5% Residents Age 95+ — State Benchmarked 5% of residents are 95 or older, compared to the Maryland average of 16%. Most residents here have not yet reached the oldest-old bracket, suggesting a younger overall community. |
Frequently Asked Questions about Brightview Columbia
What neighborhood is Brightview Columbia in?
Brightview Columbia is in the Martin Road neighborhood of Columbia.
Who is the owner of Brightview Columbia?
The legal owner and operator of Brightview Columbia is Brightview Senior Living.
Is Brightview Columbia in a walkable area?
Brightview Columbia has a walk score of 26. Somewhat walkable. A few nearby services may be reachable on foot, but most trips require transportation.
How many beds does Brightview Columbia have?
Brightview Columbia has 80 beds.
Are there photos of Brightview Columbia?
Yes — there are 4 photos of Brightview Columbia in the photo gallery on this page.
What is the phone number of Brightview Columbia?
(410) 290-1600 will put you in contact with the team at Brightview Columbia.
What county is Brightview Columbia located in?
Brightview Columbia is in Howard County.
Guides for Better Senior Living
Care Cost Calculator: See Prices in Your Area
Nursing Home Data Explorer
Don’t Wait Too Long: 7 Red Flag Signs Your Parent Needs Assisted Living Now
The True Cost of Assisted Living in 2025 – And How Families Are Paying For It
Understanding Senior Living Costs: Pricing Models, Discounts & Financial Assistance
Contact Us

Published on
Updated on
Feedback
Write a review for Brightview Columbia
Rate your overall experience with this community
Explore Open Rooms
1
Contact details
2
What type of senior care service are you looking for?
3
What budget do you have in mind for senior care?
4
How soon do you need to find care?
5
Additional details
Thank you for your interest!
Our team will be in touch shortly to help with next steps.
Need Help?
Let us help you or a loved one find the perfect senior home.
