• Home
  • Nursing Home in Florida
Brookdale Palmer Ranch
Nursing Home, Assisted Living, Independent Living & Memory Care · Sarasota, FL
CMS overall rating Info CMS (the Centers for Medicare & Medicaid Services) is the federal agency that rates nursing home quality. Its Overall Rating runs from 1 to 5 stars, combining health inspections, staffing, and quality measures, with inspections weighted most heavily.

Brookdale Palmer Ranch

Nursing Home, Assisted Living, Independent Living & Memory Care · Sarasota, FL
CMS overall rating Info CMS (the Centers for Medicare & Medicaid Services) is the federal agency that rates nursing home quality. Its Overall Rating runs from 1 to 5 stars, combining health inspections, staffing, and quality measures, with inspections weighted most heavily.
Calculator: See prices in your area
Brookdale Palmer Ranch accepts Medicare and private pay.

Overview of Brookdale Palmer Ranch

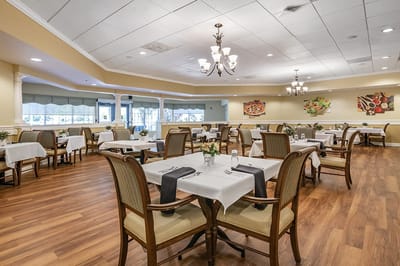
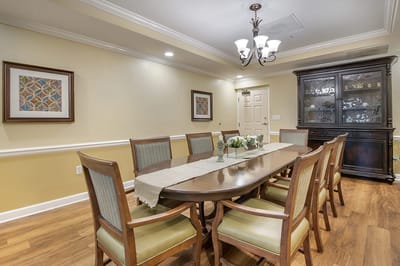
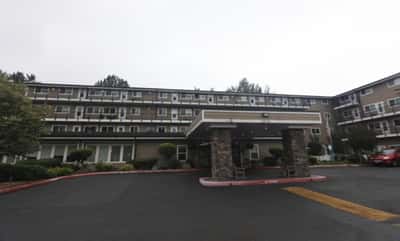
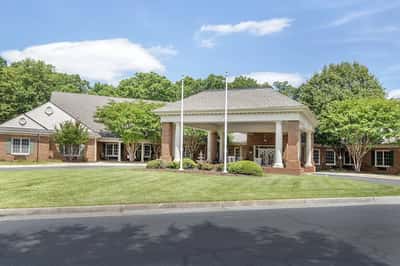
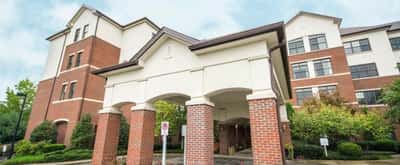
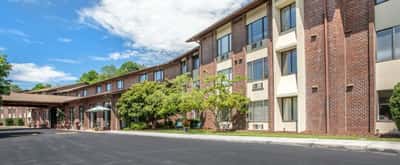
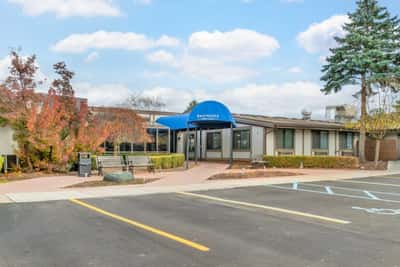
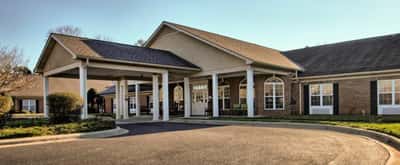
Nestled in Sarasota, Florida, Brookdale Palmer Ranch offers residents the opportunity to live life on their terms with the support they need. The community is centrally located, with the beaches of the Florida Gulf Coast just minutes away and a variety of dining, shopping, and cultural attractions nearby. Brookdale Palmer Ranch’s dining program focuses on providing a restaurant-style experience, with residents involved in menu planning and discussions.

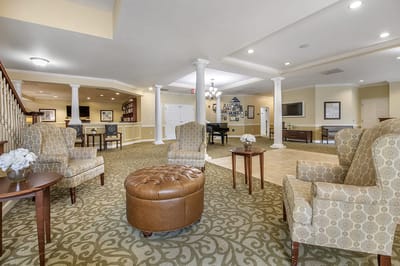
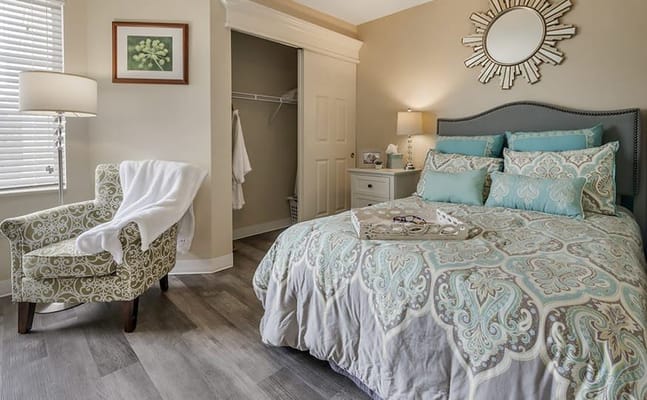
The community offers a range of engaging activities, from dancing and yoga to bingo and happy hour, allowing residents to explore new interests and connect with neighbors. The community features a variety of floor plans, including studio, one-bedroom, and two-bedroom options, all with kitchenettes and pet-friendly accommodations. Brookdale Palmer Ranch provides a continuum of care, with assisted living, skilled nursing, and memory care services available on-site, allowing residents to transition seamlessly as their needs change.

Quality ratings

Measured by Centers for Medicare & Medicaid Services (CMS)

Overall rating Info The Overall CMS Rating combines results from health inspections, staffing levels and quality measures. Health inspections carry the most weight. Staffing and quality scores can increase or decrease the final rating based on performance compared to state and national standards.
Health Inspection Info Based on the results of the facility's three most recent standard inspections and any complaint investigations. CMS reviews the number, scope, and severity of deficiencies, with more recent findings weighted more heavily.
Staffing Info Measures average nursing staff hours per resident per day, including Registered Nurses (RNs) and total nursing staff. Ratings are adjusted based on the level of care residents require and are compared to state and national benchmarks.
Quality Measures Info Based on clinical and physical health indicators reported to CMS, such as hospital readmissions, falls, pressure ulcers, and improvements in mobility. These measures reflect how well residents' health needs are being managed.

Staffing hours breakdown

Info Daily nursing hours per resident by staff type, reported to CMS. Higher is generally better — compare this facility to state and national averages to see where staffing stands.

Hours per resident per day — compared to state averages

Total nursing care / resident Info Total adjusted nursing hours per resident per day, combining RN, LPN, and aide time. CMS adjusts this for case-mix so facilities can be fairly compared.
4h 36m per day
Rank #50 / 253Nurse hours — State benchmarkedThis home is ranked 50th out of 253 homes in Florida. Shows adjusted nurse hours per resident per day benchmarked to the Florida average, with a ranking across 253 Florida facilities. More hours mean more direct care. The national average is about 3.5 hrs; below 3.0 is a red flag.Rankings are based only on facilities in Florida that report data for that category. Facilities without available data are excluded from the ranking.Click the rank badge to see the full State ranking.Click here to see the full State ranking.
vs avg

2 of 6 metrics below state avg

Standout metric Registered Nurse (RN) is +68% above state avg
Staff typeHours / Day / Residentvs state avg
Registered Nurse (RN) Info RNs hold the highest nursing license and can assess residents, interpret test results, and direct care plans. More RN hours per day often signals stronger clinical oversight and faster response to health changes. 1h 14m per day ▲ 68% State avg: 44m per day · National avg: 41m per day
LPN / LVN Info Licensed Practical Nurses (LPNs) or Licensed Vocational Nurses (LVNs) deliver routine hands-on care — medication administration, wound dressing, and monitoring vital signs. They work under RN supervision and make up a large share of daily bedside care. 38m per day ▼ 20% State avg: 47m per day · National avg: 52m per day
Nurse Aide Info Certified Nurse Aides (CNAs) provide the most direct day-to-day assistance: bathing, dressing, feeding, and mobility. Nurse aide hours are typically the largest staffing category and directly affect residents' quality of life. 2h 44m per day ▲ 17% State avg: 2h 20m per day · National avg: 2h 20m per day
Weekend Total Nursing Info Combined nursing hours (RN + LPN + Nurse Aide) per resident per day on weekends. Staffing often drops on weekends — this figure reveals whether the facility maintains adequate coverage outside of weekday hours. 4h 3m per day ▲ 15% State avg: 3h 31m per day · National avg: 3h 26m per day
Physical Therapist Info Hours per resident per day provided by licensed Physical Therapists (PTs) or PT Assistants. PT services help residents recover mobility after injury or illness and are especially important for post-acute (short-stay) rehabilitation. 4m per day ▼ 20% State avg: 5m per day · National avg: 4m per day
Weekend RN Info Registered nurse hours specifically on weekends. Facilities sometimes reduce RN presence on Saturdays and Sundays — a low weekend RN figure compared to weekday hours can indicate reduced clinical oversight when most administrative staff are absent. 44m per day ▲ 38% State avg: 32m per day · National avg: 28m per day

Capacity and availability

Avg. Length of Stay
49 days
Bed community size
118-bed community Rank #337 / 1074Bed count — State benchmarkedThis home is ranked 337th out of 1074 homes in Florida. Shows this facility's certified or reported bed count compared to other Florida facilities. Larger communities may offer more amenities, programs, and on-site services for residents and families.Rankings are based only on facilities in Florida that report data for that category. Facilities without available data are excluded from the ranking.Click the rank badge to see the full State ranking.Click here to see the full State ranking.
A larger shared setting that may offer more common spaces and organized community services.
Years in operation
48 years in operation
A longer operating history, which may indicate experience navigating regulations and delivering ongoing care.
Walk Score
Walk Score: 3 / 100 Rank #1383 / 1486Walk Score — State benchmarkedThis home is ranked 1383rd out of 1486 homes in Florida. Shows how walkable this facility's neighborhood is compared to the average Walk Score across Florida facilities. Higher scores benefit residents, families, and staff.Rankings are based only on facilities in Florida that report data for that category. Facilities without available data are excluded from the ranking.Click the rank badge to see the full State ranking.Click here to see the full State ranking.
Car-dependent. Most errands require a car, with limited nearby walkable options.
BBB Rating
BBB Rating: A+ (Not Accredited)
An independent rating from the Better Business Bureau based on factors such as complaint history, transparency, and business practices.
How BBB ratings work

About this community

Occupancy

Occupancy rate
62%
Rank #243 / 258Occupancy rate — State benchmarkedThis home is ranked 243rd out of 258 homes in Florida. Shows this facility's occupancy rate versus the Florida average, with its Statewide rank out of 258. Higher occupancy signals strong local demand and financial stability.Rankings are based only on facilities in Florida that report data for that category. Facilities without available data are excluded from the ranking.Click the rank badge to see the full State ranking.Click here to see the full State ranking.
Lower than the Florida average: 84.3%
Occupied beds
73 / 118
Average occupied beds in Florida homes 108 beds

License Details

Facility TypeAssisted Living Facility
StatusProvisional
IssuanceDecember 29, 2025
ExpirationDecember 28, 2027
CountySarasota
License Number9737

Ownership & Operating Entity

Brookdale Palmer Ranch is legally operated by PR AL Operations LLC, and administered by Sara Sterling.

Profit StatusFor-profit

Type Of Units

Private
118 units
Total beds
118 units

Staffing

Key information about the people who lead and staff this community.

Languages Spoken

English Spanish

Leadership

ContactMs. Denise Warren, Interim CEO

Additional Services

2 services
Continuing Care Retirement Communities
At Home Care

Amenities & Lifestyle

Pet Friendly
Fitness Center/ Therapy Room
Transportation
Library
Concierge Service
Outings
Café/Bistro
Beauty/Barber Shop
Courtyard And Garden
Gardening/Greenhouse
Game Room
Private Dining Room
Arts & Crafts
Walking Paths
Pool
Theater
Housekeeping
Laundry

Contact Brookdale Palmer Ranch

Inspection History

In Florida, the Agency for Health Care Administration (AHCA) is the primary authority that conducts unannounced inspections and completes official health quality reports for all healthcare facilities.

Since 2017 · 9 years of data 33 citations 26 inspections 7 fines $5.7K fined
Inspection Score Info A composite 0–100 score combining this facility's inspections, citations, complaints, and enforcement actions relative to the Florida state average. The score below shows how many points this facility sits above or below the typical Florida assisted living residence score (the benchmark); higher is better.

4 points below the Florida average for assisted living residences (83/100)

Rank #589 / 876 in Florida Inspection Score — State benchmarked This home is ranked 589th out of 876 homes in Florida. Shows this facility's inspection score compared to the Florida average among 876 comparable communities in the ranking pool. Rankings are based only on facilities in Florida that report data for that category. Facilities without available data are excluded from the ranking. Inspection score: 79 out of 100. Letter grade C+. 4 points below the Florida average for assisted living residences (83/100)

Inspection Scorecard Info This scorecard compares key inspection, citation, and complaint metrics at this facility against the Florida state average. Metrics rated ≥15% worse than average are highlighted in red; those ≥15% better are highlighted in green.

Since 2017 vs. Florida state average
Overall vs. FL average 0 Worse No metrics in this bucket. 4 At Avg Metrics at Florida average:
• Total citations (at FL avg)
• Citations per year (at FL avg)
• Citations per inspection (at FL avg)
• Total inspections (at FL avg)
2 Better Metrics better than Florida average:
• Inspections with citations (6% below)
• Inspection citation rate (6% below)
Latest Inspection October 2, 2025 Complaint

Citations Info Citations are formal regulatory issues recorded during state inspections.

This FacilityFL Averagevs. FL Avg
Total citations Info Formal regulatory issues recorded by inspectors across all inspection types. 3333 This facility has total citations in line with the Florida average (33 vs. FL avg 33).— At avg Rank #514 / 919 Total citations — State benchmarked This home is ranked 514th out of 919 homes in Florida. Shows this facility's total citations compared to the Florida average among 919 comparable communities in the ranking pool. Rankings are based only on facilities in Florida that report data for that category. Facilities without available data are excluded from the ranking.
Citations per year Info Average citations per year since 2017. 3.73.7 This facility has citations per year in line with the Florida average (3.7 vs. FL avg 3.7).— At avg
Citations per inspection Info Average citations per inspection. 1.31.3 This facility has citations per inspection in line with the Florida average (1.3 vs. FL avg 1.3).— At avg Rank #557 / 919 Citations per inspection — State benchmarked This home is ranked 557th out of 919 homes in Florida. Shows this facility's citations per inspection compared to the Florida average among 919 comparable communities in the ranking pool. Rankings are based only on facilities in Florida that report data for that category. Facilities without available data are excluded from the ranking.

Inspections Info State inspections evaluate whether the facility meets health and safety standards.

This FacilityFL Averagevs. FL Avg
Total inspections Info Combined count of all routine and focused inspections. Excludes complaint investigations. 2626 This facility has total inspections in line with the Florida average (26 vs. FL avg 26).— At avg
Inspections with citations Info Inspections that resulted in at least one regulatory citation. 1516 This facility has 6% fewer inspections with citations than a typical Florida assisted living residence (15 vs. FL avg 16).↓ 6% better
Inspection citation rate Info Percentage of inspections that resulted in at least one citation. 58%62% This facility has 4 percentage points lower inspection citation rate than a typical Florida assisted living residence (58% vs. FL avg 62%).↓ 4% better Rank #491 / 919 Inspection citation rate — State benchmarked This home is ranked 491st out of 919 homes in Florida. Shows this facility's % of inspections with citations compared to the Florida average among 919 comparable communities in the ranking pool. Rankings are based only on facilities in Florida that report data for that category. Facilities without available data are excluded from the ranking.

Inspection Reports Summary Info An editor-reviewed summary of the themes and findings across this facility's recent inspection reports.

  • July 31, 2025 complaint inspection found 2 deficiencies related to admissions and resident care, including elopement standards.
  • January 23, 2024 annual inspection cited 2 deficiencies in risk management, quality assurance, and background screening.
  • October 2, 2025 complaint inspection reported no deficiencies and no substantiated complaints.

Health Inspection History

Inspections since 2021
Total health inspections 5

State average N/A


Last Health inspection on Jul 2025

Total health citations
24 Rank #172 / 252Health citations — State benchmarkedThis home is ranked 172nd out of 252 homes in Florida. Shows this facility's total health deficiency citations benchmarked to the Florida State average, with a ranking across all 252 FL facilities. Lower citation counts earn a better rank.Rankings are based only on facilities in Florida that report data for that category. Facilities without available data are excluded from the ranking.Click the rank badge to see the full State ranking.Click here to see the full State ranking.

State average N/A

Citations per inspection
4.8 Rank #158 / 252Citations per inspection — State benchmarkedThis home is ranked 158th out of 252 homes in Florida. Shows average deficiency citations per CMS inspection for this facility versus the Florida mean across 252 facilities with citation data. Lower is better.Rankings are based only on facilities in Florida that report data for that category. Facilities without available data are excluded from the ranking.Click the rank badge to see the full State ranking.Click here to see the full State ranking.

State average N/A


Health citations are formal notices following inspections when they fail to comply with safety and care standards.

7 of 24 citations resulted from standard inspections; 10 of 24 resulted from complaint investigations; and 7 of 24 came from combined inspections (standard and complaint).

Breakdown of citation severity (last 5 years)
Critical health citations
4
In line with State average

State average: N/A


Serious health citations
2
In line with State average

State average: N/A

4 critical citations State average: N/A

2 serious citations State average: N/A

18 moderate citations State average: N/A

0 minor citations State average: N/A
Citations history (last 5 years)
Abuse/Neglect moderate citation Jul 21, 2025
Corrected

Abuse/Neglect serious citation Mar 19, 2025
Corrected

Pharmacy serious citation Mar 19, 2025
Corrected

Quality of Care moderate citation Mar 19, 2025
Corrected

Staffing Data

Reporting period: October 1 – December 31, 2025 (Q4 2025). Source: CMS Payroll-Based Journal report.

Total staff 151
Employees 71
Contractors 80
Staff to resident ratio 3.68 : 1
0% compared with State average

State average ratio: 0 : 0

Avg staff/day 31
Average shift 7.7 hours
0% compared with State average

State average: 0 hours

Total staff hours (quarter) 22,001

Nursing staff breakdown

Q4 2025 · Oct 1 – Dec 31 More info This data comes from the CMS Payroll-Based Journal report covering October 1 – December 31, 2025.
Registered Nurse

Manages medical care and health needs.

RN Staff Info 14 total: 12 full-time employees and 2 contractors. 14
Average shift length Info Average shift length. Calculated as total hours divided by days worked and average staff per day. 9.8 hours
Licensed Practical Nurse

Assists with medical care and medications.

LPN Staff Info 22 total: 7 full-time employees and 15 contractors. 22
Average shift length Info Average shift length. Calculated as total hours divided by days worked and average staff per day. 9.2 hours
Certified Nursing Assistant

Helps with daily care and mobility.

CNA Staff Info 70 total: 38 full-time employees and 32 contractors. 70
Average shift length Info Average shift length. Calculated as total hours divided by days worked and average staff per day. 7.7 hours

Contractor staffing

Q4 2025 · Oct 1 – Dec 31 More info This data comes from the CMS Payroll-Based Journal report covering October 1 – December 31, 2025.

Total hours from contractors

19.5%

4,287 contractor hours this quarter

Certified Nursing Assistant: 32 Licensed Practical Nurse: 15 Physical Therapy Aide: 9 Speech Language Pathologist: 6 Qualified Social Worker: 5 Respiratory Therapy Technician: 4 Physical Therapy Assistant: 3 Occupational Therapy Assistant: 3 Registered Nurse: 2 Medical Director: 1

Staff by category

Q4 2025 · Oct 1 – Dec 31 More info This data comes from the CMS Payroll-Based Journal report covering October 1 – December 31, 2025.
Certified Nursing Assistant38327011,23392100%7.7
Registered Nurse122143,6089199%9.8
Licensed Practical Nurse715222,5869199%9.2
Clinical Nurse Specialist3039546571%7.9
Administrator2029516470%8.1
Physical Therapy Aide0996997683%5.3
Nurse Practitioner1015166470%8.1
Physical Therapy Assistant0334586672%6.1
Speech Language Pathologist0664507076%5.5
Respiratory Therapy Technician0442766571%4.2
Qualified Social Worker055723235%2.2
Other Dietary Services Staff4047155%7.1
Dietitian2024833%8
Medical Director011321820%1.8
Nurse Aide in Training1012433%7.8
Occupational Therapy Assistant033223033%0.7
Mental Health Service Worker101344%0.8
70 Certified Nursing Assistant
% of Days 100%
14 Registered Nurse
% of Days 99%
22 Licensed Practical Nurse
% of Days 99%
3 Clinical Nurse Specialist
% of Days 71%
2 Administrator
% of Days 70%
9 Physical Therapy Aide
% of Days 83%
1 Nurse Practitioner
% of Days 70%
3 Physical Therapy Assistant
% of Days 72%
6 Speech Language Pathologist
% of Days 76%
4 Respiratory Therapy Technician
% of Days 71%
5 Qualified Social Worker
% of Days 35%
4 Other Dietary Services Staff
% of Days 5%
2 Dietitian
% of Days 3%
1 Medical Director
% of Days 20%
1 Nurse Aide in Training
% of Days 3%
3 Occupational Therapy Assistant
% of Days 33%
1 Mental Health Service Worker
% of Days 4%

Penalties and fines

Includes penalties issued in 2025

Federal penalties imposed by CMS for regulatory violations, including civil money penalties (fines) and denials of payment for new Medicare/Medicaid admissions.

Source: CMS Penalties Database (Data as of Jan 2026)

Total fines amount $260K Rank #222 / 258Federal fines — State benchmarkedThis home is ranked 222nd out of 258 homes in Florida. Shows this facility's cumulative CMS federal fine dollars versus the Florida average among facilities with fines, and where it ranks among 258 facilities in the pool. Lower total dollars mean a better rank.Rankings are based only on facilities in Florida that report data for that category. Facilities without available data are excluded from the ranking.Click the rank badge to see the full State ranking.Click here to see the full State ranking.
260% higher than State average

State average: $72K

Number of fines 5
90% more fines than State average

State average: 2.6

Payment Denials Info Serious action where Medicare and/or Medicaid temporarily stops payments for new residents until issues are fixed. 1
1212% more payment denials than State average

State average: 0.1

Fines amount comparison
This facility $260K
State average $72K
Penalty History

Penalties are imposed by CMS for violations of federal nursing home regulations.

1 penalty in the past 3 years

Mar 19, 2025 · $60K

Civil Money Penalty Info Fines imposed for noncompliance, which can be assessed per day or per instance of violation. Mar 19, 2025
$60K

Last updated: Jan 2026

Quality of care over time

These measures show how residents usually do over time at this home, based on health outcomes and preventive care.

High-risk clinical events score Info A composite score based on pressure ulcers, falls with injury, weight loss, walking ability decline, and activities of daily living decline. 9.5
28% worse than State average

State average: 7.4

Functional decline score Info A composite score based on activities of daily living decline, walking ability decline, and incontinence. 18.1
46% worse than State average

State average: 12.4

Long-stay resident measures
Average State avg: 4.5 Info CMS star rating based on long-stay quality measure performance. 5 stars = significantly above average, 1 star = significantly below average.
Need for Help with Daily Activities Increased Info Percent of long-stay residents whose need for help with daily activities has increased 12.5%
19% worse than State average

State average: 10.5%

Walking Ability Worsened Info Percent of long-stay residents whose ability to move independently worsened 19.7%
52% worse than State average

State average: 12.9%

Low Risk Residents with Bowel/Bladder Incontinence Info Percent of low risk long-stay residents who lose control of their bowels or bladder 22.0%
62% worse than State average

State average: 13.5%

Falls with Major Injury Info Percent of long-stay residents experiencing one or more falls with major injury 2.5%
7% better than State average

State average: 2.6%

High Risk Residents with Pressure Ulcers Info Percent of long-stay high risk residents with pressure ulcers 5.6%
In line with State average

State average: 5.4%

Urinary Tract Infection Info Percent of long-stay residents with a urinary tract infection 0.9%
In line with State average

State average: 0.9%

Lost Too Much Weight Info Percent of long-stay residents who lose too much weight 7.3%
22% worse than State average

State average: 6.0%

Depressive Symptoms Info Percent of long-stay residents who have depressive symptoms 5.2%
54% worse than State average

State average: 3.3%

Antipsychotic Use Info Percent of long-stay residents who received an antipsychotic medication 3.5%
56% better than State average

State average: 8.0%

Pneumococcal Vaccine Info Percent of long-stay residents assessed and appropriately given the pneumococcal vaccine 100.0%
In line with State average

State average: 97.7%

Influenza Vaccine Info Percent of long-stay residents assessed and appropriately given the seasonal influenza vaccine 100.0%
In line with State average

State average: 99.2%

Hospitalizations per 1,000 days Info Number of hospitalizations per 1,000 long-stay resident days. 3.03
44% worse than State average

State average: 2.10

ED visits per 1,000 days Info Number of outpatient emergency department visits per 1,000 long-stay resident days. 2.14
81% worse than State average

State average: 1.18

Short-stay resident measures
Above average State avg: 3.1 Info CMS star rating based on short-stay quality measure performance. 5 stars = much above average, 1 star = much below average.
Pneumococcal Vaccine Info Percent of short-stay residents assessed and appropriately given the pneumococcal vaccine 97.8%
In line with State average

State average: 94.0%

Antipsychotic medication increase Info Percent of short-stay residents who newly received an antipsychotic medication 0.3%
77% better than State average

State average: 1.5%

Influenza Vaccine Info Percent of short-stay residents assessed and appropriately given the seasonal influenza vaccine 96.6%
In line with State average

State average: 94.7%

Re-hospitalized after SNF stay Info Percentage of short-stay residents who were re-hospitalized after their nursing home admission. 24.7%
6% better than State average

State average: 26.2%

Emergency department visits Info Percentage of short-stay residents who had an outpatient emergency department visit. 11.2%
20% worse than State average

State average: 9.3%

Falls with major injury Info Percentage of SNF residents who experience falls with major injury during their stay. 1.9%
149% worse than State average

State average: 0.8%

Ability to care for self at discharge Info Percentage of residents at or above expected ability to care for themselves at discharge. 40.0%
25% worse than State average

State average: 53.7%

Successful return to home or community Info Rate of successful return to home or community from a skilled nursing facility. 63.8%
26% better than State average

State average: 50.6%

Breakdown by payment type

Medicare

31% of new residents, usually for short-term rehab.

Typical stay 1 - 2 months

Private pay

69% of new residents, often for short stays.

Typical stay 4 - 5 months

Facility Characteristics

Source: CMS Long-Term Care Facility Characteristics (Data as of Jan 2026)

Total residents 41
Medicare
12
29.3% of residents
Medicaid
20
48.8% of residents
Private pay or other
9
22% of residents
Programs & Services
Residents Group

Residents meet regularly to discuss policies, care quality, and activities

CCRC

Part of a Continuing Care Retirement Community offering multiple care levels

Active Resident Council

Organized group of residents that meets regularly to discuss facility policies, quality of life, and activities.

Finances and operations

Based on CMS SNF Cost Report for fiscal year ending in 12/2023.

For-profit
Operated by a single business entity.
Net patient revenue Info Net patient revenue — what the home actually collects for resident care, after contractual allowances, bad debt and discounts are subtracted from its gross charges (CMS cost report, Worksheet G-3). It covers resident care only; money the home earns from other sources is shown separately as "Other income."
$11.4M
Net patient income Info Net patient income: net patient revenue minus the home's total operating expenses. A positive figure means it earns more from resident care than it spends to deliver it; a negative figure means the opposite. It excludes non-operating "other income."
-$2.2M
For-profit Operated by a single business entity.
Net patient revenue Info Net patient revenue — what the home actually collects for resident care, after contractual allowances, bad debt and discounts are subtracted from its gross charges (CMS cost report, Worksheet G-3). It covers resident care only; money the home earns from other sources is shown separately as "Other income."
$11.4M Rank #222 / 257Revenue — State benchmarkedThis home is ranked 222nd out of 257 homes in Florida. Shows this facility's annual revenue compared to the Florida average. Higher revenue generally means more resources for staffing and capital — read alongside Payroll %.Rankings are based only on facilities in Florida that report data for that category. Facilities without available data are excluded from the ranking.Click the rank badge to see the full State ranking.Click here to see the full State ranking.
Net patient income Info Net patient income: net patient revenue minus the home's total operating expenses. A positive figure means it earns more from resident care than it spends to deliver it; a negative figure means the opposite. It excludes non-operating "other income."
-$2.2M
Other income Info Money the home earns outside of resident care — such as investments, grants, rentals and other non-operating sources (CMS cost report, Worksheet G-3). It is tracked separately from net patient revenue: it is not part of that figure, and it is not included in net patient income.
$33.5K
Payroll costs Info Staff salaries plus wage-related costs — benefits such as payroll taxes, health insurance and retirement — from the home's own accounting records (CMS cost report, Worksheet A). Contract or agency labor is counted separately, under other operating costs. Rank #148 / 257Payroll — State benchmarkedThis home is ranked 148th out of 257 homes in Florida. Shows total annual staff payroll benchmarked to the Florida average. Higher payroll investment relative to peers often signals better staffing and less reliance on cheaper contract labor.Rankings are based only on facilities in Florida that report data for that category. Facilities without available data are excluded from the ranking.Click the rank badge to see the full State ranking.Click here to see the full State ranking.
$7.4M 65.3% of net patient revenue Info Payroll as a share of revenue: staff salaries and wage-related benefits divided by net patient revenue. A higher figure means more of each revenue dollar goes to staff pay. Rank #3 / 257Payroll % — State benchmarkedThis home is ranked 3rd out of 257 homes in Florida. Shows payroll as a percentage of revenue versus the Florida average. Well-run Florida facilities typically land around 49–56% — the top third Statewide. Below 25% may signal understaffing or heavy agency use — read with Staffing ratings.Rankings are based only on facilities in Florida that report data for that category. Facilities without available data are excluded from the ranking.Click the rank badge to see the full State ranking.Click here to see the full State ranking.
Other operating costs Info Everything it costs to run the home apart from payroll — food, utilities, supplies, maintenance, contract labor and administration. Calculated as total operating expense minus payroll (staff salaries and wage-related benefits).
$6.1M
Total costs Info The home's total operating expense for the year — all the costs of running it, salaries included (CMS cost report, Worksheet G-3).
$13.5M

What does this home offer?

Pets allowed icon
Pets allowed icon

Pets Allowed

Housing options icon

Housing Options: Studio / 1 Bed / 2 Bed

Building type icon
Building type icon

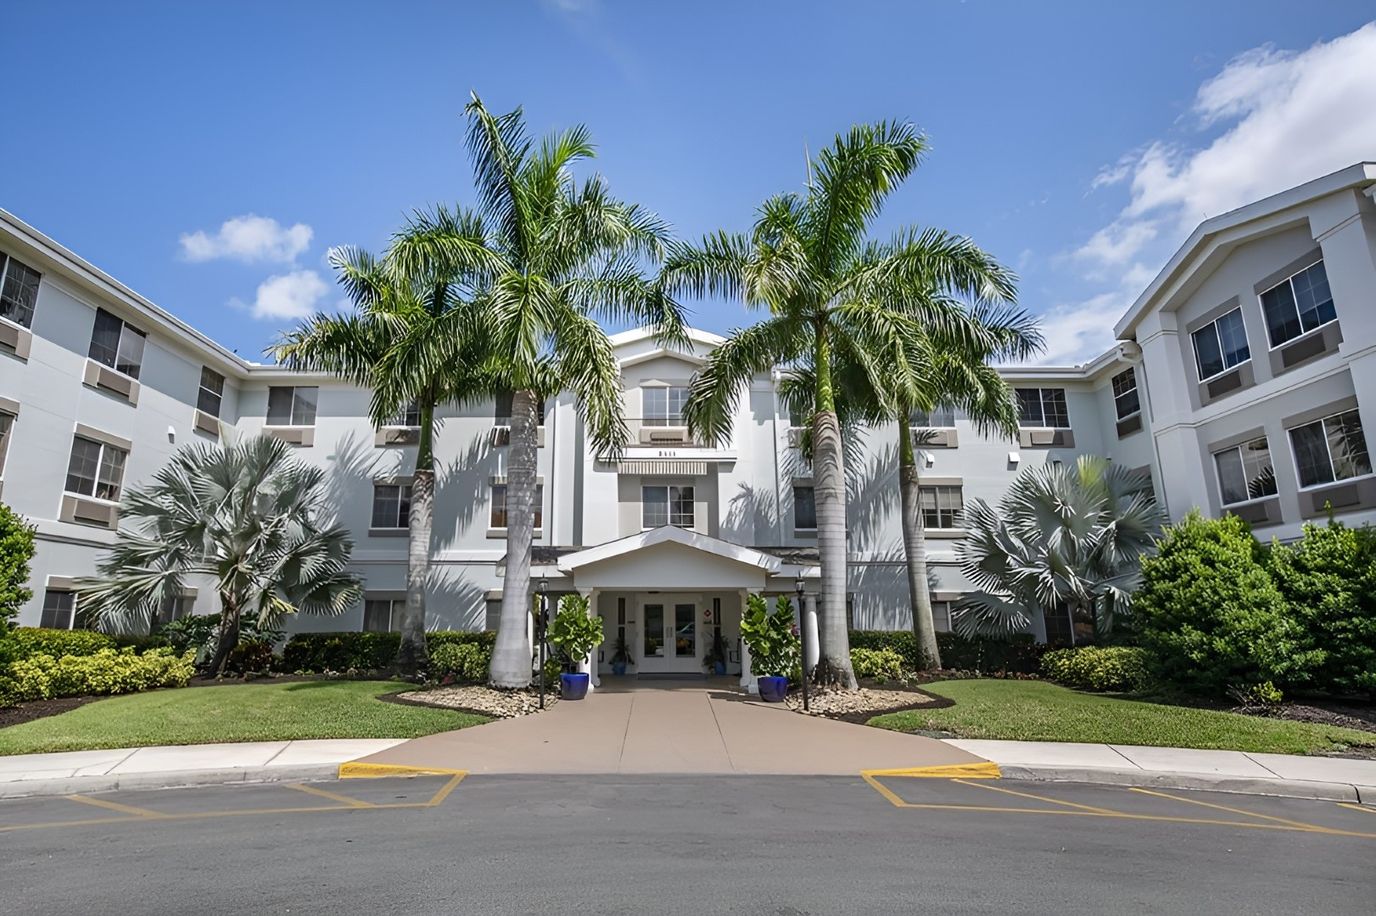
Building Type: 3-story

Fitness and recreation icon

Fitness and Recreation

Type of Rooms Available

1 Bed
1 Bed
1
440 - 610 sq. ft

Who this home usually serves

TYPE OF STAY

Primarily short stays

Residents typically stay for brief periods, with frequent admissions and discharges throughout the year.

Most new residents arrive under private pay (69% of admissions), and a typical private pay stay runs around 4 - 5 months.

Admissions
355 total

Coverage residents most often arrive under.

Medicare 31%
Private pay 69%
Discharges
427 total

Coverage residents most often leave under.

Medicare 38%
Private pay 62%

Activities in this home

Places of interest near Brookdale Palmer Ranch

Address 7.3 miles from city center Info Estimated distance in miles from Sarasota's city center to Brookdale Palmer Ranch's address, calculated via Google Maps.

Calculate Travel Distance to Brookdale Palmer Ranch

Add your location

Address

Compare Nursing Homes around the area

The information below is reported by the Florida Agency for Health Care Administration (AHCA).

Brookdale Palmer Ranch
NH
AL
IL
MC
Sarasota (Bee Ridge) -118 A+ 3 Studio / 1 Bed / 2 Bed
Terracina Grand
NH
AL
IL
MC
RC
Naples -200 A+ 12 Studio / 1 Bed / 2 Bed
Brookdale DeLand
NH
AL
MC
Deland (Scarlett) -89 A+ 14 Studio / Suite
The Oaks of Clearwater
NH
AL
IL
MC
Clearwater (Oak Bluffs) -175 B- 64 Studio / 1 Bed / 2 Bed
The Bridge at Ocala
NH
AL
Ocala -95 A+ 44 Studio / 1 Bed

Frequently Asked Questions about Brookdale Palmer Ranch

What neighborhood is Brookdale Palmer Ranch in?

Brookdale Palmer Ranch is in the Bee Ridge neighborhood of Sarasota.

What languages are spoken at Brookdale Palmer Ranch?

The team at Brookdale Palmer Ranch speaks English and Spanish.

Who is the owner of Brookdale Palmer Ranch?

Brookdale Palmer Ranch is legally operated by PR AL Operations LLC, and administered by Sara Sterling.

Is Brookdale Palmer Ranch in a walkable area?

Brookdale Palmer Ranch has a walk score of 3. Car-dependent. Most errands require a car, with limited nearby walkable options.

What is the license number of Brookdale Palmer Ranch?

According to FL state health department records, Brookdale Palmer Ranch's license number is 9737.

When does Brookdale Palmer Ranch's license expire?

According to FL state health department records, Brookdale Palmer Ranch's license expires on December 28, 2027.

What is the occupancy rate at Brookdale Palmer Ranch?

Brookdale Palmer Ranch's occupancy is 62%.

Guides for Better Senior Living

Care Cost Calculator: See Prices in Your Area

Nursing Home Data Explorer

Don’t Wait Too Long: 7 Red Flag Signs Your Parent Needs Assisted Living Now

The True Cost of Assisted Living in 2025 – And How Families Are Paying For It

Understanding Senior Living Costs: Pricing Models, Discounts & Financial Assistance