

Occupancy rate
62%

We arrange tours, appointments, and even moving support so you don’t have to

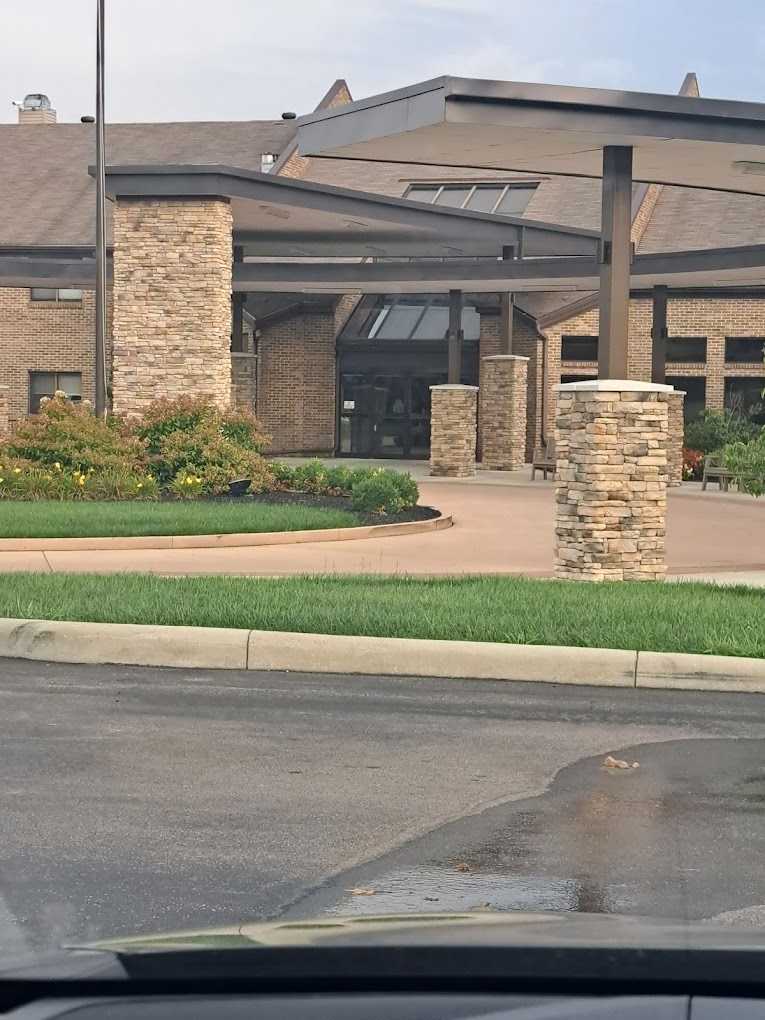
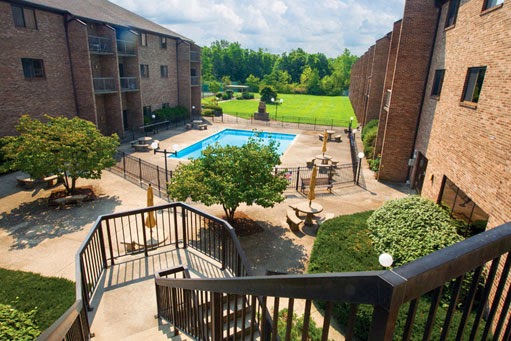


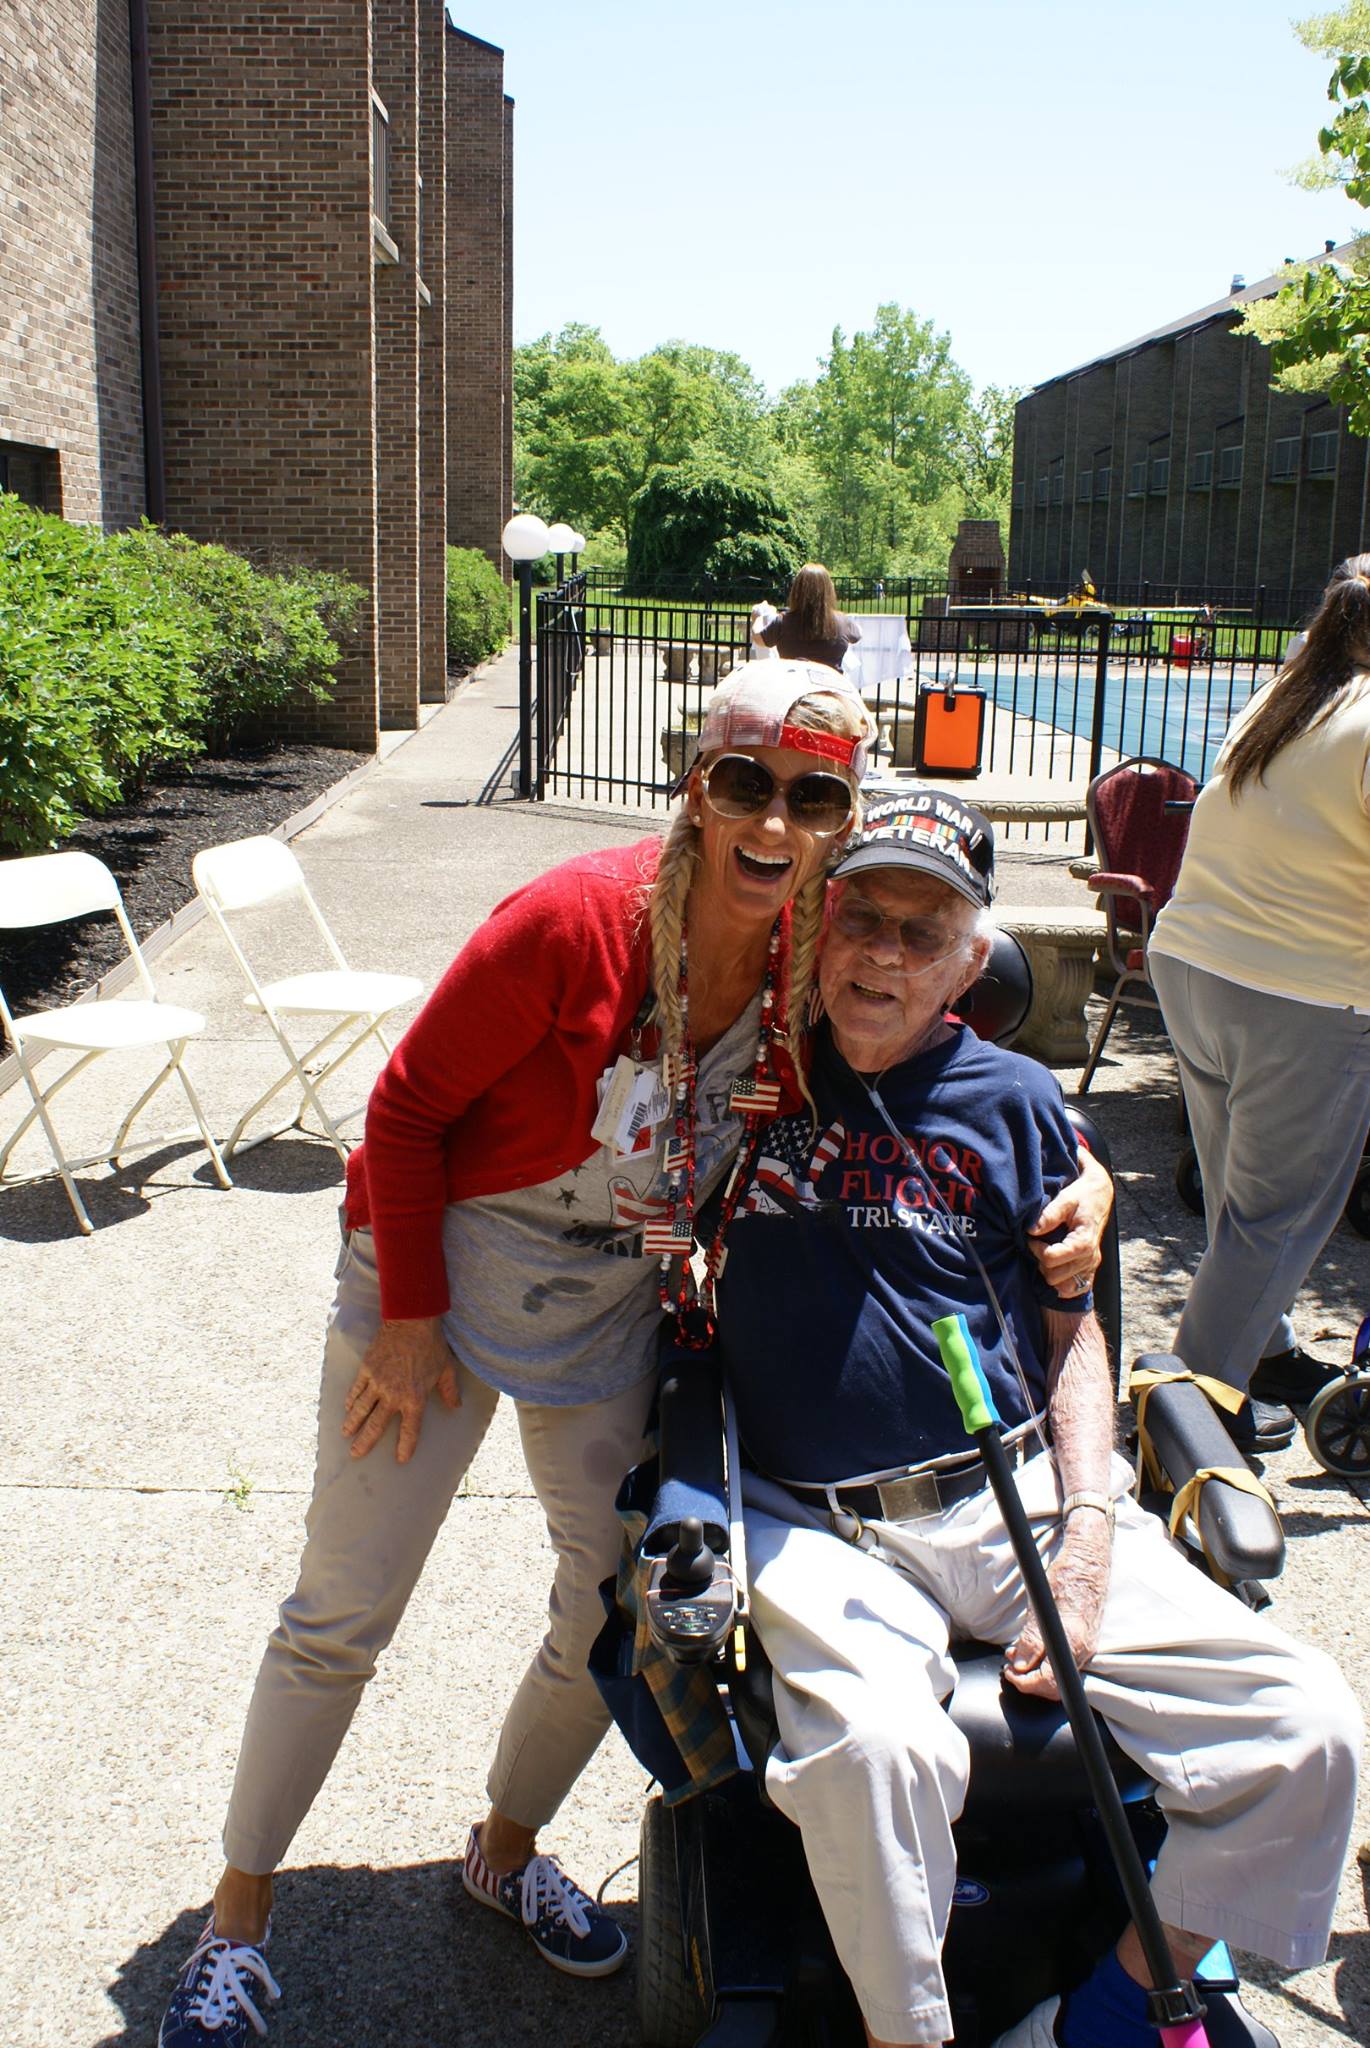
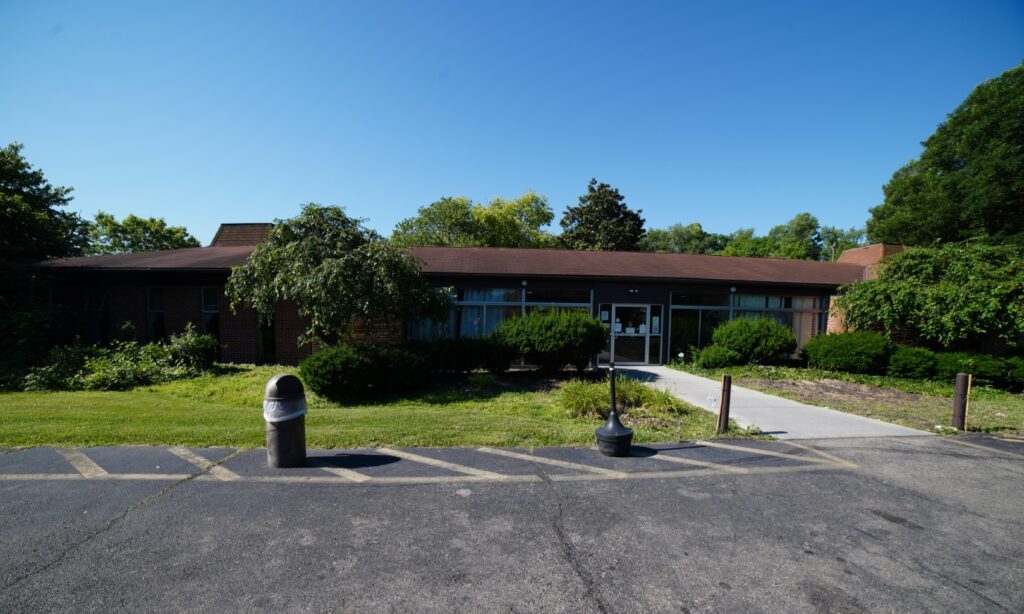
Explore senior living at its finest at Brookwood Retirement Community in Cincinnati, OH, where residents enjoy a wide range of services, including skilled rehabilitation, memory care, respite care, independent living, assisted living, and long-term care. This spacious, state-of-the-art community prioritizes comfort and convenience, with thoughtfully designed and tastefully decorated rooms that easily transition between independent and assisted living.
As an award-winning healthcare community, Brookwood Retirement Community offers an array of engaging activities and services, including stretching and strengthening classes, daily coffee and newsgroups, history and book clubs, chair volleyball, and field trips to local attractions. The community also provides a comprehensive range of therapeutic services, ensuring that each resident receives the support they need to thrive. With experienced and compassionate staff providing one-on-one care and social services, seniors can truly enjoy a worry-free retirement.
 Official CMS rating based on health inspections, staffing and quality measures.
Official CMS rating based on deficiencies found during state health inspections.
Official CMS rating based on nurse staffing hours per resident per day.
Official CMS rating based on clinical outcomes for residents.
Average daily nursing hours per resident (adjusted for acuity). Higher values indicate more nursing time per resident.
Hours of care per resident per day, broken down by staff type. Data from CMS Medicare.
Registered nurse hours per resident per day.
Official CMS rating based on health inspections, staffing and quality measures.
Official CMS rating based on deficiencies found during state health inspections.
Official CMS rating based on nurse staffing hours per resident per day.
Official CMS rating based on clinical outcomes for residents.
Average daily nursing hours per resident (adjusted for acuity). Higher values indicate more nursing time per resident.
Hours of care per resident per day, broken down by staff type. Data from CMS Medicare.
Registered nurse hours per resident per day.
Offers a balance of services and community atmosphere.
Lower occupancy suggests more openings may be available.
Residents typically stay for brief periods, with frequent admissions and discharges throughout the year.
19% of new residents, usually for short-term rehab.
78% of new residents, often for short stays.
3% of new residents, often for long-term daily care.
The portion of the home's budget spent on staff, including nurses, caregivers, and other employees who support care and operations.
All remaining costs needed to run the home, such as food, utilities, building maintenance, supplies and administrative expenses.
Key information about the people who lead and staff this community.
Building Type: 3-story
Ways to qualify for care at this community, including accepted programs and payment options.
In Ohio, the Department of Health, Bureau of Survey and Certification conducts unannounced onsite inspections to evaluate the quality of care and environment in all licensed facilities.
Every two years, the Ohio Department of Aging and the Office of the State Long-Term Care Ombudsman organizations conduct a satisfaction survey among residents in long-term care facilities to assess their quality of care and life.
Ohio average: 80 / 100
Ohio average: 73 / 100
Ohio average: 95 / 100
Ohio average: 91 / 100
Ohio average: 86 / 100
Ohio average: 77 / 100
Ohio average: 72 / 100
Ohio average: 65 / 100
Based on the RCF Resident Satisfaction Survey 2022-23, Final Results
Scores represent percent of positive resident responses for each item, excluding "don't know" and "not applicable" responses and instances where the question was skipped.
Based on the RCF Resident Satisfaction Survey 2022-23, Final Results
Scores represent percent of positive resident responses for each item, excluding "don't know" and "not applicable" responses and instances where the question was skipped.
Based on the RCF Resident Satisfaction Survey 2022-23, Final Results
Scores represent percent of positive resident responses for each item, excluding "don't know" and "not applicable" responses and instances where the question was skipped.
Based on the RCF Resident Satisfaction Survey 2022-23, Final Results
Scores represent percent of positive resident responses for each item, excluding "don't know" and "not applicable" responses and instances where the question was skipped.
Based on the RCF Resident Satisfaction Survey 2022-23, Final Results
Scores represent percent of positive resident responses for each item, excluding "don't know" and "not applicable" responses and instances where the question was skipped.
Based on the RCF Resident Satisfaction Survey 2022-23, Final Results
Scores represent percent of positive resident responses for each item, excluding "don't know" and "not applicable" responses and instances where the question was skipped.
Based on the RCF Resident Satisfaction Survey 2022-23, Final Results
Scores represent percent of positive resident responses for each item, excluding "don't know" and "not applicable" responses and instances where the question was skipped.
The Scripps Gerontology Center at Miami University conducts a satisfaction survey among residents' family members, friends and guardians to assess quality of care and life.
Ohio average: 77 / 100
Ohio average: 80 / 100
Ohio average: 78 / 100
Ohio average: 85 / 100
Ohio average: 78 / 100
Ohio average: 78 / 100
Ohio average: 68 / 100
Ohio average: 67 / 100
Profile of respondents of this survey
100=Definitely Yes, 67=Probably Yes, 33=Probably No, 0=Definitely No
Does this living arrangement help the resident maintain their independence?:
This facility84/100
Ohio average84/100
Do you have enough opportunities for input into decisions about your resident’s care?:
This facility56/100
Ohio average78/100
Do you get enough information to make decisions with or about your resident?:
This facility57/100
Ohio average77/100
Scores represent percent of positive responses for each item based on the latest Family Satisfaction Survey results
100=Definitely Yes, 67=Probably Yes, 33=Probably No, 0=Definitely No
Is the residential care facility thoroughly clean?:
This facility73/100
Ohio average83/100
Can the resident get outside often enough?:
This facility81/100
Ohio average74/100
Are the resident’s belongings safe?:
This facility80/100
Ohio average79/100
Scores represent percent of positive responses for each item based on the latest Family Satisfaction Survey results
100=Definitely Yes, 67=Probably Yes, 33=Probably No, 0=Definitely No
When the resident moved in, were you given thorough information to help you know
This facility—/100
Ohio average—/100
what to expect?:
This facility77/100
Ohio average85/100
Was the resident given a thorough orientation to residential care?:
This facility76/100
Ohio average80/100
Did you feel warmly welcomed as a new family member?:
This facility81/100
Ohio average90/100
Scores represent percent of positive responses for each item based on the latest Family Satisfaction Survey results
100=Definitely Yes, 67=Probably Yes, 33=Probably No, 0=Definitely No
Are you encouraged to speak up when you have a problem?:
This facility72/100
Ohio average83/100
Are your concerns addressed in a timely way?:
This facility68/100
Ohio average78/100
Are you kept well informed about how things are going with your resident?:
This facility58/100
Ohio average76/100
Do the staff seem happy to work at the residential care facility?:
This facility67/100
Ohio average77/100
Do the staff go above and beyond to give your resident a good life?:
This facility62/100
Ohio average76/100
Do you feel confident that staff would help your resident beyond their personal care
This facility—/100
Ohio average—/100
needs if you could not (eg, paperwork, purchasing clothing)?:
This facility49/100
Ohio average69/100
Do you have peace of mind about the care your resident is getting when you aren’t at
This facility—/100
Ohio average—/100
the residential care facility?:
This facility75/100
Ohio average82/100
Would you highly recommend this residential care facility to a family member or friend?:
This facility65/100
Ohio average79/100
Scores represent percent of positive responses for each item based on the latest Family Satisfaction Survey results
100=Definitely Yes, 67=Probably Yes, 33=Probably No, 0=Definitely No
Do you feel confident the staff is knowledgeable about the resident’s medical
This facility—/100
Ohio average—/100
condition(s) and treatment(s)?:
This facility61/100
Ohio average79/100
Do the staff know what the resident likes and doesn’t like?:
This facility62/100
Ohio average79/100
Do the staff regularly check to see if the resident needs anything?:
This facility59/100
Ohio average77/100
Have you gotten to know the staff who care for your resident?:
This facility60/100
Ohio average78/100
Do the staff encourage your resident to be as independent as they are able to be?:
This facility82/100
Ohio average82/100
Do you feel confident staff would come quickly anytime your resident needed help?:
This facility62/100
Ohio average77/100
Scores represent percent of positive responses for each item based on the latest Family Satisfaction Survey results
100=Definitely Yes, 67=Probably Yes, 33=Probably No, 0=Definitely No
Does the resident have something enjoyable to look forward to most days?:
This facility65/100
Ohio average71/100
Do the staff do a good job keeping the resident connected to the community?:
This facility65/100
Ohio average72/100
Does the resident have plenty of opportunities to do things that are meaningful to them?:
This facility65/100
Ohio average71/100
Does the residential care facility have enough opportunities for your resident to go on
This facility—/100
Ohio average—/100
special outings and events?:
This facility71/100
Ohio average63/100
Does the resident like the provided activities?:
This facility60/100
Ohio average69/100
Does the residential care facility provide things the resident enjoys doing on the
This facility—/100
Ohio average—/100
weekend?:
This facility49/100
Ohio average56/100
Do you have plenty of opportunities to be involved in the residential care facility?:
This facility63/100
Ohio average72/100
Scores represent percent of positive responses for each item based on the latest Family Satisfaction Survey results
100=Definitely Yes, 67=Probably Yes, 33=Probably No, 0=Definitely No
Is there a lot of variety in the meals?:
This facility63/100
Ohio average70/100
Are you included in mealtimes if you want to be?:
This facility62/100
Ohio average65/100
Is the food good?:
This facility63/100
Ohio average68/100
Scores represent percent of positive responses for each item based on the latest Family Satisfaction Survey results
Ohio average 6.7
Last Health inspection on Nov 2024
Health citations are formal notices following inspections when they fail to comply with safety and care standards.
33 of 37 citations resulted from standard inspections; and 4 of 37 resulted from complaint investigations.
Ohio average: 0.3
Ohio average: 0.9
Data sourced from CMS Health Deficiencies reports. Citation severity codes range from A (least serious) to L (most serious). Immediate Jeopardy (J-L) citations indicate situations where the facility's noncompliance has placed residents at risk of death or serious harm.
Assisted Living For seniors needing help with daily tasks but not full-time nursing.
Independent Living For self-sufficient seniors seeking community and minimal assistance.
Memory Care Specialized care for those with Memory Loss, Alzheimer's, or dementia, ensuring safety and support.
Nursing Homes 24/7 care needed
Nursing Home 24/7 care needed
Assisted Living For seniors needing help with daily tasks but not full-time nursing.
Nursing Homes 24/7 care needed
 Bridgetown Nursing and Rehabilitation
 Brookwood Retirement Community
 Hillebrand Nursing and Rehabilitation Center
 Harmony Court Rehab and Nursing
![]() 18.9 miles from city center — 3.17 miles to nearest hospital (TriHealth Bethesda North Hospital)
18.9 miles from city center — 3.17 miles to nearest hospital (TriHealth Bethesda North Hospital)
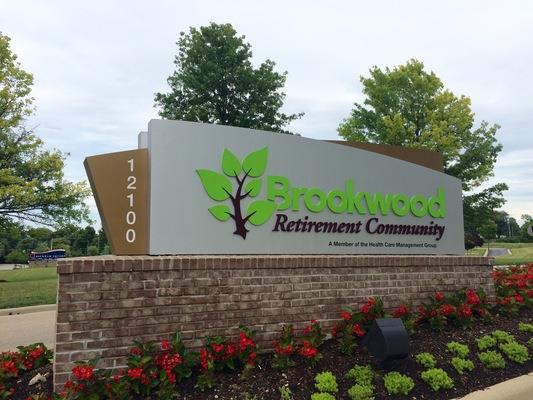
![]() 12100 Reed Hartman Hwy, Cincinnati, OH 45241
12100 Reed Hartman Hwy, Cincinnati, OH 45241
Add your location
Source: CMS Payroll-Based Journal (Q2 2025)
| Role ⓘ | Count ⓘ | Avg Shift (hrs) ⓘ | Uses Contractors? ⓘ |
|---|---|---|---|
| Registered Nurse | 30 | 9.3 | No |
| Licensed Practical Nurse | 62 | 9.8 | No |
| Certified Nursing Assistant | 104 | 9.1 | No |
| Role ⓘ | Employees ⓘ | Contractors ⓘ | Total Staff ⓘ | Total Hours ⓘ | Days Worked ⓘ | % of Days ⓘ | Avg Shift (hrs) ⓘ |
|---|---|---|---|---|---|---|---|
| Certified Nursing Assistant | 104 | 0 | 104 | 18,496 | 91 | 100% | 9.1 |
| Licensed Practical Nurse | 62 | 0 | 62 | 11,710 | 91 | 100% | 9.8 |
| Registered Nurse | 30 | 0 | 30 | 3,909 | 91 | 100% | 9.3 |
| RN Director of Nursing | 9 | 0 | 9 | 2,778 | 65 | 71% | 8 |
| Other Dietary Services Staff | 15 | 0 | 15 | 2,351 | 91 | 100% | 6 |
| Mental Health Service Worker | 3 | 0 | 3 | 919 | 64 | 70% | 8 |
| Speech Language Pathologist | 0 | 3 | 3 | 896 | 66 | 73% | 7.5 |
| Physical Therapy Aide | 0 | 5 | 5 | 531 | 63 | 69% | 6.3 |
| Nurse Practitioner | 3 | 0 | 3 | 512 | 64 | 70% | 8 |
| Administrator | 2 | 0 | 2 | 495 | 62 | 68% | 8 |
| Other Physician | 0 | 5 | 5 | 494 | 52 | 57% | 4.8 |
| Qualified Social Worker | 0 | 5 | 5 | 471 | 68 | 75% | 6.2 |
| Dietitian | 1 | 0 | 1 | 456 | 57 | 63% | 8 |
| Occupational Therapy Aide | 1 | 1 | 2 | 447 | 52 | 57% | 6.6 |
| Respiratory Therapy Technician | 0 | 4 | 4 | 424 | 85 | 93% | 4.8 |
| Physical Therapy Assistant | 0 | 5 | 5 | 298 | 73 | 80% | 3.4 |
| Qualified Activities Professional | 6 | 0 | 6 | 181 | 12 | 13% | 9.6 |
| Medical Director | 0 | 1 | 1 | 156 | 26 | 29% | 6 |
| Occupational Therapy Assistant | 0 | 1 | 1 | 39 | 13 | 14% | 3 |
| Dental Services Staff | 1 | 0 | 1 | 15 | 2 | 2% | 7.4 |
Source: CMS Long-Term Care Facility Characteristics (Data as of Jan 2026)
Residents meet regularly to discuss policies, care quality, and activities
Part of a Continuing Care Retirement Community offering multiple care levels
Organized group of residents that meets regularly to discuss facility policies, quality of life, and activities.
Data sourced from CMS Long-Term Care Facility Characteristics quarterly report. Payer mix reflects the current resident census by primary payment source.
These measures show how residents usually do over time at this home, based on health outcomes and preventive care.
Ohio average: 5.8
Ohio average: 12.7
Ohio average: 6.8%
Ohio average: 8.9%
Ohio average: 22.0%
Ohio average: 3.4%
Ohio average: 3.9%
Ohio average: 0.5%
Ohio average: 6.2%
Ohio average: 24.0%
Ohio average: 8.4%
Ohio average: 92.4%
Ohio average: 94.5%
Ohio average: 78.0%
Ohio average: 1.3%
Ohio average: 75.6%
Ohio average: 25.1%
Ohio average: 12.5%
Ohio average: 0.8%
Ohio average: 53.7%
Ohio average: 50.6%
Quality measures are calculated from Minimum Data Set (MDS) assessments. For most measures, lower percentages indicate better care quality.
Federal penalties imposed by CMS for regulatory violations, including civil money penalties (fines) and denials of payment for new Medicare/Medicaid admissions.
Source: CMS Penalties Database (Data as of Jan 2026)
Ohio average: $69K
Ohio average: 1.9
Ohio average: 0.5
Penalties are imposed by CMS for violations of federal nursing home regulations.
Last updated: Jan 2026
Historical financial and operational data for Brookwood Retirement Community based on CMS SNF Cost Reports.
Loading trend charts...
Care Cost Calculator: See Prices in Your Area
Nursing Home Data Explorer
Don’t Wait Too Long: 7 Red Flag Signs Your Parent Needs Assisted Living Now
The True Cost of Assisted Living in 2025 – And How Families Are Paying For It
Understanding Senior Living Costs: Pricing Models, Discounts & Financial Assistance

Touring a community? Use this expert-backed checklist to stay organized, ask the right questions, and find the perfect fit.
We'll send you a PDF version of the touring checklist.


