Hillebrand Nursing and Rehabilitation Center
Nursing Home, Hospice Care, Memory Care & Respite Care · Cincinnati, OH
CMS overall rating Info CMS (the Centers for Medicare & Medicaid Services) is the federal agency that rates nursing home quality. Its Overall Rating runs from 1 to 5 stars, combining health inspections, staffing, and quality measures, with inspections weighted most heavily.

Hillebrand Nursing and Rehabilitation Center

Nursing Home, Hospice Care, Memory Care & Respite Care · Cincinnati, OH
CMS overall rating Info CMS (the Centers for Medicare & Medicaid Services) is the federal agency that rates nursing home quality. Its Overall Rating runs from 1 to 5 stars, combining health inspections, staffing, and quality measures, with inspections weighted most heavily.
Calculator: See prices in your area
Hillebrand Nursing and Rehabilitation Center accepts Medicaid, Medicare, and private pay.

Overview of Hillebrand Nursing and Rehabilitation Center

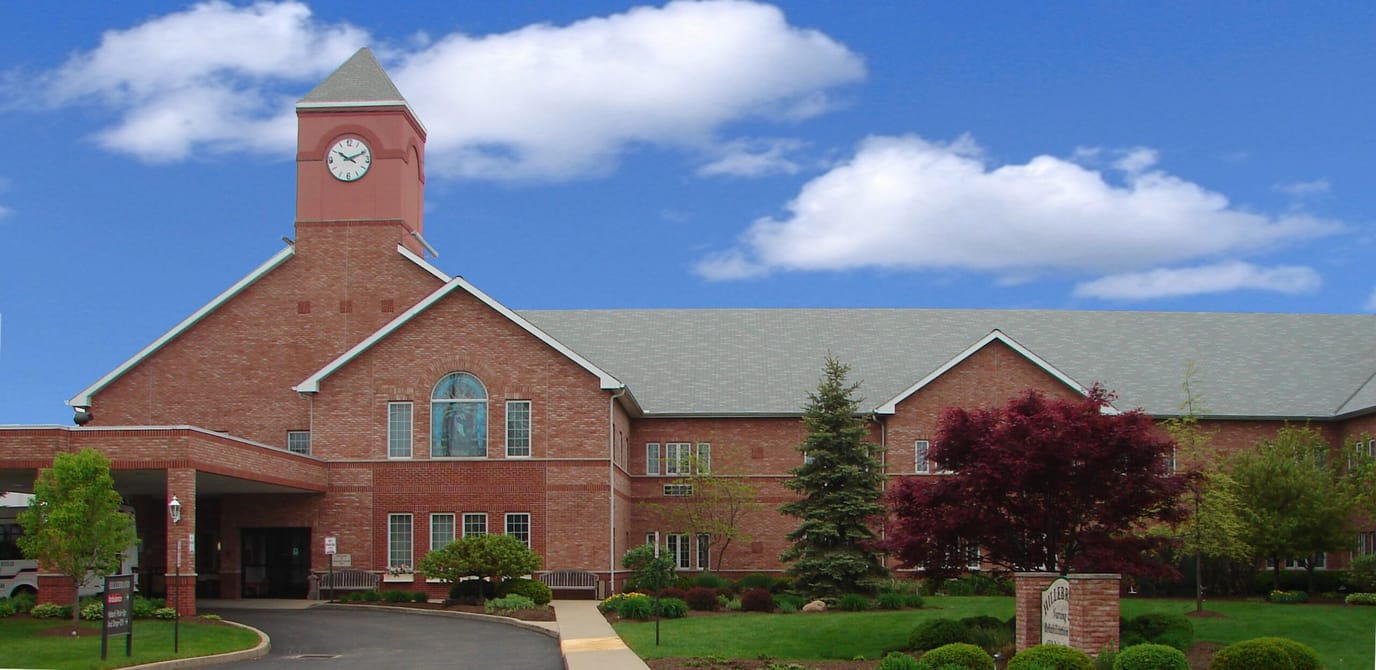
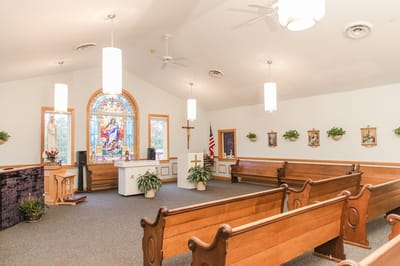
Hillebrand Nursing and Rehabilitation Center is on Bridgetown Road in Cincinnati’s west side, in a neighborhood that lands at a Walk Score of 69, moderately walkable for a skilled nursing setting. The single-story building handles both short-stay rehabilitation and longer-term nursing care. An average length of stay of 90 days reflects a post-acute population that is largely passing through on the way back home.

The therapy lineup is substantive. Physical, occupational, and speech-language therapy are all on-site, and outpatient therapy is available for residents making the transition back to independent living. Beyond rehab, Hillebrand runs long-term care, hospice, and a dedicated on-site dialysis service, which is not the norm and matters for anyone who needs ongoing dialysis treatment without adding outside transport. A doctor is on staff, and a 24/7 pharmacy is accessible within the building.

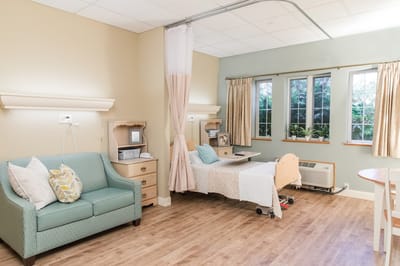
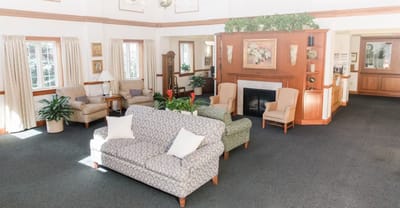
Nursing coverage runs 3 hours and 7 minutes per resident per day in total, with RNs contributing 28 minutes of that. The facility accepts Medicare, Medicaid, and private pay. Dining is restaurant-style with select menus alongside home-cooked options, and the building includes private bathrooms, a salon, whirlpool spas, a library, and transportation.

State inspections have tended to focus on medication management, infection control, care planning, and fall prevention. For families navigating post-hospital placement, Hillebrand offers a compact, well-resourced skilled nursing setting with specialty services that extend well past basic rehab.

Quality ratings

Measured by Centers for Medicare & Medicaid Services (CMS)

Overall rating Info The Overall CMS Rating combines results from health inspections, staffing levels and quality measures. Health inspections carry the most weight. Staffing and quality scores can increase or decrease the final rating based on performance compared to state and national standards.
▼ 37.1% Below OH avg. ▼ 37.1% Below OH avg.OH average: 3.2Click the badge to see the full State ranking.Click here to see the full State ranking.
Health Inspection Info Based on the results of the facility's three most recent standard inspections and any complaint investigations. CMS reviews the number, scope, and severity of deficiencies, with more recent findings weighted more heavily.
▼ 28.6% Below OH avg. ▼ 28.6% Below OH avg.OH average: 2.8Click the badge to see the full State ranking.Click here to see the full State ranking.
Staffing Info Measures average nursing staff hours per resident per day, including Registered Nurses (RNs) and total nursing staff. Ratings are adjusted based on the level of care residents require and are compared to state and national benchmarks.
▼ 18.1% Below OH avg. ▼ 18.1% Below OH avg.OH average: 2.4Click the badge to see the full State ranking.Click here to see the full State ranking.
Quality Measures Info Based on clinical and physical health indicators reported to CMS, such as hospital readmissions, falls, pressure ulcers, and improvements in mobility. These measures reflect how well residents' health needs are being managed.
▼ 8.2% Below OH avg. ▼ 8.2% Below OH avg.OH average: 4.4Click the badge to see the full State ranking.Click here to see the full State ranking.

Staffing hours breakdown

Info Daily nursing hours per resident by staff type, reported to CMS. Higher is generally better — compare this facility to state and national averages to see where staffing stands.

Hours per resident per day — compared to Ohio state averages

Total nursing care / resident Info This home is ranked 165th out of 210 homes in Ohio for nurse hours. Total adjusted nursing hours per resident per day, combining RN, LPN, and aide time. CMS adjusts this for case-mix so facilities can be fairly compared.
3h 7m per day
Rank #165 / 210Nurse hours — State benchmarkedThis home is ranked 165th out of 210 homes in Ohio. Shows adjusted nurse hours per resident per day benchmarked to the Ohio average, with a ranking across 210 Ohio facilities. More hours mean more direct care. The national average is about 3.5 hrs; below 3.0 is a red flag.Rankings are based only on facilities in Ohio that report data for that category. Facilities without available data are excluded from the ranking.Click the rank badge to see the full State ranking.Click here to see the full State ranking.
This facility Ohio avg (3h 32m per day)
vs Ohio avg
-12%

3 of 6 metrics below state avg

Standout metric Physical Therapist is +51% above state avg
Staff typeHours / Day / Residentvs state avg
Registered Nurse (RN) Info RNs hold the highest nursing license and can assess residents, interpret test results, and direct care plans. More RN hours per day often signals stronger clinical oversight and faster response to health changes. 28m per day ▼ 26% State avg: 38m per day · National avg: 41m per day
LPN / LVN Info Licensed Practical Nurses (LPNs) or Licensed Vocational Nurses (LVNs) deliver routine hands-on care — medication administration, wound dressing, and monitoring vital signs. They work under RN supervision and make up a large share of daily bedside care. 1h 9m per day ▲ 19% State avg: 58m per day · National avg: 52m per day
Nurse Aide Info Certified Nurse Aides (CNAs) provide the most direct day-to-day assistance: bathing, dressing, feeding, and mobility. Nurse aide hours are typically the largest staffing category and directly affect residents' quality of life. 1h 50m per day ▼ 14% State avg: 2h 8m per day · National avg: 2h 21m per day
Weekend Total Nursing Info Combined nursing hours (RN + LPN + Nurse Aide) per resident per day on weekends. Staffing often drops on weekends — this figure reveals whether the facility maintains adequate coverage outside of weekday hours. 3h 16m per day ■ Avg State avg: 3h 17m per day · National avg: 3h 26m per day
Physical Therapist Info Hours per resident per day provided by licensed Physical Therapists (PTs) or PT Assistants. PT services help residents recover mobility after injury or illness and are especially important for post-acute (short-stay) rehabilitation. 5m per day ▲ 51% State avg: 3m per day · National avg: 4m per day
Weekend RN Info Registered nurse hours specifically on weekends. Facilities sometimes reduce RN presence on Saturdays and Sundays — a low weekend RN figure compared to weekday hours can indicate reduced clinical oversight when most administrative staff are absent. 14m per day ▼ 45% State avg: 25m per day · National avg: 29m per day

Capacity and availability

This home is often near full

Higher occupancy than the Ohio average: 78.7%
Occupancy rate
95.4% Rank #36 / 211Occupancy rate — State benchmarkedThis home is ranked 36th out of 211 homes in Ohio. Shows this facility's occupancy rate versus the Ohio average, with its Statewide rank out of 211. Higher occupancy signals strong local demand and financial stability.Rankings are based only on facilities in Ohio that report data for that category. Facilities without available data are excluded from the ranking.Click the rank badge to see the full State ranking.Click here to see the full State ranking.
Avg. Length of Stay
90 days
Bed community size
108-bed community Rank #63 / 323Bed count — State benchmarkedThis home is ranked 63rd out of 323 homes in Ohio. Shows this facility's certified or reported bed count compared to other Ohio facilities. Larger communities may offer more amenities, programs, and on-site services for residents and families.Rankings are based only on facilities in Ohio that report data for that category. Facilities without available data are excluded from the ranking.Click the rank badge to see the full State ranking.Click here to see the full State ranking.
A larger shared setting that may offer more common spaces and organized community services.
Walk Score
Walk Score: 69 / 100 Rank #77 / 705Walk Score — State benchmarkedThis home is ranked 77th out of 705 homes in Ohio. Shows how walkable this facility's neighborhood is compared to the average Walk Score across Ohio facilities. Higher scores benefit residents, families, and staff.Rankings are based only on facilities in Ohio that report data for that category. Facilities without available data are excluded from the ranking.Click the rank badge to see the full State ranking.Click here to see the full State ranking.
Moderately walkable. Some errands can be accomplished on foot, with a mix of nearby amenities.

About this community

License Details

CMS Certification Number365045

Safety & Compliance

Safety FeaturesSecure-Care radio frequency identification (RFID) technology.

Staffing

Key information about the people who lead and staff this community.

Leadership

ContactMs. Michelle Schneider, Owner

Payment & Insurance

2 services
Accept Medicaid
Accept Medicare

Therapy & Rehabilitation

2 services
Rehabilitation Services
Respite Care

Staffing & Medical

2 services
Doctor on Staff
24-Hour Staffing

Amenities & Lifestyle

Home-Cooked Meals
Private Bathrooms
Free Wi-Fi
Onsite Salon Services
Recreational Programs
24/7 Pharmacy Access
Whirlpool Spas
Library
Transportation Services
Specific ProgramsNursing & Rehabilitation Therapy Services, Speech-Language Therapy, Outpatient Therapy, Long-Term Care Living, Dialysis Den

Contact Hillebrand Nursing and Rehabilitation Center

Inspection History

In Ohio, the Department of Health, Bureau of Survey and Certification conducts unannounced onsite inspections to evaluate the quality of care and environment in all licensed facilities.

Since 2018 · 8 years of data 27 citations

Inspection Scorecard Info This scorecard compares key inspection, citation, and complaint metrics at this facility against the Ohio state average. Metrics rated ≥15% worse than average are highlighted in red; those ≥15% better are highlighted in green.

Since 2018 vs. Ohio state average
Overall vs. OH average 2 Worse Metrics worse than Ohio average:
• Total citations (1250% above)
• Citations per year (1033% above)
0 Better No metrics in this bucket.
Latest Inspection March 4, 2025 Complaint Investigation

Citations Info Citations are formal regulatory issues recorded during state inspections.

This FacilityOH Averagevs. OH Avg
Total citations Info Formal regulatory issues recorded by inspectors across all inspection types. 272 This facility has 1250% more total citations than a typical Ohio nursing home (27 vs. OH avg 2).↑ 1250% worse
Citations per year Info Average citations per year since 2018. 3.40.3 This facility has 1033% more citations per year than a typical Ohio nursing home (3.4 vs. OH avg 0.3).↑ 1033% worse

Inspection Reports Summary Info An editor-reviewed summary of the themes and findings across this facility's recent inspection reports.

  • March 4, 2025 inspection found one deficiency for incomplete medical record documentation, with no immediate jeopardy or harm-level citations.
  • June 28, 2024 inspection identified immediate jeopardy and serious injury from failure to secure a resident with a seatbelt during transportation.
  • February 22, 2023 complaint investigation found 13 deficiencies including pressure ulcer care, medication storage, infection control, and failure to provide dignity, showing widespread care and safety issues.

Health Inspection History

Inspections since 2018
Total health inspections 7

Ohio average 6.7


Last Health inspection on Mar 2025

Total health citations
28 Rank #103 / 210Health citations — State benchmarkedThis home is ranked 103rd out of 210 homes in Ohio. Shows this facility's total health deficiency citations benchmarked to the Ohio State average, with a ranking across all 210 OH facilities. Lower citation counts earn a better rank.Rankings are based only on facilities in Ohio that report data for that category. Facilities without available data are excluded from the ranking.Click the rank badge to see the full State ranking.Click here to see the full State ranking.

Ohio average 30.9

Citations per inspection
4 Rank #95 / 210Citations per inspection — State benchmarkedThis home is ranked 95th out of 210 homes in Ohio. Shows average deficiency citations per CMS inspection for this facility versus the Ohio mean across 210 facilities with citation data. Lower is better.Rankings are based only on facilities in Ohio that report data for that category. Facilities without available data are excluded from the ranking.Click the rank badge to see the full State ranking.Click here to see the full State ranking.

Ohio average 4.59


Health citations are formal notices following inspections when they fail to comply with safety and care standards.

22 of 28 citations resulted from standard inspections; 4 of 28 resulted from complaint investigations; and 2 of 28 came from combined inspections (standard and complaint).

Breakdown of citation severity (last 8 years)
Critical health citations
1
233% worse than Ohio average

Ohio average: 0.3


Serious health citations
0
100% better than Ohio average

Ohio average: 0.9

1 critical citation Ohio average: 0.3

0 serious citations Ohio average: 0.9

26 moderate citations Ohio average: 29

1 minor citation Ohio average: 0.7
Citations history (last 8 years)
Care Planning moderate citation Mar 04, 2025
Corrected

Quality of Care critical citation Jun 28, 2024
Corrected

Quality of Care moderate citation Nov 14, 2023
Corrected

Infection Control moderate citation Feb 22, 2023
Corrected

Staffing Data

Reporting period: October 1 – December 31, 2025 (Q4 2025). Source: CMS Payroll-Based Journal report.

Total staff 126
Employees 98
Contractors 28
Staff to resident ratio 1.33 : 1
35% fewer staff per resident than Ohio average
Ohio average ratio: 2.04 : 1 Ohio average ratio: 2.04 : 1See full Ohio ranking
Avg staff/day 49
Average shift 8.7 hours
7% better than Ohio average
Ohio average: 8.1 hours Ohio average shift: 8.1 hoursSee full Ohio ranking
Total staff hours (quarter) 39,171

Nursing staff breakdown

Q4 2025 · Oct 1 – Dec 31 More info This data comes from the CMS Payroll-Based Journal report covering October 1 – December 31, 2025.
Registered Nurse

Manages medical care and health needs.

RN Staff Info 10 total: 9 full-time employees and 1 contractor. 10
Average shift length Info Average shift length. Calculated as total hours divided by days worked and average staff per day. 9.7 hours
Licensed Practical Nurse

Assists with medical care and medications.

LPN Staff Info All 24 LPN Staff are full-time employees. No contractors work on this role. 24
Average shift length Info Average shift length. Calculated as total hours divided by days worked and average staff per day. 9.5 hours
Certified Nursing Assistant

Helps with daily care and mobility.

CNA Staff Info All 53 CNA Staff are full-time employees. No contractors work on this role. 53
Average shift length Info Average shift length. Calculated as total hours divided by days worked and average staff per day. 9.1 hours

Contractor staffing

Q4 2025 · Oct 1 – Dec 31 More info This data comes from the CMS Payroll-Based Journal report covering October 1 – December 31, 2025.

Total hours from contractors

9.9%

3,860 contractor hours this quarter

Qualified Social Worker: 7 Respiratory Therapy Technician: 5 Speech Language Pathologist: 4 Physical Therapy Aide: 4 Physical Therapy Assistant: 3 Medical Director: 2 Registered Nurse: 1 Clinical Nurse Specialist: 1 Occupational Therapy Assistant: 1

Staff by category

Q4 2025 · Oct 1 – Dec 31 More info This data comes from the CMS Payroll-Based Journal report covering October 1 – December 31, 2025.
Certified Nursing Assistant5305317,25692100%9.1
Licensed Practical Nurse240249,70892100%9.5
Registered Nurse91102,76192100%9.7
Other Dietary Services Staff4041,84492100%8
RN Director of Nursing2021,0566672%8
Nurse Practitioner2021,0526672%8
Speech Language Pathologist0448506773%7.5
Physical Therapy Aide0447365964%7.1
Respiratory Therapy Technician0557066571%6.1
Clinical Nurse Specialist1125546470%8.2
Administrator1015286672%8
Occupational Therapy Aide1015286672%8
Dental Services Staff1015286672%8
Physical Therapy Assistant0334626874%5.9
Qualified Social Worker0774245964%6.2
Medical Director0221302628%3.3
Occupational Therapy Assistant011484852%1
53 Certified Nursing Assistant
% of Days 100%
24 Licensed Practical Nurse
% of Days 100%
10 Registered Nurse
% of Days 100%
4 Other Dietary Services Staff
% of Days 100%
2 RN Director of Nursing
% of Days 72%
2 Nurse Practitioner
% of Days 72%
4 Speech Language Pathologist
% of Days 73%
4 Physical Therapy Aide
% of Days 64%
5 Respiratory Therapy Technician
% of Days 71%
2 Clinical Nurse Specialist
% of Days 70%
1 Administrator
% of Days 72%
1 Occupational Therapy Aide
% of Days 72%
1 Dental Services Staff
% of Days 72%
3 Physical Therapy Assistant
% of Days 74%
7 Qualified Social Worker
% of Days 64%
2 Medical Director
% of Days 28%
1 Occupational Therapy Assistant
% of Days 52%

Penalties and fines

Includes penalties issued in 2024

Federal penalties imposed by CMS for regulatory violations, including civil money penalties (fines) and denials of payment for new Medicare/Medicaid admissions.

Source: CMS Penalties Database (Data as of Jan 2026)

Total fines amount $27K Rank #163 / 211Federal fines — State benchmarkedThis home is ranked 163rd out of 211 homes in Ohio. Shows this facility's cumulative CMS federal fine dollars versus the Ohio average among facilities with fines, and where it ranks among 211 facilities in the pool. Lower total dollars mean a better rank.Rankings are based only on facilities in Ohio that report data for that category. Facilities without available data are excluded from the ranking.Click the rank badge to see the full State ranking.Click here to see the full State ranking.
60% lower than Ohio average

Ohio average: $69K

Number of fines 2
8% more fines than Ohio average

Ohio average: 1.9

Payment Denials Info Serious action where Medicare and/or Medicaid temporarily stops payments for new residents until issues are fixed. 0
100% fewer payment denials than Ohio average

Ohio average: 0.5

Fines amount comparison
This facility $27K
Ohio average $69K
Penalty History

Penalties are imposed by CMS for violations of federal nursing home regulations.

1 penalty in the past 3 years

Jun 28, 2024 · $17K

Civil Money Penalty Info Fines imposed for noncompliance, which can be assessed per day or per instance of violation. Jun 28, 2024
$17K

Last updated: Jan 2026

Quality of care over time

These measures show how residents usually do over time at this home, based on health outcomes and preventive care.

High-risk clinical events score Info A composite score based on pressure ulcers, falls with injury, weight loss, walking ability decline, and activities of daily living decline. 5.7
In line with Ohio average

Ohio average: 5.8

Functional decline score Info A composite score based on activities of daily living decline, walking ability decline, and incontinence. 13.0
In line with Ohio average

Ohio average: 12.7

Long-stay resident measures
Significantly above average Ohio avg: 4.7 Info CMS star rating based on long-stay quality measure performance. 5 stars = significantly above average, 1 star = significantly below average.
Need for Help with Daily Activities Increased Info Percent of long-stay residents whose need for help with daily activities has increased 9.3%
36% worse than Ohio average

Ohio average: 6.8%

Walking Ability Worsened Info Percent of long-stay residents whose ability to move independently worsened 6.0%
32% better than Ohio average

Ohio average: 8.9%

Low Risk Residents with Bowel/Bladder Incontinence Info Percent of low risk long-stay residents who lose control of their bowels or bladder 23.6%
7% worse than Ohio average

Ohio average: 22.0%

Falls with Major Injury Info Percent of long-stay residents experiencing one or more falls with major injury 4.0%
16% worse than Ohio average

Ohio average: 3.4%

High Risk Residents with Pressure Ulcers Info Percent of long-stay high risk residents with pressure ulcers 1.3%
67% better than Ohio average

Ohio average: 3.9%

Urinary Tract Infection Info Percent of long-stay residents with a urinary tract infection 1.5%
182% worse than Ohio average

Ohio average: 0.5%

Lost Too Much Weight Info Percent of long-stay residents who lose too much weight 8.1%
31% worse than Ohio average

Ohio average: 6.2%

Depressive Symptoms Info Percent of long-stay residents who have depressive symptoms 37.0%
54% worse than Ohio average

Ohio average: 24.0%

Antipsychotic Use Info Percent of long-stay residents who received an antipsychotic medication 12.6%
50% worse than Ohio average

Ohio average: 8.4%

Pneumococcal Vaccine Info Percent of long-stay residents assessed and appropriately given the pneumococcal vaccine 98.5%
7% better than Ohio average

Ohio average: 92.4%

Influenza Vaccine Info Percent of long-stay residents assessed and appropriately given the seasonal influenza vaccine 98.9%
5% better than Ohio average

Ohio average: 94.5%

Hospitalizations per 1,000 days Info Number of hospitalizations per 1,000 long-stay resident days. 1.46
18% better than Ohio average

Ohio average: 1.77

ED visits per 1,000 days Info Number of outpatient emergency department visits per 1,000 long-stay resident days. 0.96
48% better than Ohio average

Ohio average: 1.83

Short-stay resident measures
Below average Ohio avg: 2.4 Info CMS star rating based on short-stay quality measure performance. 5 stars = much above average, 1 star = much below average.
Pneumococcal Vaccine Info Percent of short-stay residents assessed and appropriately given the pneumococcal vaccine 95.3%
22% better than Ohio average

Ohio average: 78.0%

Antipsychotic medication increase Info Percent of short-stay residents who newly received an antipsychotic medication 1.4%
12% worse than Ohio average

Ohio average: 1.3%

Influenza Vaccine Info Percent of short-stay residents assessed and appropriately given the seasonal influenza vaccine 93.8%
24% better than Ohio average

Ohio average: 75.6%

Re-hospitalized after SNF stay Info Percentage of short-stay residents who were re-hospitalized after their nursing home admission. 21.6%
14% better than Ohio average

Ohio average: 25.1%

Emergency department visits Info Percentage of short-stay residents who had an outpatient emergency department visit. 12.4%
In line with Ohio average

Ohio average: 12.5%

Falls with major injury Info Percentage of SNF residents who experience falls with major injury during their stay. 0.0%
100% better than Ohio average

Ohio average: 0.8%

Ability to care for self at discharge Info Percentage of residents at or above expected ability to care for themselves at discharge. 50.5%
6% worse than Ohio average

Ohio average: 53.7%

Successful return to home or community Info Rate of successful return to home or community from a skilled nursing facility. 48.6%
In line with Ohio average

Ohio average: 50.6%

Breakdown by payment type

Medicare

37% of new residents, usually for short-term rehab.

Typical stay 26 days

Private pay

60% of new residents, often for short stays.

Typical stay 2 months

Medicaid

2% of new residents, often for long-term daily care.

Typical stay 5 - 6 years

Facility Characteristics

Source: CMS Long-Term Care Facility Characteristics (Data as of Jan 2026)

Total residents 95
Medicare
7
7.4% of residents
Medicaid
36
37.9% of residents
Private pay or other
52
54.7% of residents
Programs & Services
Residents Group

Residents meet regularly to discuss policies, care quality, and activities

Family Member Group

Family members meet regularly to discuss policies, care quality, and activities

Active Family Council

Organized group of family members that meets regularly to discuss facility policies, resident care, and activities.

Active Resident Council

Organized group of residents that meets regularly to discuss facility policies, quality of life, and activities.

Finances and operations

Based on CMS SNF Cost Report for fiscal year ending in 08/2024.

For-profit
Corporation
Net patient revenue Info Net patient revenue — what the home actually collects for resident care, after contractual allowances, bad debt and discounts are subtracted from its gross charges (CMS cost report, Worksheet G-3). It covers resident care only; money the home earns from other sources is shown separately as "Other income."
$13.6M
Net patient income Info Net patient income: net patient revenue minus the home's total operating expenses. A positive figure means it earns more from resident care than it spends to deliver it; a negative figure means the opposite. It excludes non-operating "other income."
$141.4K
For-profit Corporation
Net patient revenue Info Net patient revenue — what the home actually collects for resident care, after contractual allowances, bad debt and discounts are subtracted from its gross charges (CMS cost report, Worksheet G-3). It covers resident care only; money the home earns from other sources is shown separately as "Other income."
$13.6M Rank #31 / 210Revenue — State benchmarkedThis home is ranked 31st out of 210 homes in Ohio. Shows this facility's annual revenue compared to the Ohio average. Higher revenue generally means more resources for staffing and capital — read alongside Payroll %.Rankings are based only on facilities in Ohio that report data for that category. Facilities without available data are excluded from the ranking.Click the rank badge to see the full State ranking.Click here to see the full State ranking.
Net patient income Info Net patient income: net patient revenue minus the home's total operating expenses. A positive figure means it earns more from resident care than it spends to deliver it; a negative figure means the opposite. It excludes non-operating "other income."
$141.4K
Other income Info Money the home earns outside of resident care — such as investments, grants, rentals and other non-operating sources (CMS cost report, Worksheet G-3). It is tracked separately from net patient revenue: it is not part of that figure, and it is not included in net patient income.
-$212
Payroll costs Info Staff salaries plus wage-related costs — benefits such as payroll taxes, health insurance and retirement — from the home's own accounting records (CMS cost report, Worksheet A). Contract or agency labor is counted separately, under other operating costs. Rank #55 / 210Payroll — State benchmarkedThis home is ranked 55th out of 210 homes in Ohio. Shows total annual staff payroll benchmarked to the Ohio average. Higher payroll investment relative to peers often signals better staffing and less reliance on cheaper contract labor.Rankings are based only on facilities in Ohio that report data for that category. Facilities without available data are excluded from the ranking.Click the rank badge to see the full State ranking.Click here to see the full State ranking.
$7.0M 51.5% of net patient revenue Info Payroll as a share of revenue: staff salaries and wage-related benefits divided by net patient revenue. A higher figure means more of each revenue dollar goes to staff pay. Rank #186 / 210Payroll % — State benchmarkedThis home is ranked 186th out of 210 homes in Ohio. Shows payroll as a percentage of revenue versus the Ohio average. Well-run Ohio facilities typically land around 54–64% — the top third Statewide. Below 25% may signal understaffing or heavy agency use — read with Staffing ratings.Rankings are based only on facilities in Ohio that report data for that category. Facilities without available data are excluded from the ranking.Click the rank badge to see the full State ranking.Click here to see the full State ranking.
Other operating costs Info Everything it costs to run the home apart from payroll — food, utilities, supplies, maintenance, contract labor and administration. Calculated as total operating expense minus payroll (staff salaries and wage-related benefits).
$6.5M
Total costs Info The home's total operating expense for the year — all the costs of running it, salaries included (CMS cost report, Worksheet G-3).
$13.5M

What does this home offer?

Building type icon
Building type icon

Building Type: Single-story

Who this home usually serves

TYPE OF STAY

Primarily short stays

Residents typically stay for brief periods, with frequent admissions and discharges throughout the year.

Most new residents arrive under private pay (60% of admissions), and a typical private pay stay runs around 2 months.

Admissions
416 total

Coverage residents most often arrive under.

Medicare 37%
Private pay 60%
Medicaid 2%
Discharges
410 total

Coverage residents most often leave under.

Medicare 27%
Private pay 70%
Medicaid 3%

Managed by Brandy Masminster Wenning

Administrator

Places of interest near Hillebrand Nursing and Rehabilitation Center

Address 7.0 miles from city center Info Estimated distance in miles from Cincinnati's city center to Hillebrand Nursing and Rehabilitation Center's address, calculated via Google Maps. — 2.06 miles to nearest hospital (Mercy Health - West Hospital)

Calculate Travel Distance to Hillebrand Nursing and Rehabilitation Center

Add your location

Address

Compare Nursing Homes around Cincinnati

The information below is reported by the Ohio Department of Health, Bureau of Survey and Certification.

5 facilities compared · CMS & OH Dept. of Health data

Mallard Cove Senior Living
NH
AL
MC
Sharonville
46
Facility 46
OH AVG 78
Rank #245 / 323
21.3%
Facility 21.3%
OH AVG 78.7%
Rank #211 / 211
-73%
5.90
Facility 5.90
OH AVG 3.54
Rank #6 / 210
+15%+67%
$0
Facility $0
OH AVG $74.0k
Rank #1 / 211
16
Facility 16
OH AVG 30.9
Rank #50 / 210
4.0
Facility 4.0
OH AVG 4.6
Rank #95 / 210
-34A+
48
Facility 48
OH AVG 40
Rank #277 / 705
Asad Ali
$1.5M
Facility $1.5M
OH AVG $10.1M
Rank #210 / 210
$2.6M
Facility $2.6M
OH AVG $3.9M
Rank #199 / 210
173.3%
Facility 173.3%
OH AVG 40.2%
Rank #1 / 210
366467
Mount Washington Care Center
NH
Cincinnati (Fruit Hill)
129
Facility 129
OH AVG 78
Rank #33 / 323
54.3%
Facility 54.3%
OH AVG 78.7%
Rank #197 / 211
-31%
3.25
Facility 3.25
OH AVG 3.54
Rank #150 / 210
+75%-8%
$0
Facility $0
OH AVG $74.0k
Rank #1 / 211
39
Facility 39
OH AVG 30.9
Rank #156 / 210
4.9
Facility 4.9
OH AVG 4.6
Rank #147 / 210
169A+
32
Facility 32
OH AVG 40
Rank #427 / 705
Edith Olanoff 2011 Trust Dated 10/21/2011
$8.9M
Facility $8.9M
OH AVG $10.1M
Rank #94 / 210
$5.8M
Facility $5.8M
OH AVG $3.9M
Rank #61 / 210
65.2%
Facility 65.2%
OH AVG 40.2%
Rank #35 / 210
365423
Cottingham Retirement Community
NH
AL
HC
IL
MC
PC
RC
Cincinnati (Sharonville)
128
Facility 128
OH AVG 78
Rank #36 / 323
45.3%
Facility 45.3%
OH AVG 78.7%
Rank #203 / 211
-42%
2.78
Facility 2.78
OH AVG 3.54
Rank #198 / 210
-48%-21%
$0
Facility $0
OH AVG $74.0k
Rank #1 / 211
22
Facility 22
OH AVG 30.9
Rank #80 / 210
3.7
Facility 3.7
OH AVG 4.6
Rank #82 / 210
258A+
53
Facility 53
OH AVG 40
Rank #223 / 705
-
$7.5M
Facility $7.5M
OH AVG $10.1M
Rank #140 / 210
$3.7M
Facility $3.7M
OH AVG $3.9M
Rank #157 / 210
49.3%
Facility 49.3%
OH AVG 40.2%
Rank #148 / 210
365652
Clovernook Health Care LLC
NH
RC
Cincinnati (College Hill)
126
Facility 126
OH AVG 78
Rank #39 / 323
86.1%
Facility 86.1%
OH AVG 78.7%
Rank #98 / 211
+9%
3.55
Facility 3.55
OH AVG 3.54
Rank #99 / 210
-34%0%
$0
Facility $0
OH AVG $74.0k
Rank #1 / 211
38
Facility 38
OH AVG 30.9
Rank #150 / 210
2.5
Facility 2.5
OH AVG 4.6
Rank #27 / 210
1106A+
18
Facility 18
OH AVG 40
Rank #561 / 705
Clovernook Healthcare Holdings LLC
$12.9M
Facility $12.9M
OH AVG $10.1M
Rank #53 / 210
$5.9M
Facility $5.9M
OH AVG $3.9M
Rank #48 / 210
45.8%
Facility 45.8%
OH AVG 40.2%
Rank #105 / 210
365551
Hillebrand Nursing and Rehabilitation Center
NH
HC
MC
RC
Cincinnati (Montfort Heights)
108
Facility 108
OH AVG 78
Rank #63 / 323
95.4%
Facility 95.4%
OH AVG 78.7%
Rank #36 / 211
+21%
3.11
Facility 3.11
OH AVG 3.54
Rank #165 / 210
-14%-12%
$16.8k
Facility $16.8k
OH AVG $74.0k
Rank #163 / 211
28
Facility 28
OH AVG 30.9
Rank #103 / 210
4.0
Facility 4.0
OH AVG 4.6
Rank #95 / 210
1102-
69
Facility 69
OH AVG 40
Rank #77 / 705
Jmg Family LLP
$13.6M
Facility $13.6M
OH AVG $10.1M
Rank #31 / 210
$7.0M
Facility $7.0M
OH AVG $3.9M
Rank #55 / 210
51.5%
Facility 51.5%
OH AVG 40.2%
Rank #186 / 210
365045

Financial Assistance for
Nursing Home in Ohio

Hillebrand Nursing and Rehabilitation Center is located in Cincinnati, Ohio.
Here are the financial assistance programs available to residents in Ohio.

Get Financial aid guidance

PASSPORT Waiver

Ohio Medicaid PASSPORT

Age 60+
General Ohio resident, Medicaid-eligible, nursing home-level care need.
Income Limits (2025) ~$2,829/month 300% FBR, individual
Asset Limits $2,000 (individual), $3,000 (couple).
OH

Administered through regional agencies; waitlists possible.

Benefits
Personal care (5-7 hours/day) Respite (240 hours/year) Adult day care ($65/day) Home modifications ($1,500 avg.)

Ohio Home Care Program (non-Medicaid)

OH HCP

Age 60+
General Ohio resident, at risk of decline.
Income Limits ~$2,000/month individual, varies
Asset Limits $5,000 individual
OH

Limited funding; regional variation.

Benefits
In-home care (3-5 hours/week) Respite (up to 10 days/year) Transportation (~5 trips/month)

Assisted Living Waiver (ALW)

Ohio Assisted Living Waiver

Age 21+ (65+ prioritized)
General OH resident, Medicaid-eligible, NFLOC.
Income Limits (2025) ~$2,829/month (individual); QIT required.
Asset Limits $2,000 (individual), $3,000 (couple).
OH

Covers ~300 facilities; room/board not included (separate cost).

Benefits
Personal care Meals Medication management Transportation (~$3,000-$4,000/month value)

Program of All-Inclusive Care for the Elderly (PACE)

Ohio PACE (e.g., McGregor PACE)

Age 55+
General OH resident (specific counties), NFLOC, safe with PACE support.
Income Limits (2025) ~$2,829/month (Medicaid-eligible); private pay option available.
Asset Limits $2,000 (individual), $3,000 (couple) for Medicaid enrollees.
OH

Available in 9 counties (e.g., Cuyahoga, Franklin); expanding via Healthy Aging Grants.

Benefits
Personal care (5-7 hours/day) Medical care Meals Transportation Respite Therapies

Medicare Savings Program (MSP)

Ohio Medicare Savings Program

Age 65+ or disabled
General OH resident, Medicare Part A/B.
Income Limits (2025) ~$2,510/month (QMB), ~$3,380/month (SLMB), ~$3,598/month (QI)—individual.
Asset Limits $9,430 (individual), $14,130 (couple).
OH

Three tiers; includes Extra Help for Part D; no waitlist.

Benefits
Covers Part B premiums ($174.70/month) Deductibles ($240/year) Copays (~20%)

Home Energy Assistance Program (HEAP)

Ohio HEAP

Age 60+ prioritized
General OH resident, low-income household.
Income Limits (2025) ~$3,970/month individual, 185% FPL
Asset Limits Not assessed; income-focused.
OH

Covers gas, electric, oil; emergency aid via Winter/Summer Crisis Programs.

Benefits
Heating/cooling aid ($300-$1,000/season) Emergency aid ($500 max)

Family Caregiver Support Program (FCSP)

Ohio Family Caregiver Support Program

Age
General Caregivers of 60+ needing care or 55+ caregivers of others; OH resident; functional needs (2+ ADLs).
Income Limits (2025) Prioritizes ~$24,980/year (individual); no strict cap.
Asset Limits Not assessed; need-based.
OH

12 AAAs; rural/low-income priority; volunteer respite option.

Benefits
Respite (4-6 hours/week or 5 days/year) Adult day care ($60/day) Training Supplies (~$500/year)

VA Aid and Attendance (A&A) and Housebound Benefits

Ohio VA Aid and Attendance/Housebound

Age 65+ or disabled veteran/spouse
General OH resident, wartime service, need for ADL help (A&A) or homebound.
Income Limits (2025) Net income < ~$1,984/month (veteran with dependent, A&A); pension offsets income.
Asset Limits ~$155,356 net worth limit
OH

High veteran demand; supports care in multiple settings.

Benefits
Cash (~$1,433-$2,642/month veteran, ~$951-$1,318 spouse) for care costs (e.g., in-home, assisted living)

Homestead Exemption

Ohio Homestead Exemption

Age 65+ (or disabled)
General OH resident, homeowner, low-income.
Income Limits (2025) ~$38,500/year individual, adjusted annually
Asset Limits Not assessed; home ownership required.
OH

Reduces taxable value by $25,000; applies to primary residence.

Benefits
Tax reduction (~$400-$800/year avg., varies by county)

Save the Dream Ohio (Homeowner Assistance Fund)

Ohio Save the Dream

Age 60+ prioritized
General OH resident, homeowner, hardship post-Jan 21, 2020.
Income Limits (2025) ~$147,600/year family of 4, 150% AMI; varies by county
Asset Limits Not assessed; hardship-focused.
OH

Covers delinquent mortgages, utilities, taxes; max $25,000 mortgage aid.

Benefits
Mortgage aid ($25,000 max) Utility/property tax aid ($5,000 avg.)

Frequently Asked Questions about Hillebrand Nursing and Rehabilitation Center

What neighborhood is Hillebrand Nursing and Rehabilitation Center in?

Hillebrand Nursing and Rehabilitation Center is in the Montfort Heights neighborhood of Cincinnati.

Is Hillebrand Nursing and Rehabilitation Center in a walkable area?

Hillebrand Nursing and Rehabilitation Center has a walk score of 69. Moderately walkable. Some errands can be accomplished on foot, with a mix of nearby amenities.

What is the occupancy rate at Hillebrand Nursing and Rehabilitation Center?

Hillebrand Nursing and Rehabilitation Center's occupancy is 84.1%.

Does Hillebrand Nursing and Rehabilitation Center operate as a for-profit or non-profit?

Hillebrand Nursing and Rehabilitation Center is registered as a for-profit in OH.

Are there photos of Hillebrand Nursing and Rehabilitation Center?

Yes — there are 5 photos of Hillebrand Nursing and Rehabilitation Center in the photo gallery on this page.

What is the address of Hillebrand Nursing and Rehabilitation Center?

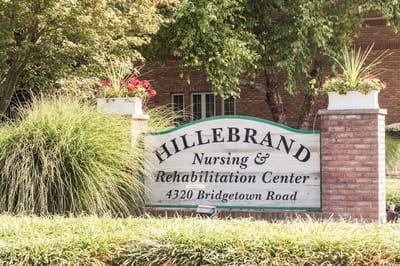
Hillebrand Nursing and Rehabilitation Center is located at 4320 Bridgetown Rd, Cincinnati, OH 45211.

What is the phone number of Hillebrand Nursing and Rehabilitation Center?

(513) 574-4550 will put you in contact with the team at Hillebrand Nursing and Rehabilitation Center.

Guides for Better Senior Living

Care Cost Calculator: See Prices in Your Area

Nursing Home Data Explorer

Don’t Wait Too Long: 7 Red Flag Signs Your Parent Needs Assisted Living Now

The True Cost of Assisted Living in 2025 – And How Families Are Paying For It

Understanding Senior Living Costs: Pricing Models, Discounts & Financial Assistance