Total health inspections
14
Michigan average 6.5
Last Health inspection on Oct 2025

We arrange tours, appointments, and even moving support so you don’t have to
Thank you for your interest!
Our team will be in touch shortly to help with next steps.


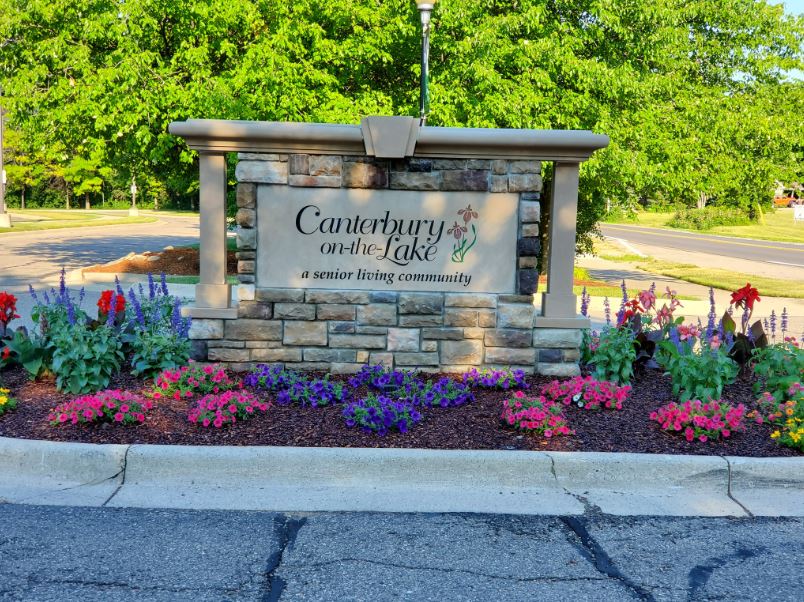
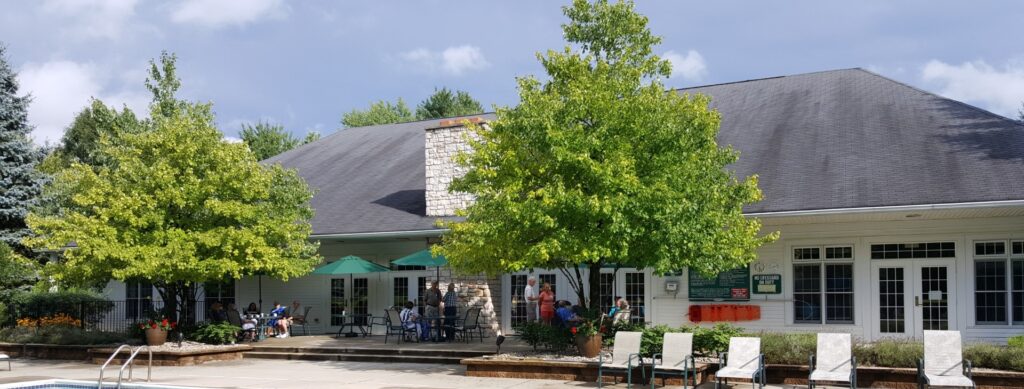
Set on 40 acres of lush and wooded area in Oakland County, Waterford, MI, Canterbury-on-the-lake is a thriving senior living community that offers various living options, including independent living, assisted living, memory care, and skilled nursing. The community offers a wide variety of beautifully designed residential options with bright, sunny interiors, fully equipped kitchen, and other modern conveniences. Residents receive the extra help they need – when they need it with a dedicated team available to lend a helping hand 24/7.
Residents live a vibrant and fulfilling life, thanks to the community’s wide variety of life-enriching activities, events, and classes. The community also offers a broad array of convenient amenities, including an art studio, business center, outdoor entertainment spaces, and beautiful gardens, walking paths, and a covered lakeside pavilion with seating for a peaceful alone time. Here, residents enjoy delicious, fresh, healthy, restaurant-style meals with multiple menu options in the beautifully appointed Orchid Dining Room, guaranteeing residents eat healthy and always feel energized to lead an active lifestyle.
Offers a balance of services and community atmosphere.
Lower occupancy suggests more openings may be available.
This home supports both short-term rehab and long-term care, with residents staying for a wide range of durations.
32% of new residents, usually for short-term rehab.
53% of new residents, often for short stays.
15% of new residents, often for long-term daily care.
Key information about the people who lead and staff this community.
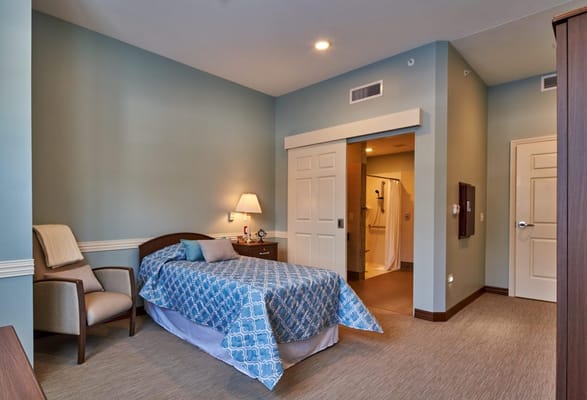
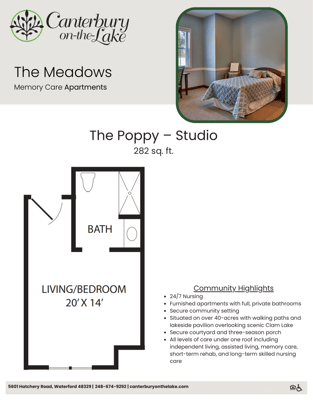
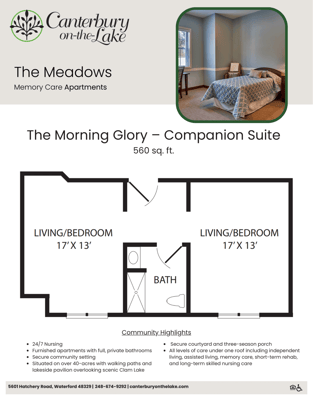
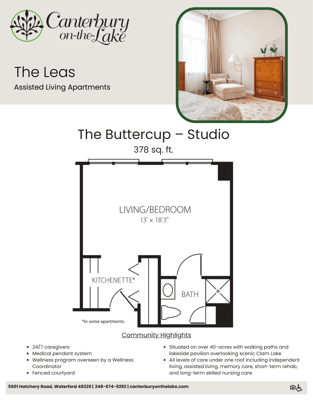
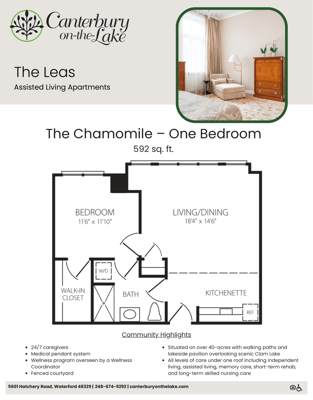
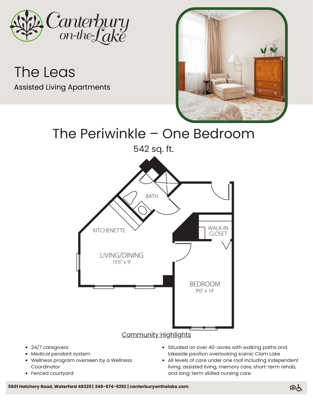
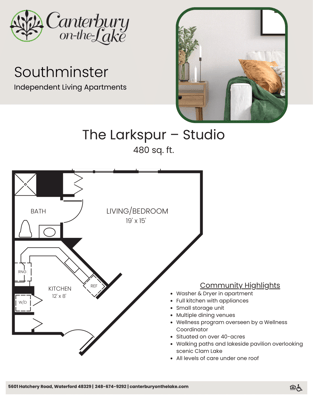
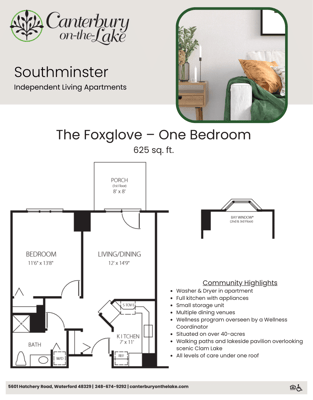
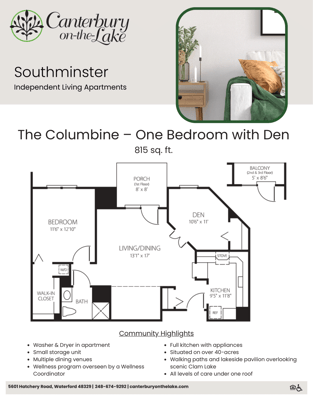
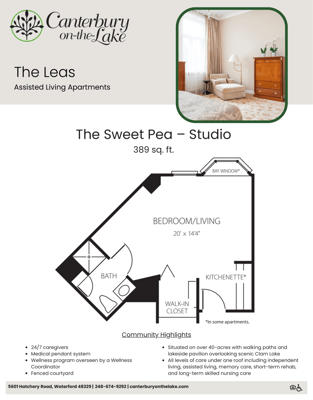
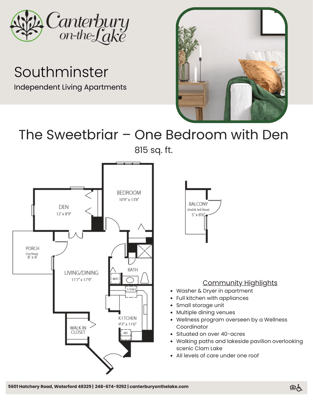
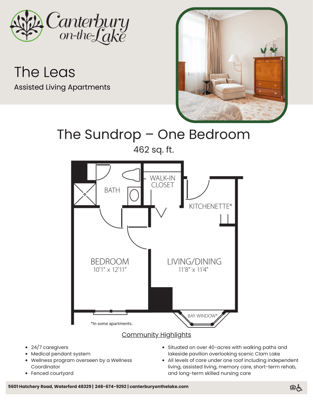
Housing Options: Studio / 1 Bed / 2 Bed
Building Type: 3-story
Transportation Services
Fitness and Recreation
Michigan average 6.5
Last Health inspection on Oct 2025
Michigan average 33.5
Michigan average 5.18
Health citations are formal notices following inspections when they fail to comply with safety and care standards.
35 of 78 citations resulted from standard inspections; 27 of 78 resulted from complaint investigations; and 16 of 78 came from combined inspections (standard and complaint).
Michigan average: 0.3
Michigan average: 1.9
Data sourced from CMS Health Deficiencies reports. Citation severity codes range from A (least serious) to L (most serious). Immediate Jeopardy (J-L) citations indicate situations where the facility's noncompliance has placed residents at risk of death or serious harm.
Assisted Living A licensed, long-term care setting for seniors or individuals with disabilities who need help with daily activities — like bathing, dressing, and medication management — but not 24-hour skilled nursing. Offers housing, meals, and around-the-clock support while aiming to maximize resident independence.
Independent Living Lifestyle-focused communities for older adults offering dining, activities, and transportation with minimal personal care. Best for active, independent seniors who want community without medical support.
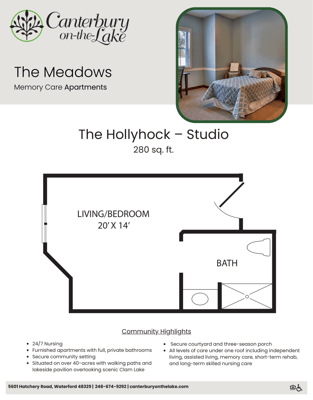
Memory Care Secured, specialized care for people living with Alzheimer's or dementia. Staff trained in cognitive impairment, with higher staff-to-resident ratios and an environment designed to reduce confusion and wandering risk.
Nursing Home Licensed facility providing 24/7 skilled nursing care for residents with complex, ongoing medical needs. Staffed by RNs, LPNs, and CNAs. Inspected and star-rated annually by CMS. Accepts Medicare (short-term rehab) and Medicaid (long-term care).
Assisted Living A licensed, long-term care setting for seniors or individuals with disabilities who need help with daily activities — like bathing, dressing, and medication management — but not 24-hour skilled nursing. Offers housing, meals, and around-the-clock support while aiming to maximize resident independence.
Independent Living Lifestyle-focused communities for older adults offering dining, activities, and transportation with minimal personal care. Best for active, independent seniors who want community without medical support.
Memory Care Secured, specialized care for people living with Alzheimer's or dementia. Staff trained in cognitive impairment, with higher staff-to-resident ratios and an environment designed to reduce confusion and wandering risk.
Respite Care Short-term temporary care — days to weeks — to give family caregivers a break. Full care provided during the stay. Often used after hospitalization or to trial a facility before a permanent placement decision.
Independent Living Lifestyle-focused communities for older adults offering dining, activities, and transportation with minimal personal care. Best for active, independent seniors who want community without medical support.
![]() 8.8 miles from city center
8.8 miles from city center
Add your location
This data corresponds to Q2 2025 and is based on CMS Payroll-Based Journal.
Michigan average ratio: 1.75:1
Michigan average: 7.9 hours
Manages medical care and health needs.
No contractors work on this role.
Assists with medical care and medications.
This role is partially covered by contractors.
Helps with daily care and mobility.
This role is partially covered by contractors.
Total hours from contractors
1,381 contractor hours this quarter
| Certified Nursing Assistant | 81 | 1 | 82 | 23,440 | 91 | 100% | 7.9 |
| Licensed Practical Nurse | 41 | 27 | 68 | 13,924 | 91 | 100% | 9.5 |
| Clinical Nurse Specialist | 4 | 1 | 5 | 1,621 | 68 | 75% | 7.9 |
| Speech Language Pathologist | 6 | 0 | 6 | 1,522 | 78 | 86% | 7.8 |
| Registered Nurse | 7 | 0 | 7 | 1,487 | 81 | 89% | 9.4 |
| Respiratory Therapy Technician | 9 | 0 | 9 | 1,460 | 83 | 91% | 6.5 |
| Physical Therapy Assistant | 8 | 0 | 8 | 1,249 | 89 | 98% | 6 |
| Nurse Practitioner | 2 | 0 | 2 | 944 | 65 | 71% | 8 |
| RN Director of Nursing | 2 | 0 | 2 | 892 | 64 | 70% | 8.1 |
| Other Dietary Services Staff | 3 | 0 | 3 | 809 | 66 | 73% | 7.8 |
| Administrator | 1 | 0 | 1 | 512 | 64 | 70% | 8 |
| Occupational Therapy Aide | 1 | 0 | 1 | 488 | 61 | 67% | 8 |
| Qualified Social Worker | 2 | 0 | 2 | 463 | 70 | 77% | 5.4 |
| Dietitian | 1 | 0 | 1 | 440 | 58 | 64% | 7.6 |
| Mental Health Service Worker | 1 | 0 | 1 | 392 | 49 | 54% | 8 |
| Physical Therapy Aide | 3 | 0 | 3 | 217 | 34 | 37% | 5.5 |
| Occupational Therapy Assistant | 0 | 1 | 1 | 13 | 1 | 1% | 12.5 |
| Medical Director | 0 | 1 | 1 | 11 | 11 | 12% | 1 |
Source: CMS Long-Term Care Facility Characteristics (Data as of Jan 2026)
Residents meet regularly to discuss policies, care quality, and activities
Part of a Continuing Care Retirement Community offering multiple care levels
Organized group of residents that meets regularly to discuss facility policies, quality of life, and activities.
Data sourced from CMS Long-Term Care Facility Characteristics quarterly report. Payer mix reflects the current resident census by primary payment source.
These measures show how residents usually do over time at this home, based on health outcomes and preventive care.
Michigan average: 8.4
Michigan average: 16.3
Michigan average: 12.5%
Michigan average: 15.3%
Michigan average: 21.0%
Michigan average: 3.2%
Michigan average: 5.7%
Michigan average: 1.7%
Michigan average: 5.7%
Michigan average: 3.9%
Michigan average: 15.0%
Michigan average: 94.9%
Michigan average: 95.0%
Michigan average: 82.5%
Michigan average: 1.4%
Michigan average: 79.5%
Quality measures are calculated from Minimum Data Set (MDS) assessments. For most measures, lower percentages indicate better care quality.
Federal penalties imposed by CMS for regulatory violations, including civil money penalties (fines) and denials of payment for new Medicare/Medicaid admissions.
Source: CMS Penalties Database (Data as of Jan 2026)
Michigan average: $76K
Michigan average: 2.0
Michigan average: 0.8
Penalties are imposed by CMS for violations of federal nursing home regulations.
Last updated: Jan 2026
Historical financial and operational data for Canterbury-on-the-Lake based on CMS SNF Cost Reports.
Loading trend charts...
Care Cost Calculator: See Prices in Your Area
Nursing Home Data Explorer
Don’t Wait Too Long: 7 Red Flag Signs Your Parent Needs Assisted Living Now
The True Cost of Assisted Living in 2025 – And How Families Are Paying For It
Understanding Senior Living Costs: Pricing Models, Discounts & Financial Assistance

Touring a community? Use this expert-backed checklist to stay organized, ask the right questions, and find the perfect fit.
We'll send you a PDF version of the touring checklist.