Canterbury-on-the-Lake
Nursing Home, Independent Living, Assisted Living, Memory Care & Skilled Nursing · Michigan, MI
CMS overall rating Info The Overall CMS Rating is scored from 1 to 5 stars and combines results from health inspections, staffing levels, and quality measures. Health inspections carry the most weight. Staffing and quality scores can increase or decrease the final rating based on performance compared to state and national standards.

Canterbury-on-the-Lake

Nursing Home, Independent Living, Assisted Living, Memory Care & Skilled Nursing · Michigan, MI
CMS overall rating Info The Overall CMS Rating is scored from 1 to 5 stars and combines results from health inspections, staffing levels, and quality measures. Health inspections carry the most weight. Staffing and quality scores can increase or decrease the final rating based on performance compared to state and national standards.
Calculator: See prices in your area
Canterbury-on-the-Lake accepts Medicare, Medicaid, and private pay.

Overview of Canterbury-on-the-lake

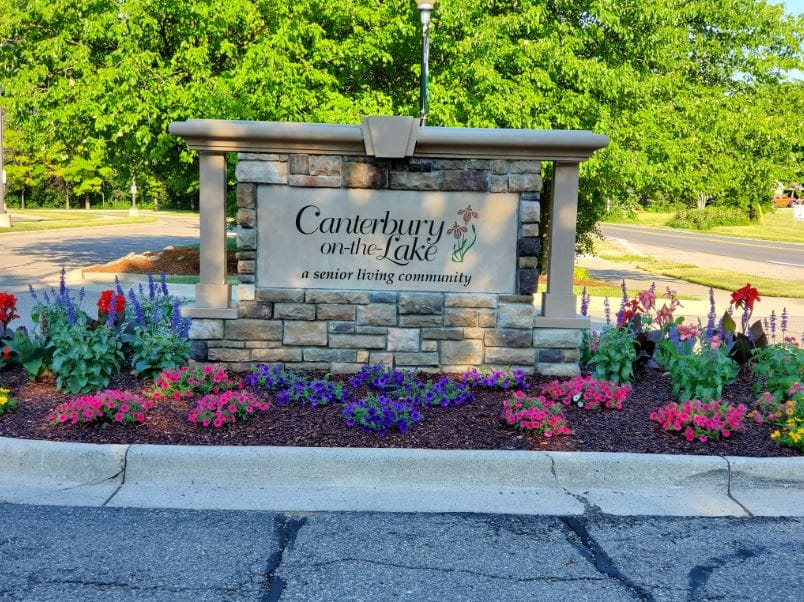
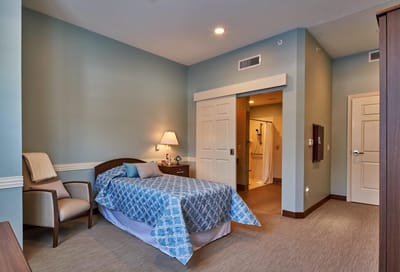
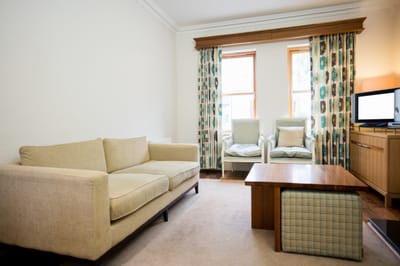
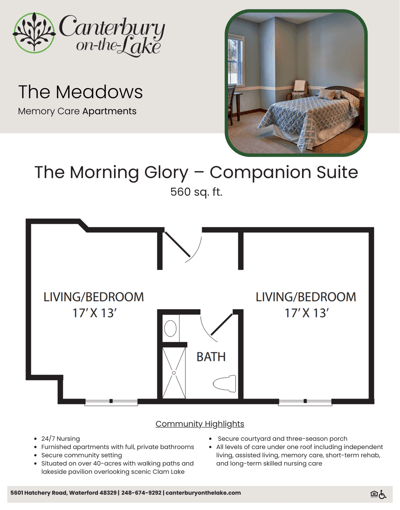
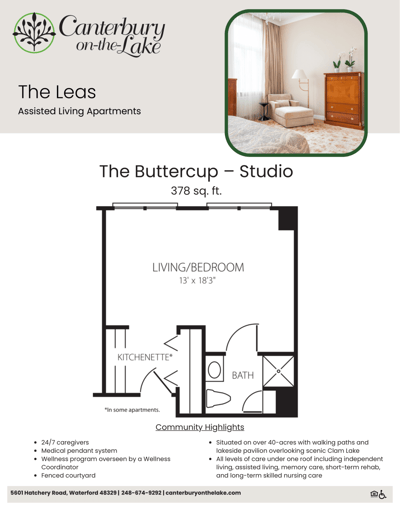
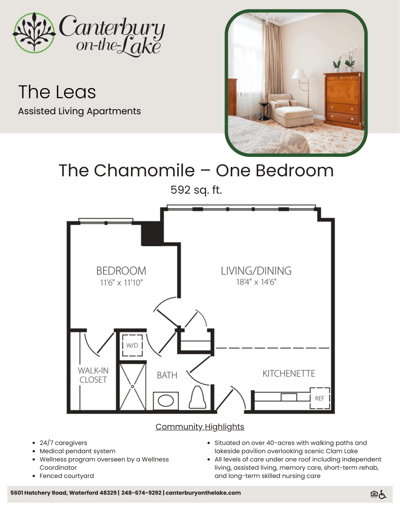
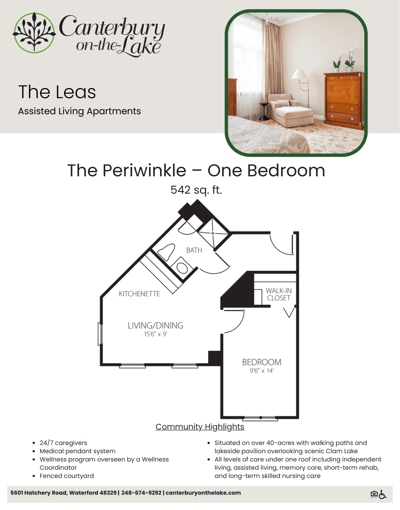
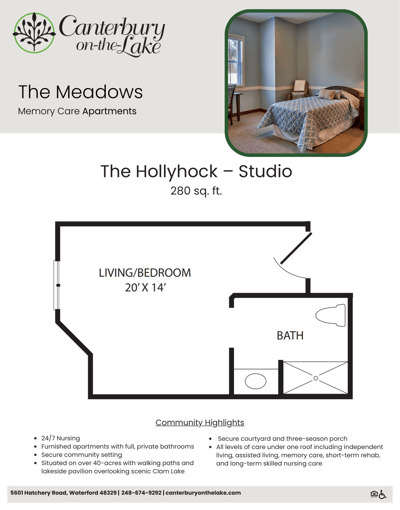
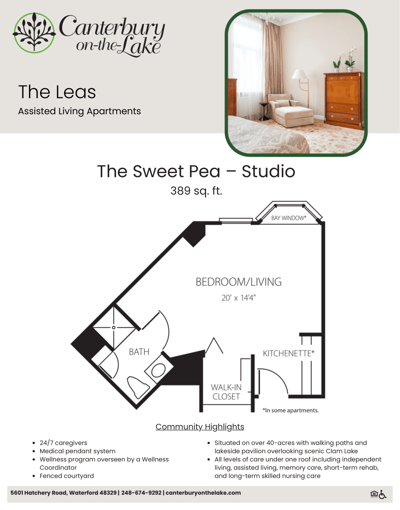
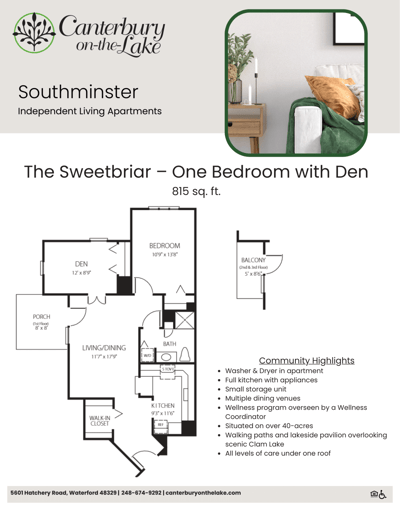
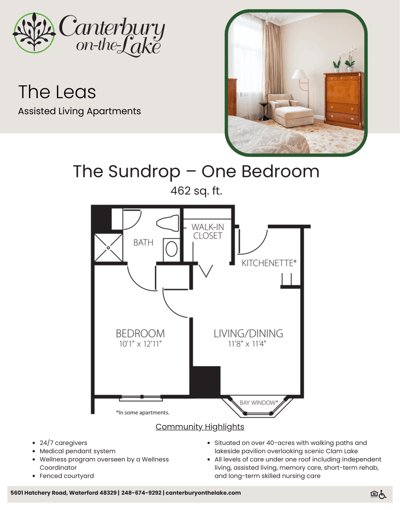
Set on 40 acres of lush and wooded area in Oakland County, Waterford, MI, Canterbury-on-the-lake is a thriving senior living community that offers various living options, including independent living, assisted living, memory care, and skilled nursing. The community offers a wide variety of beautifully designed residential options with bright, sunny interiors, fully equipped kitchen, and other modern conveniences. Residents receive the extra help they need – when they need it with a dedicated team available to lend a helping hand 24/7.

Residents live a vibrant and fulfilling life, thanks to the community’s wide variety of life-enriching activities, events, and classes. The community also offers a broad array of convenient amenities, including an art studio, business center, outdoor entertainment spaces, and beautiful gardens, walking paths, and a covered lakeside pavilion with seating for a peaceful alone time. Here, residents enjoy delicious, fresh, healthy, restaurant-style meals with multiple menu options in the beautifully appointed Orchid Dining Room, guaranteeing residents eat healthy and always feel energized to lead an active lifestyle.

Quality ratings

Measured by Centers for Medicare & Medicaid Services (CMS)

Overall rating Info The Overall CMS Rating combines results from health inspections, staffing levels and quality measures. Health inspections carry the most weight. Staffing and quality scores can increase or decrease the final rating based on performance compared to state and national standards.
▼ 71.8% Below MI avg. ▼ 71.8% Below MI avg.Click the badge to see the full State ranking.Click here to see the full State ranking.
Health Inspection Info Based on the results of the facility's three most recent standard inspections and any complaint investigations. CMS reviews the number, scope, and severity of deficiencies, with more recent findings weighted more heavily.
▼ 70.0% Below MI avg. ▼ 70.0% Below MI avg.Click the badge to see the full State ranking.Click here to see the full State ranking.
Staffing Info Measures average nursing staff hours per resident per day, including Registered Nurses (RNs) and total nursing staff. Ratings are adjusted based on the level of care residents require and are compared to state and national benchmarks.
▼ 40.5% Below MI avg. ▼ 40.5% Below MI avg.Click the badge to see the full State ranking.Click here to see the full State ranking.
Quality Measures Info Based on clinical and physical health indicators reported to CMS, such as hospital readmissions, falls, pressure ulcers, and improvements in mobility. These measures reflect how well residents' health needs are being managed.
▼ 21.3% Below MI avg. ▼ 21.3% Below MI avg.Click the badge to see the full State ranking.Click here to see the full State ranking.

Staffing hours breakdown

Info Daily nursing hours per resident by staff type, reported to CMS. Higher is generally better — compare this facility to state and national averages to see where staffing stands.

Hours per resident per day — compared to Michigan state averages

Total nursing care / resident Info This home is ranked 67th out of 133 homes in Michigan. Total adjusted nursing hours per resident per day, combining RN, LPN, and aide time. CMS adjusts this for case-mix so facilities can be fairly compared.
3h 58m per day
Rank #67 / 133Nurse hours — State benchmarkedThis home is ranked 67th out of 133 homes in Michigan. Shows adjusted nurse hours per resident per day benchmarked to the Michigan average, with a ranking across 133 Michigan SNFs. More hours mean more direct care. The national average is about 3.5 hrs; below 3.0 is a red flag.Click the rank badge to see the full State ranking.Click here to see the full State ranking.
This facility Michigan avg (4h 15m per day)
vs Michigan avg
-7%

0 of 1 metrics below state avg

Staff typeHours / Day / Residentvs state avg
Weekend Total Nursing Info Combined nursing hours (RN + LPN + Nurse Aide) per resident per day on weekends. Staffing often drops on weekends — this figure reveals whether the facility maintains adequate coverage outside of weekday hours. 3h 29m per day ■ Avg State avg: 3h 31m per day · National avg: 3h 26m per day

Types of Care at Canterbury-on-the-Lake

Independent Living Assisted Living Memory Care Skilled Nursing

Capacity and availability

This home usually has availability

Occupancy lower than 85% suggests more openings may be available.

Higher occupancy than the Michigan average: 75.8%
Occupancy rate 77.9% Rank #89 / 386Occupancy rate — State benchmarkedThis home is ranked 89th out of 386 homes in Michigan. Shows this facility's occupancy rate versus the Michigan average, with its Statewide rank out of 386. Higher occupancy signals strong local demand and financial stability.Click the rank badge to see the full State ranking.Click here to see the full State ranking.
Avg. Length of Stay 64 days
Occupancy rate
77.9% Rank #89 / 386Occupancy rate — State benchmarkedThis home is ranked 89th out of 386 homes in Michigan. Shows this facility's occupancy rate versus the Michigan average, with its Statewide rank out of 386. Higher occupancy signals strong local demand and financial stability.Click the rank badge to see the full State ranking.Click here to see the full State ranking.
Avg. Length of Stay
64 days
Years in operation
31 years in operation Rank #67 / 302Years in operation — State benchmarkedThis home is ranked 67th out of 302 homes in Michigan. Shows how long this facility has been in operation compared to other Michigan SNFs. Longer operating histories may benefit residents, families, and staff.Click the rank badge to see the full State ranking.Click here to see the full State ranking.
A longer operating history, which may indicate experience navigating regulations and delivering ongoing care.
Walk Score
Walk Score: 22 / 100 Rank #507 / 702Walk Score — State benchmarkedThis home is ranked 507th out of 702 homes in Michigan. Shows how walkable this facility's neighborhood is compared to the average Walk Score across Michigan SNFs. Higher scores benefit residents, families, and staff.Click the rank badge to see the full State ranking.Click here to see the full State ranking.
Car-dependent. Most errands require a car, with limited nearby walkable options.
BBB Rating
BBB Rating: A+ (Not Accredited)
An independent rating from the Better Business Bureau based on factors such as complaint history, transparency, and business practices.
How BBB ratings work

About this community

License Details

CMS Certification Number235555

Staffing

Key information about the people who lead and staff this community.

Leadership

ContactMs. Rochelle Rothwell, Executive Director

Therapy & Rehabilitation

2 services
Rehabilitation Services
Short-Term Rehab

Staffing & Medical

1 service
24-Hour Staffing

Amenities & Lifestyle

Specific ProgramsSkilled Nursing & Rehabilitation
Operating HoursMonday-Sunday, 8am-8pm

Contact Canterbury-on-the-Lake

Inspection History

In Michigan, the Department of Licensing and Regulatory Affairs (LARA) conducts unannounced inspections and investigations to ensure long-term care facilities comply with state health codes.

Read the full inspection reports for this facility, including detailed findings and corrective actions.

Show Inspection Reports

Health Inspection History

Inspections since 2024
Total health inspections 14

Michigan average 6.5


Last Health inspection on Oct 2025

Total health citations
78 Rank #132 / 135Health citations — State benchmarkedThis home is ranked 132nd out of 135 homes in Michigan. Shows this facility's total health deficiency citations benchmarked to the Michigan State average, with a ranking across all 135 MI SNFs. Lower citation counts earn a better rank.Click the rank badge to see the full State ranking.Click here to see the full State ranking.

Michigan average 33.5

Citations per inspection
5.57 Rank #80 / 135Citations per inspection — State benchmarkedThis home is ranked 80th out of 135 homes in Michigan. Shows average deficiency citations per CMS inspection for this facility versus the Michigan mean across 135 SNFs with citation data. Lower is better.Click the rank badge to see the full State ranking.Click here to see the full State ranking.

Michigan average 5.18


Health citations are formal notices following inspections when they fail to comply with safety and care standards.

35 of 78 citations resulted from standard inspections; 27 of 78 resulted from complaint investigations; and 16 of 78 came from combined inspections (standard and complaint).

Breakdown of citation severity (last 2 years)
Critical health citations
0
100% better than Michigan average

Michigan average: 0.3


Serious health citations
6
216% worse than Michigan average

Michigan average: 1.9

0 critical citations Michigan average: 0.3

6 serious citations Michigan average: 1.9

71 moderate citations Michigan average: 30.8

1 minor citation Michigan average: 0.5
Citations history (last 2 years)
Infection Control moderate citation Oct 24, 2025
Corrected

Nursing Services moderate citation Oct 24, 2025
Corrected

Quality of Care moderate citation Oct 24, 2025
Corrected

Resident Rights moderate citation Oct 24, 2025
Corrected

Staffing Data

Reporting period: October 1 – December 31, 2025 (Q4 2025). Source: CMS Payroll-Based Journal report.

Total staff 205
Employees 176
Contractors 29
Staff to resident ratio 1.77:1
0% compared with Michigan average
Michigan average ratio: 1.70:1 Michigan average ratio: 1.70:1See full Michigan ranking
Avg staff/day 63
Average shift 8 hours
0% compared with Michigan average
Michigan average: 7.9 hours Michigan average shift: 7.9 hoursSee full Michigan ranking
Total staff hours (quarter) 46,437

Nursing staff breakdown

Q4 2025 · Oct 1 – Dec 31 More info This data comes from the CMS Payroll-Based Journal report covering October 1 – December 31, 2025.
Registered Nurse

Manages medical care and health needs.

RN Staff 9
Average shift length Info Average shift length. Calculated as total hours divided by days worked and average staff per day. 10.1 hours

No contractors work on this role.

Licensed Practical Nurse

Assists with medical care and medications.

LPN Staff 63
Average shift length Info Average shift length. Calculated as total hours divided by days worked and average staff per day. 9.6 hours

This role is partially covered by contractors.

Certified Nursing Assistant

Helps with daily care and mobility.

CNA Staff 76
Average shift length Info Average shift length. Calculated as total hours divided by days worked and average staff per day. 7.7 hours

No contractors work on this role.

Contractor staffing

Q4 2025 · Oct 1 – Dec 31 More info This data comes from the CMS Payroll-Based Journal report covering October 1 – December 31, 2025.

Total hours from contractors

1.6%

725 contractor hours this quarter

Licensed Practical Nurse: 24 Clinical Nurse Specialist: 2 Nurse Practitioner: 1 Medical Director: 1 Occupational Therapy Assistant: 1

Staff by category

Q4 2025 · Oct 1 – Dec 31 More info This data comes from the CMS Payroll-Based Journal report covering October 1 – December 31, 2025.
Certified Nursing Assistant7607620,64992100%7.7
Licensed Practical Nurse39246312,67892100%9.6
Speech Language Pathologist7072,2788491%7.7
Clinical Nurse Specialist6281,6177480%7.9
Respiratory Therapy Technician9091,4988795%7
Physical Therapy Assistant9091,4109199%6.3
Registered Nurse9099926773%10.1
Other Dietary Services Staff2028926571%7.7
Nurse Practitioner2138486672%8
Physical Therapy Aide5057647582%8
RN Director of Nursing3036496267%7.8
Administrator1015046368%8
Mental Health Service Worker2024965863%8
Occupational Therapy Aide1014725964%8
Dietitian1014555863%7.8
Qualified Social Worker4041936368%2.9
Occupational Therapy Assistant0113133%10.3
Medical Director011141415%1
76 Certified Nursing Assistant
% of Days 100%
63 Licensed Practical Nurse
% of Days 100%
7 Speech Language Pathologist
% of Days 91%
8 Clinical Nurse Specialist
% of Days 80%
9 Respiratory Therapy Technician
% of Days 95%
9 Physical Therapy Assistant
% of Days 99%
9 Registered Nurse
% of Days 73%
2 Other Dietary Services Staff
% of Days 71%
3 Nurse Practitioner
% of Days 72%
5 Physical Therapy Aide
% of Days 82%
3 RN Director of Nursing
% of Days 67%
1 Administrator
% of Days 68%
2 Mental Health Service Worker
% of Days 63%
1 Occupational Therapy Aide
% of Days 64%
1 Dietitian
% of Days 63%
4 Qualified Social Worker
% of Days 68%
1 Occupational Therapy Assistant
% of Days 3%
1 Medical Director
% of Days 15%

Penalties and fines

Includes penalties issued in 2023

Federal penalties imposed by CMS for regulatory violations, including civil money penalties (fines) and denials of payment for new Medicare/Medicaid admissions.

Source: CMS Penalties Database (Data as of Jan 2026)

Total fines amount $126K Rank #121 / 136Federal fines — State benchmarkedThis home is ranked 121st out of 136 homes in Michigan. Shows this facility's cumulative CMS federal fine dollars versus the Michigan average among facilities with fines, and where it ranks among 136 skilled nursing facilities in the pool. Lower total dollars mean a better rank.Click the rank badge to see the full State ranking.Click here to see the full State ranking.
65% higher than Michigan average

Michigan average: $76K

Number of fines 3
48% more fines than Michigan average

Michigan average: 2.0

Payment Denials Info Serious action where Medicare and/or Medicaid temporarily stops payments for new residents until issues are fixed. 2
137% more payment denials than Michigan average

Michigan average: 0.8

Fines amount comparison
This facility $126K
Michigan average $76K
Penalty History

Penalties are imposed by CMS for violations of federal nursing home regulations.

3 penalties in the past 3 years

Multiple penalties were reported in the last 3 years.

Civil Money Penalty Info Fines imposed for noncompliance, which can be assessed per day or per instance of violation. Sep 7, 2023
$45K
Payment Denial Info Serious action where Medicare and/or Medicaid temporarily stops payments for new residents until issues are fixed. Sep 7, 2023
2 days
Civil Money Penalty Info Fines imposed for noncompliance, which can be assessed per day or per instance of violation. Jun 29, 2023
$52K

Last updated: Jan 2026

Quality of care over time

These measures show how residents usually do over time at this home, based on health outcomes and preventive care.

High-risk clinical events score Info A composite score based on pressure ulcers, falls with injury, weight loss, walking ability decline, and activities of daily living decline. 15.5
85% worse than Michigan average

Michigan average: 8.4

Functional decline score Info A composite score based on activities of daily living decline, walking ability decline, and incontinence. 24.7
52% worse than Michigan average

Michigan average: 16.3

Long-stay resident measures
Below average Michigan avg: 4.1 Info CMS star rating based on long-stay quality measure performance. 5 stars = significantly above average, 1 star = significantly below average.
Need for Help with Daily Activities Increased Info Percent of long-stay residents whose need for help with daily activities has increased 25.1%
101% worse than Michigan average

Michigan average: 12.5%

Walking Ability Worsened Info Percent of long-stay residents whose ability to move independently worsened 28.5%
86% worse than Michigan average

Michigan average: 15.3%

Low Risk Residents with Bowel/Bladder Incontinence Info Percent of low risk long-stay residents who lose control of their bowels or bladder 20.6%
In line with Michigan average

Michigan average: 21.0%

Falls with Major Injury Info Percent of long-stay residents experiencing one or more falls with major injury 4.3%
35% worse than Michigan average

Michigan average: 3.2%

High Risk Residents with Pressure Ulcers Info Percent of long-stay high risk residents with pressure ulcers 9.6%
66% worse than Michigan average

Michigan average: 5.7%

Urinary Tract Infection Info Percent of long-stay residents with a urinary tract infection 5.1%
204% worse than Michigan average

Michigan average: 1.7%

Lost Too Much Weight Info Percent of long-stay residents who lose too much weight 10.3%
82% worse than Michigan average

Michigan average: 5.7%

Depressive Symptoms Info Percent of long-stay residents who have depressive symptoms 3.8%
In line with Michigan average

Michigan average: 3.9%

Antipsychotic Use Info Percent of long-stay residents who received an antipsychotic medication 18.2%
22% worse than Michigan average

Michigan average: 15.0%

Pneumococcal Vaccine Info Percent of long-stay residents assessed and appropriately given the pneumococcal vaccine 85.3%
10% worse than Michigan average

Michigan average: 94.9%

Influenza Vaccine Info Percent of long-stay residents assessed and appropriately given the seasonal influenza vaccine 72.9%
23% worse than Michigan average

Michigan average: 95.0%

Hospitalizations per 1,000 days Info Number of hospitalizations per 1,000 long-stay resident days. 1.45
17% better than Michigan average

Michigan average: 1.74

ED visits per 1,000 days Info Number of outpatient emergency department visits per 1,000 long-stay resident days. 0.78
49% better than Michigan average

Michigan average: 1.54

Short-stay resident measures
Significantly above average Michigan avg: 3.3 Info CMS star rating based on short-stay quality measure performance. 5 stars = much above average, 1 star = much below average.
Pneumococcal Vaccine Info Percent of short-stay residents assessed and appropriately given the pneumococcal vaccine 63.0%
24% worse than Michigan average

Michigan average: 82.5%

Antipsychotic medication increase Info Percent of short-stay residents who newly received an antipsychotic medication 1.1%
26% better than Michigan average

Michigan average: 1.4%

Influenza Vaccine Info Percent of short-stay residents assessed and appropriately given the seasonal influenza vaccine 42.7%
46% worse than Michigan average

Michigan average: 79.5%

Re-hospitalized after SNF stay Info Percentage of short-stay residents who were re-hospitalized after their nursing home admission. 21.3%
12% better than Michigan average

Michigan average: 24.2%

Emergency department visits Info Percentage of short-stay residents who had an outpatient emergency department visit. 7.5%
35% better than Michigan average

Michigan average: 11.5%

Falls with major injury Info Percentage of SNF residents who experience falls with major injury during their stay. 1.2%
55% worse than Michigan average

Michigan average: 0.8%

Ability to care for self at discharge Info Percentage of residents at or above expected ability to care for themselves at discharge. 54.0%
In line with Michigan average

Michigan average: 53.7%

Successful return to home or community Info Rate of successful return to home or community from a skilled nursing facility. 58.2%
15% better than Michigan average

Michigan average: 50.6%

Breakdown by payment type

Medicare

32% of new residents, usually for short-term rehab.

Typical stay 20 days

Private pay

53% of new residents, often for short stays.

Typical stay 29 days

Medicaid

15% of new residents, often for long-term daily care.

Typical stay 8 months

Facility Characteristics

Source: CMS Long-Term Care Facility Characteristics (Data as of Jan 2026)

Total residents 116
Medicare
15
12.9% of residents
Medicaid
52
44.8% of residents
Private pay or other
49
42.2% of residents
Programs & Services
Residents Group

Residents meet regularly to discuss policies, care quality, and activities

CCRC

Part of a Continuing Care Retirement Community offering multiple care levels

Active Resident Council

Organized group of residents that meets regularly to discuss facility policies, quality of life, and activities.

Finances and operations

Voluntary non-profit community
Operated by a church.
Home revenue
$28.7M
Operating deficit
-$2.0M
Voluntary non-profit community Operated by a church.
Home revenue
$28.7M Rank #22 / 134Revenue — State benchmarkedThis home is ranked 22nd out of 134 homes in Michigan. Shows this facility's annual revenue compared to the Michigan SNF average. Higher revenue generally means more resources for staffing and capital — read alongside Payroll %.Click the rank badge to see the full State ranking.Click here to see the full State ranking.
Operating deficit
-$2.0M
Payroll costs Info The portion of the home's budget spent on staff, including nurses, caregivers, and other employees who support care and operations. Rank #14 / 134Payroll — State benchmarkedThis home is ranked 14th out of 134 homes in Michigan. Shows total annual staff payroll benchmarked to the Michigan average. Higher payroll investment relative to peers often signals better staffing and less reliance on cheaper contract labor.Click the rank badge to see the full State ranking.Click here to see the full State ranking.
$12.7M
44.4% of revenue Rank #58 / 134Payroll % — State benchmarkedThis home is ranked 58th out of 134 homes in Michigan. Shows payroll as a percentage of revenue versus the Michigan average. Well-run Michigan SNFs typically land around 49–59% — the top third Statewide. Below 25% may signal understaffing or heavy agency use — read with Staffing ratings.Click the rank badge to see the full State ranking.Click here to see the full State ranking.
Other operating costs Info All remaining costs needed to run the home, such as food, utilities, building maintenance, supplies and administrative expenses.
$18.0M
Total costs $30.7M

What does this home offer?

Housing options icon

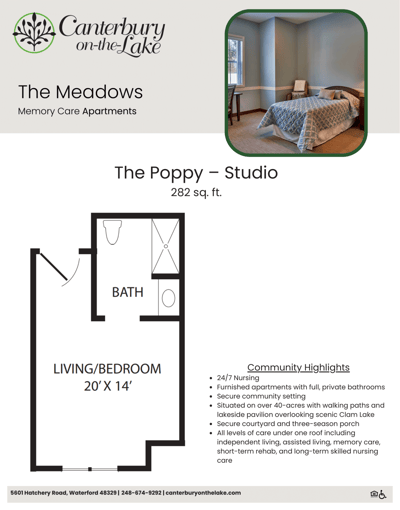
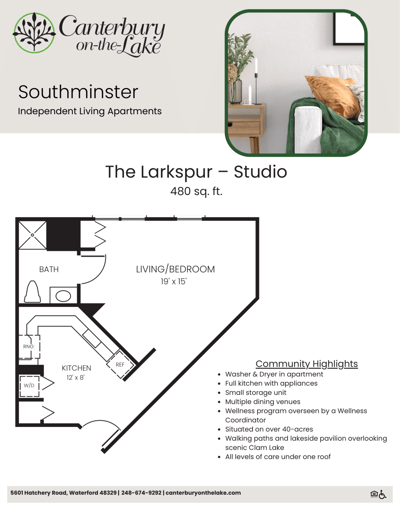
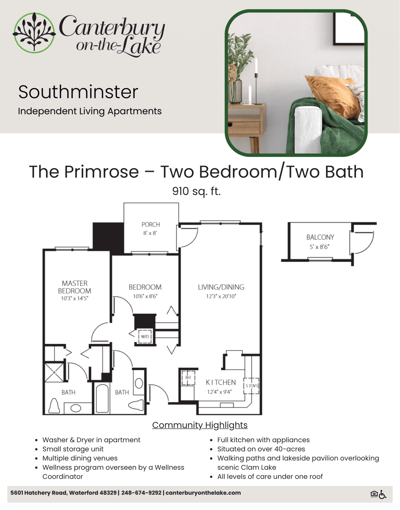
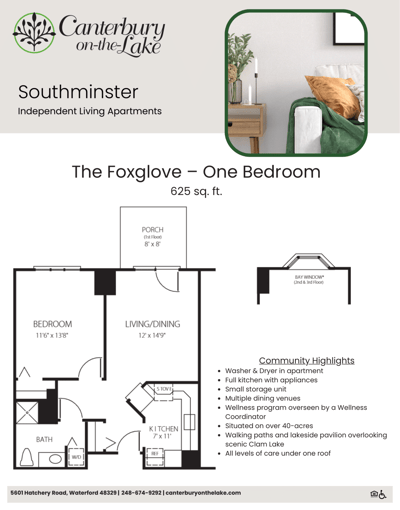
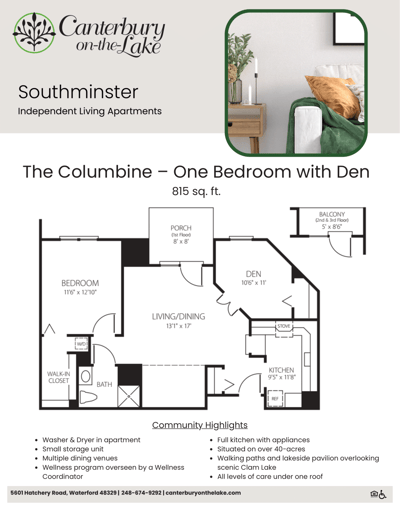
Housing Options: Studio / 1 Bed / 2 Bed

Building type icon
Building type icon

Building Type: 3-story

Transportation services icon

Transportation Services

Fitness and recreation icon

Fitness and Recreation

Who this home usually serves

TYPE OF STAY

Mix of rehab and long-term care

This home supports both short-term rehab and long-term care, with residents staying for a wide range of durations.

Places of interest near Canterbury-on-the-Lake

Address 8.8 miles from city center Info Estimated distance in miles from Waterford Twp's city center to Canterbury-on-the-Lake's address, calculated via Google Maps.

Calculate Travel Distance to Canterbury-on-the-Lake

Add your location

Address

Financial Assistance for
Nursing Home in Michigan

Canterbury-on-the-Lake is located in Waterford Twp, Michigan.
Here are the financial assistance programs available to residents in Michigan.

Get Financial aid guidance

MI Choice Waiver

Michigan Medicaid MI Choice Waiver

Age 65+ or disabled
General Michigan resident, Medicaid- eligible, nursing home-level care need.
Income Limits (2025) ~$2,829/month 300% FBR, individual
Asset Limits $2,000 (individual), $3,000 (couple).
MI

Delivered through regional waiver agents; waitlists possible.

Benefits
Personal care (5-7 hours/day) Respite care (240 hours/year) Home modifications ($1,500 avg.) Adult day care ($65/day)

Home Help Program

Michigan Home Help

Age 65+ or disabled
General Michigan resident, Medicaid- eligible or low-income.
Income Limits ~$1,732/month individual, Medicaid threshold
Asset Limits $2,000 individual
MI

Can hire family caregivers; less intensive than waiver.

Benefits
Personal care (up to 60 hours/month) Homemaker services Respite (varies)

Program of All-Inclusive Care for the Elderly (PACE)

Michigan PACE

Age 55+
General Michigan resident, nursing home-level care need, safe with PACE support.
Income Limits (2025) ~$2,829/month (Medicaid-eligible); private pay option available.
Asset Limits $2,000 (individual), $3,000 (couple).
MI

16 PACE centers (e.g., Ingham, Wayne counties); expanding slowly.

Benefits
Personal care (5-7 hours/day) Medical care Meals Transportation Therapy Respite

Medicare Savings Program (MSP)

Michigan Medicare Savings Program

Age 65+ or disabled
General Michigan resident, Medicare Part A/B.
Income Limits (2025) ~$2,510/month (QMB), ~$3,380/month (SLMB), ~$3,598/month (QI)—individual.
Asset Limits $9,430 (individual), $14,130 (couple).
MI

Three tiers; no waitlist; includes Extra Help for Part D.

Benefits
Covers Part B premiums ($174.70/month) Deductibles ($240/year) Copays (~20%)

National Family Caregiver Support Program (NFCSP) Respite

Michigan NFCSP Respite Care

Age
General Caregivers of 60+ needing care or 55+ caregivers of others; Michigan resident; functional needs (2+ ADLs).
Income Limits (2025) Prioritizes ~$24,980/year (individual); no strict cap.
Asset Limits Not assessed; need-based.
MI

16 AAAs; prioritizes low-income, rural caregivers.

Benefits
Respite (4-6 hours/week or 5 days/year) Adult day care ($60/day) Caregiver training

VA Aid and Attendance (A&A) and Housebound Benefits

Michigan VA Aid and Attendance/Housebound

Age 65+ or disabled veteran/spouse
General Michigan resident, wartime service, need for ADL help (A&A) or homebound.
Income Limits (2025) Net income < ~$1,984/month (veteran with dependent, A&A); pension offsets income.
Asset Limits ~$155,356 net worth limit
MI

High veteran demand in urban/rural areas.

Benefits
Cash (~$1,433-$2,642/month veteran, ~$951-$1,318 spouse) for care costs

Compare Nursing Home around Oakland County

2 facilities compared · CMS & MI Dept. of Health data

Filter by care type
Lourdes Senior Community
NH

Nursing Home Licensed facility providing 24/7 skilled nursing care for residents with complex, ongoing medical needs. Staffed by RNs, LPNs, and CNAs. Inspected and star-rated annually by CMS. Accepts Medicare (short-term rehab) and Medicaid (long-term care).

AL

Assisted Living A licensed, long-term care setting for seniors or individuals with disabilities who need help with daily activities — like bathing, dressing, and medication management — but not 24-hour skilled nursing. Offers housing, meals, and around-the-clock support while aiming to maximize resident independence.

IL

Independent Living Lifestyle-focused communities for older adults offering dining, activities, and transportation with minimal personal care. Best for active, independent seniors who want community without medical support.

MC

Memory Care Secured, specialized care for people living with Alzheimer's or dementia. Staff trained in cognitive impairment, with higher staff-to-resident ratios and an environment designed to reduce confusion and wandering risk.

Waterford Twp (Watkins-Pontiac Estates)100 69.2% -9%4.06 +37%-5%$15.6k113.7173- 8 Richard Acho$16.2M$6.3M38.9%235252
Canterbury-on-the-Lake
NH

Nursing Home Licensed facility providing 24/7 skilled nursing care for residents with complex, ongoing medical needs. Staffed by RNs, LPNs, and CNAs. Inspected and star-rated annually by CMS. Accepts Medicare (short-term rehab) and Medicaid (long-term care).

AL

Assisted Living A licensed, long-term care setting for seniors or individuals with disabilities who need help with daily activities — like bathing, dressing, and medication management — but not 24-hour skilled nursing. Offers housing, meals, and around-the-clock support while aiming to maximize resident independence.

IL

Independent Living Lifestyle-focused communities for older adults offering dining, activities, and transportation with minimal personal care. Best for active, independent seniors who want community without medical support.

MC

Memory Care Secured, specialized care for people living with Alzheimer's or dementia. Staff trained in cognitive impairment, with higher staff-to-resident ratios and an environment designed to reduce confusion and wandering risk.

Waterford Twp (Waterford Township)128 77.9% +3%3.97 -57%-8%$125.8k785.66112A+ 22 Leigh Mcleod$28.7M$12.7M44.4%235555

Frequently Asked Questions about Canterbury-on-the-Lake

What neighborhood is Canterbury-on-the-Lake in?

Canterbury-on-the-Lake is in the Waterford Township neighborhood of Waterford Twp.

Is Canterbury-on-the-Lake in a walkable area?

Canterbury-on-the-Lake has a walk score of 22. Car-dependent. Most errands require a car, with limited nearby walkable options.

Are there photos of Canterbury-on-the-Lake?

Yes — there are 19 photos of Canterbury-on-the-Lake in the photo gallery on this page.

What is the phone number of Canterbury-on-the-Lake?

(248) 674-9292 will put you in contact with the team at Canterbury-on-the-Lake.

Is Canterbury-on-the-Lake Medicare or Medicaid certified?

Yes — Canterbury-on-the-Lake is a CMS-certified provider of Medicare and Medicaid.

Guides for Better Senior Living

Care Cost Calculator: See Prices in Your Area

Nursing Home Data Explorer

Don’t Wait Too Long: 7 Red Flag Signs Your Parent Needs Assisted Living Now

The True Cost of Assisted Living in 2025 – And How Families Are Paying For It

Understanding Senior Living Costs: Pricing Models, Discounts & Financial Assistance

Explore Open Rooms
1 Contact details
2 What type of senior care service are you looking for?
3 What budget do you have in mind for senior care?
4 How soon do you need to find care?
5 Additional details

Thank you for your interest!

Our team will be in touch shortly to help with next steps.