


Total staff
253
Employees
72
Contractors
181
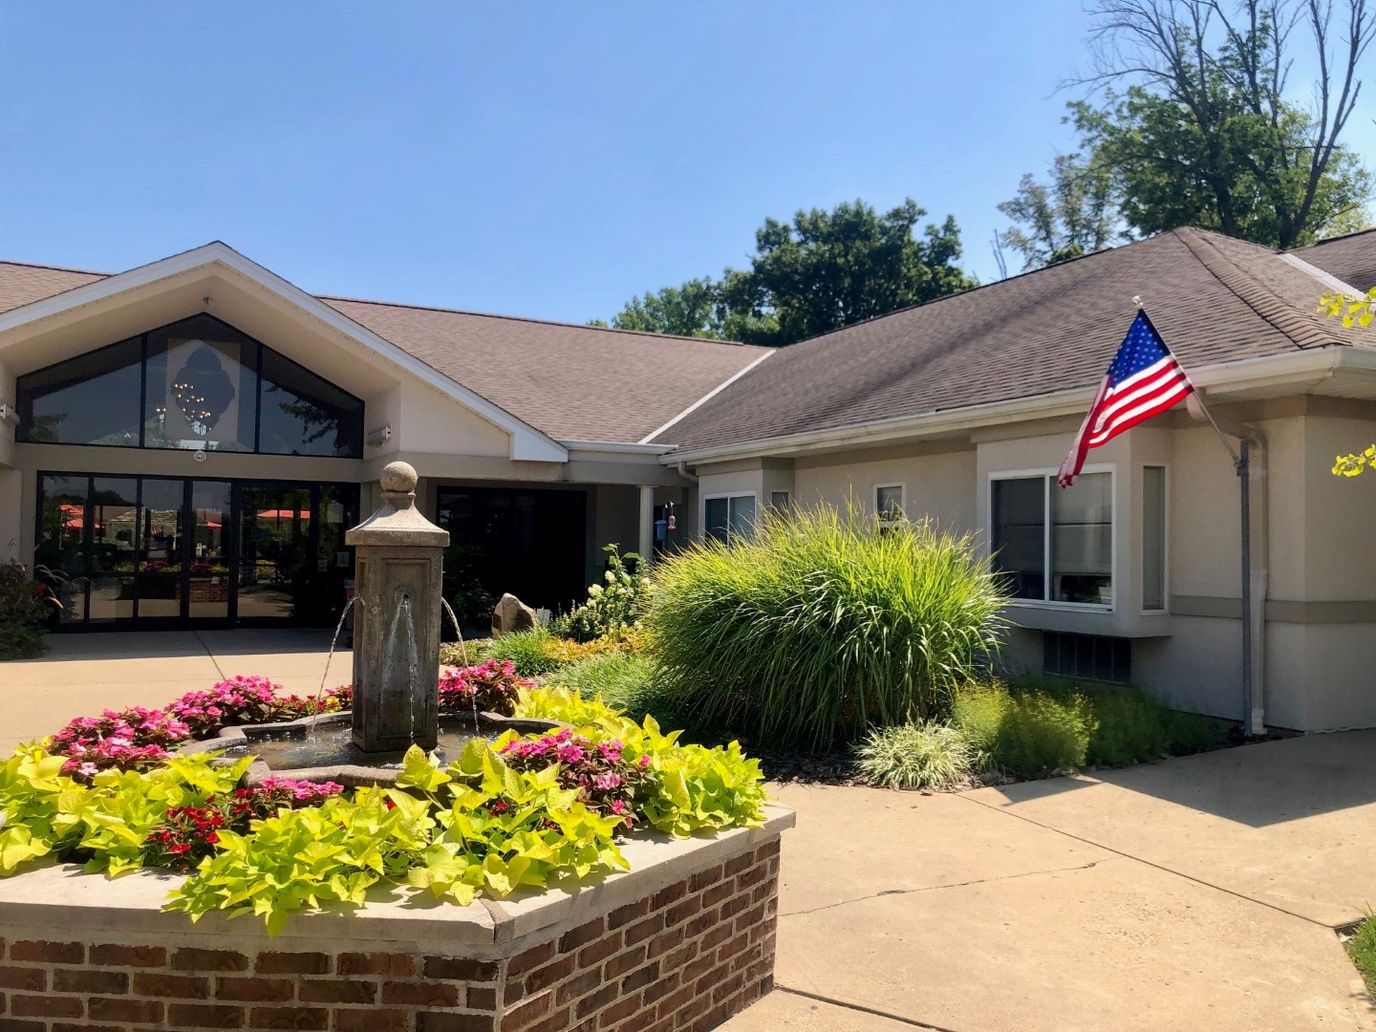
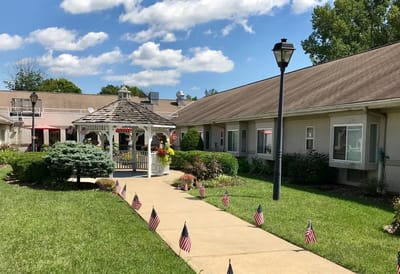
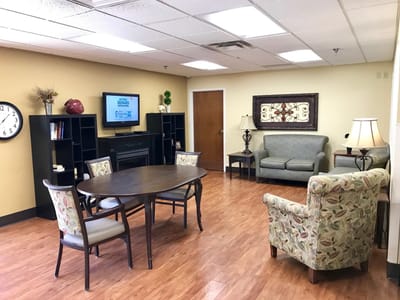
CareCore at Meadows is a welcoming care home in Cincinnati, OH, where care and compassion meet. Their array of private and semi-private accommodations are conveniently close to local amenities and foster a cozy, home-like atmosphere that makes residents feel safe and secure. Excellent care professionals are available 24/7 to provide tailored care and comprehensive assistance to residents.
Those living with memory conditions are given specialized units with advanced security features and specialized care services tailored to their unique needs. Engaging activities help residents stay physically active while nutritious meals give them the energy they need to maintain their nutrition. With CareCore at Meadows, residents can focus on living their best lives surrounded by genuine people who truly care about their happiness.
| Staff type | Hours / Day / Resident | vs state avg |
|---|---|---|
|
Registered Nurse (RN)
| 18m per day | ▼ 54% State avg: 38m per day · National avg: 41m per day |
|
LPN / LVN
| 1h 2m per day | ▲ 6% State avg: 58m per day · National avg: 52m per day |
|
Nurse Aide
| 1h 44m per day | ▼ 18% State avg: 2h 8m per day · National avg: 2h 21m per day |
|
Weekend Total Nursing
| 2h 46m per day | ▼ 16% State avg: 3h 17m per day · National avg: 3h 26m per day |
|
Physical Therapist
| 1m per day | ▼ 79% State avg: 3m per day · National avg: 4m per day |
|
Weekend RN
| 14m per day | ▼ 45% State avg: 25m per day · National avg: 29m per day |
Reporting period: October 1 – December 31, 2025 (Q4 2025). Source: CMS Payroll-Based Journal report.
Manages medical care and health needs.
Assists with medical care and medications.
Helps with daily care and mobility.
Total hours from contractors
6,956 contractor hours this quarter
| Certified Nursing Assistant | 34 | 115 | 149 | 13,949 | 92 | 100% | 9.6 |
| RN Director of Nursing | 21 | 0 | 21 | 6,312 | 92 | 100% | 10.2 |
| Licensed Practical Nurse | 1 | 37 | 38 | 1,932 | 87 | 95% | 8.8 |
| Registered Nurse | 9 | 18 | 27 | 1,897 | 92 | 100% | 9.3 |
| Other Dietary Services Staff | 3 | 0 | 3 | 1,124 | 88 | 96% | 7.5 |
| Speech Language Pathologist | 0 | 1 | 1 | 528 | 66 | 72% | 8 |
| Dietitian | 1 | 0 | 1 | 512 | 64 | 70% | 8 |
| Dental Services Staff | 1 | 0 | 1 | 496 | 62 | 67% | 8 |
| Administrator | 1 | 0 | 1 | 480 | 60 | 65% | 8 |
| Nurse Practitioner | 1 | 0 | 1 | 456 | 57 | 62% | 8 |
| Qualified Social Worker | 0 | 2 | 2 | 407 | 65 | 71% | 6.1 |
| Physical Therapy Aide | 0 | 1 | 1 | 342 | 65 | 71% | 5.3 |
| Occupational Therapy Aide | 0 | 2 | 2 | 130 | 13 | 14% | 5 |
| Physical Therapy Assistant | 0 | 2 | 2 | 110 | 35 | 38% | 3.1 |
| Medical Director | 0 | 1 | 1 | 104 | 13 | 14% | 8 |
| Respiratory Therapy Technician | 0 | 2 | 2 | 84 | 32 | 35% | 2.6 |
Federal penalties imposed by CMS for regulatory violations, including civil money penalties (fines) and denials of payment for new Medicare/Medicaid admissions.
Source: CMS Penalties Database
No penalties in the past 3 years
No civil money penalties or payment denials were reported in the last 3 years.
These measures show how residents usually do over time at this home, based on health outcomes and preventive care.
Ohio average: 5.8
Ohio average: 12.7
Ohio average: 6.8%
Ohio average: 8.9%
Ohio average: 22.0%
Ohio average: 3.4%
Ohio average: 3.9%
Ohio average: 0.5%
Ohio average: 6.2%
Ohio average: 24.0%
Ohio average: 8.4%
Ohio average: 92.4%
Ohio average: 94.5%
Ohio average: 78.0%
Ohio average: 1.3%
Ohio average: 75.6%
Quality measures are calculated from Minimum Data Set (MDS) assessments. For most measures, lower percentages indicate better care quality.
5% of new residents, usually for short-term rehab.
71% of new residents, often for short stays.
24% of new residents, often for long-term daily care.
Source: CMS Long-Term Care Facility Characteristics (Data as of Jan 2026)
Residents meet regularly to discuss policies, care quality, and activities
Organized group of residents that meets regularly to discuss facility policies, quality of life, and activities.
Data sourced from CMS Long-Term Care Facility Characteristics quarterly report. Payer mix reflects the current resident census by primary payment source.
Historical financial and operational data for CareCore at Meadows from 2011–2023, based on CMS SNF Cost Reports.
Key figures below are for fiscal year ending in 12/2023.
Based on CMS SNF Cost Report for fiscal year ending in 12/2023.
No pets allowed
Housing Options: Private / Semi-Private Rooms
Building Type: Single-story
Beauty Services
Transportation Services
Housekeeping Services
Recreational Activities
Most residents stay long-term, while a smaller portion are admitted for short-term rehab.
Most new residents arrive under private pay (71% of admissions), and a typical private pay stay runs around 2 - 3 months.
Coverage residents most often arrive under.
Coverage residents most often leave under.
![]() 11760 Pellston Ct, Cincinnati, OH 45240
11760 Pellston Ct, Cincinnati, OH 45240
Add your location
Info below is compiled from CMS reports & the OH Dept. of Health, senior community websites & trusted data sources such as Walk Score & BBB.
Communities are listed from highest to lowest based on our ranking methodology.
| Alois Alzheimer Center | NH HOS MC PC RC SNF | Cincinnati (Greenhills) | 93
Facility
93
OH AVG
75
Rank
#92 / 309 |
82.8%
Facility
82.8%
OH AVG
81.7
Rank
#86 / 138 | +1% | 4.12
Facility
4.12
OH AVG
3.54
Rank
#36 / 182 | -31% | +16% | $0
Facility
$0
OH AVG
$74.0k
Rank
#1 / 183 | 7
Facility
7
OH AVG
30.9
Rank
#14 / 183 | 3.5
Facility
3.5
OH AVG
4.6
Rank
#58 / 183 | - | 77 | - |
49
Facility
49
OH AVG
40
Rank
#263 / 704 | Boymel Operations Holdings Co LLC | $7.5MFiscal year ending 12/2023
Facility
$7.5MFiscal year ending 12/2023
OH AVG
$10.1M
Rank
#136 / 183 | $4.6MFiscal year ending 12/2023
Facility
$4.6MFiscal year ending 12/2023
OH AVG
$3.9M
Rank
#111 / 183 | 61.4%Fiscal year ending 12/2023
Facility
61.4%Fiscal year ending 12/2023
OH AVG
40.2%
Rank
#21 / 183 | 366489 | ||||
| Twin Towers | NH AL IL MC SNF | Cincinnati (College Hill) | 231
Facility
231
OH AVG
75
Rank
#1 / 309 |
31.2%
Facility
31.2%
OH AVG
81.7
Rank
#138 / 138 | -62% | 5.44
Facility
5.44
OH AVG
3.54
Rank
#8 / 182 | -14% | +54% | $0
Facility
$0
OH AVG
$74.0k
Rank
#1 / 183 | 13
Facility
13
OH AVG
30.9
Rank
#35 / 183 | 4.3
Facility
4.3
OH AVG
4.6
Rank
#99 / 183 | - | 72 | - |
31
Facility
31
OH AVG
40
Rank
#432 / 704 | Douglas Burgess | $10.7MFiscal year ending 12/2023
Facility
$10.7MFiscal year ending 12/2023
OH AVG
$10.1M
Rank
#38 / 183 | $5.8MFiscal year ending 12/2023
Facility
$5.8MFiscal year ending 12/2023
OH AVG
$3.9M
Rank
#63 / 183 | 54.5%Fiscal year ending 12/2023
Facility
54.5%Fiscal year ending 12/2023
OH AVG
40.2%
Rank
#163 / 183 | 366023 | ||||
| Beechwood Home | NH HOS SNF | Cincinnati (Evanston) | 80
Facility
80
OH AVG
75
Rank
#134 / 309 |
90.3%
Facility
90.3%
OH AVG
81.7
Rank
#41 / 138 | +10% | 4.61
Facility
4.61
OH AVG
3.54
Rank
#14 / 182 | -18% | +30% | $0
Facility
$0
OH AVG
$74.0k
Rank
#1 / 183 | 13
Facility
13
OH AVG
30.9
Rank
#35 / 183 | 3.3
Facility
3.3
OH AVG
4.6
Rank
#51 / 183 | - | 72 | - |
56
Facility
56
OH AVG
40
Rank
#186 / 704 | William Baechtold | $8.1MFiscal year ending 12/2023
Facility
$8.1MFiscal year ending 12/2023
OH AVG
$10.1M
Rank
#32 / 183 | $6.6MFiscal year ending 12/2023
Facility
$6.6MFiscal year ending 12/2023
OH AVG
$3.9M
Rank
#38 / 183 | 81.2%Fiscal year ending 12/2023
Facility
81.2%Fiscal year ending 12/2023
OH AVG
40.2%
Rank
#116 / 183 | 365445 | ||||
| Deupree House | NH AL IL MC | Cincinnati (Hyde Park) | 24
Facility
24
OH AVG
75
Rank
#285 / 309 |
82.9%
Facility
82.9%
OH AVG
81.7
Rank
#85 / 138 | +1% | 7.25
Facility
7.25
OH AVG
3.54
Rank
#1 / 182 | -4% | +105% | $0
Facility
$0
OH AVG
$74.0k
Rank
#1 / 183 | 12
Facility
12
OH AVG
30.9
Rank
#29 / 183 | 4.0
Facility
4.0
OH AVG
4.6
Rank
#81 / 183 | - | 20 | - |
44
Facility
44
OH AVG
40
Rank
#322 / 704 | Emerson Stambaugh | $3.8MFiscal year ending 12/2023
Facility
$3.8MFiscal year ending 12/2023
OH AVG
$10.1M
Rank
#163 / 183 | $2.7MFiscal year ending 12/2023
Facility
$2.7MFiscal year ending 12/2023
OH AVG
$3.9M
Rank
#158 / 183 | 70.7%Fiscal year ending 12/2023
Facility
70.7%Fiscal year ending 12/2023
OH AVG
40.2%
Rank
#40 / 183 | 366386 | ||||
| CareCore at Meadows | NH HOS MC PC SNF | Cincinnati (Forest Park) | 97
Facility
97
OH AVG
75
Rank
#85 / 309 |
89.8%
Facility
89.8%
OH AVG
81.7
Rank
#47 / 138 | +10% | 2.86
Facility
2.86
OH AVG
3.54
Rank
#165 / 182 | +16% | -19% | $0
Facility
$0
OH AVG
$74.0k
Rank
#1 / 183 | 61
Facility
61
OH AVG
30.9
Rank
#170 / 183 | 7.6
Facility
7.6
OH AVG
4.6
Rank
#172 / 183 | 2 | 87 | - |
44
Facility
44
OH AVG
40
Rank
#322 / 704 | - | $7.2MFiscal year ending 12/2023
Facility
$7.2MFiscal year ending 12/2023
OH AVG
$10.1M
Rank
#135 / 183 | $3.6MFiscal year ending 12/2023
Facility
$3.6MFiscal year ending 12/2023
OH AVG
$3.9M
Rank
#131 / 183 | 49.3%Fiscal year ending 12/2023
Facility
49.3%Fiscal year ending 12/2023
OH AVG
40.2%
Rank
#57 / 183 | 366175 |
CareCore at Meadows is located in Cincinnati, Ohio.
Here are the financial assistance programs available to residents in Ohio.
CareCore at Meadows is in the Forest Park neighborhood.
CareCore at Meadows has a walk score of 44. Somewhat walkable. A few nearby services may be reachable on foot, but most trips require transportation.
CareCore at Meadows's occupancy is 76.6%.
No, CareCore at Meadows has a no-pet policy.
CareCore at Meadows is registered as a for-profit.
Yes — there are 3 photos of CareCore at Meadows in the photo gallery on this page.
CareCore at Meadows is located at 11760 Pellston Ct, Cincinnati, OH 45240.
Care Cost Calculator: See Prices in Your Area
Nursing Home Data Explorer
Don’t Wait Too Long: 7 Red Flag Signs Your Parent Needs Assisted Living Now
The True Cost of Assisted Living in 2025 – And How Families Are Paying For It
Understanding Senior Living Costs: Pricing Models, Discounts & Financial Assistance


