


Total health inspections
2
North Carolina average 4
Last Health inspection on Jun 2024
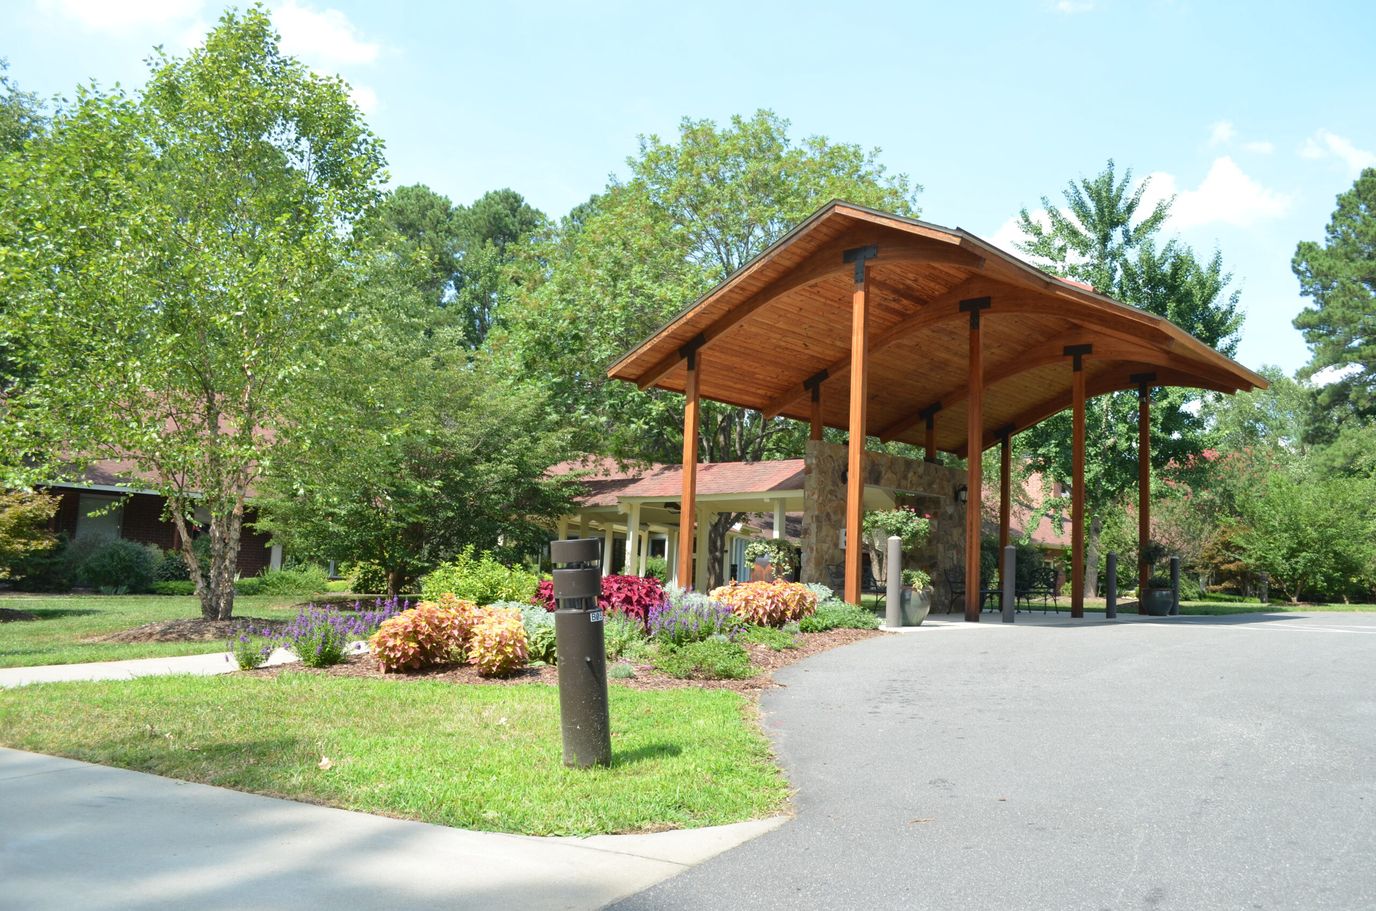
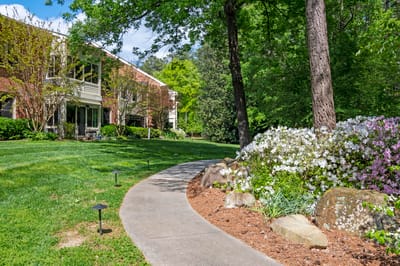


Owned by The Chapel Hill Residential, Carol Woods is a 30-bed skilled nursing community located in a residential area of Chapel Hill, North Carolina. The two-story community has served older adults for 47 years, combining long-standing experience with a smaller setting that encourages personalized care and lasting relationships. It accepts Medicare and private pay, while the average resident stay of 31 days reflects a strong emphasis on short-term rehabilitation alongside long-term nursing care.
Additionally, residents receive an average of 5 hours and 56 minutes of nursing care each day from registered nurses, licensed practical nurses, and nursing aides. Respite care and cognitive support programs are also available, providing flexible options for older adults with varying care needs.
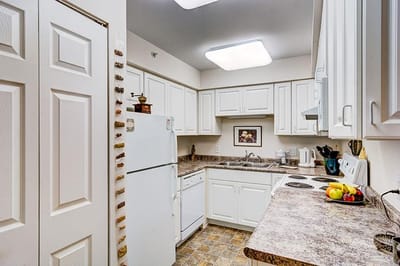
Daily life is enhanced by meals prepared with fresh, seasonal ingredients and served in multiple on-campus dining venues, with heart-healthy, vegetarian, and low-sodium selections available. Furthermore, residents have access to wellness and fitness programs, an on-site salon, gardening opportunities, transportation services, 24-hour security, and maintenance-free living.
While the surrounding neighborhood is largely car-dependent, making most errands easier by vehicle, the community offers a wide range of services and amenities that support an active and engaging daily lifestyle.
| Staff type | Hours / Day / Resident | vs state avg |
|---|---|---|
|
Registered Nurse (RN)
| 2h 15m per day | ▲ 284% State avg: 35m per day · National avg: 41m per day |
|
LPN / LVN
| 30m per day | ▼ 43% State avg: 52m per day · National avg: 52m per day |
|
Nurse Aide
| 3h 28m per day | ▲ 49% State avg: 2h 20m per day · National avg: 2h 20m per day |
|
Weekend Total Nursing
| 5h 39m per day | ▲ 69% State avg: 3h 20m per day · National avg: 3h 26m per day |
|
Physical Therapist
| 4m per day | ▼ 18% State avg: 5m per day · National avg: 4m per day |
|
Weekend RN
| 1h 54m per day | ▲ 397% State avg: 23m per day · National avg: 28m per day |
Key information about the people who lead and staff this community.
In North Carolina, the Department of Health and Human Services, Division of Health Service Regulation conducts unannounced surveys to ensure nursing and adult care homes meet safety standards.
Deficiencies
| This Facility | NC Average | vs. NC Avg |
|---|---|---|---|
|
Total deficiencies
| 7 | 46 | This facility has 85% fewer total deficiencies than a typical North Carolina nursing home (7 vs. NC avg 46).↓ 85% better |
|
Deficiencies per inspection
| 2.3 | 2.2 | This facility has 5% more deficiencies per inspection than a typical North Carolina nursing home (2.3 vs. NC avg 2.2).↑ 5% worse |
Inspections
| This Facility | NC Average | vs. NC Avg |
|---|---|---|---|
|
Total inspections
| 3 | 21 | This facility has had 86% fewer total inspections than the North Carolina average (3 vs. NC avg 21). More inspections can mean more regulatory scrutiny rather than worse care.↓ 86% fewer |
North Carolina average 4
Last Health inspection on Jun 2024
North Carolina average 20.9
North Carolina average 4.99
Health citations are formal notices following inspections when they fail to comply with safety and care standards.
All 7 citations resulted from standard inspections.
North Carolina average: 1.3
North Carolina average: 0.9
Reporting period: October 1 – December 31, 2025 (Q4 2025). Source: CMS Payroll-Based Journal report.
Manages medical care and health needs.
Assists with medical care and medications.
Helps with daily care and mobility.
| Certified Nursing Assistant | 53 | 0 | 53 | 6,741 | 92 | 100% | 7.7 |
| Registered Nurse | 44 | 0 | 44 | 3,522 | 92 | 100% | 7.8 |
| Licensed Practical Nurse | 15 | 0 | 15 | 557 | 71 | 77% | 5.3 |
| Clinical Nurse Specialist | 2 | 0 | 2 | 552 | 59 | 64% | 5.3 |
| RN Director of Nursing | 1 | 0 | 1 | 435 | 54 | 59% | 8 |
| Nurse Practitioner | 1 | 0 | 1 | 424 | 53 | 58% | 8 |
| Physical Therapy Assistant | 8 | 0 | 8 | 367 | 69 | 75% | 2.8 |
| Mental Health Service Worker | 1 | 0 | 1 | 364 | 57 | 62% | 6.4 |
| Medication Aide/Technician | 4 | 0 | 4 | 228 | 26 | 28% | 8.4 |
| Other Social Services Staff | 1 | 0 | 1 | 212 | 51 | 55% | 4.2 |
| Occupational Therapy Aide | 1 | 0 | 1 | 164 | 41 | 45% | 4 |
| Respiratory Therapy Technician | 4 | 0 | 4 | 138 | 53 | 58% | 2.5 |
| Feeding Assistant | 2 | 0 | 2 | 28 | 33 | 36% | 0.7 |
| Other Physician | 3 | 0 | 3 | 27 | 31 | 34% | 0.9 |
| Therapeutic Recreation Specialist | 1 | 0 | 1 | 22 | 36 | 39% | 0.6 |
| Medical Director | 1 | 0 | 1 | 17 | 17 | 18% | 1 |
Federal penalties imposed by CMS for regulatory violations, including civil money penalties (fines) and denials of payment for new Medicare/Medicaid admissions.
Source: CMS Penalties Database
No penalties in the past 3 years
No civil money penalties or payment denials were reported in the last 3 years.
These measures show how residents usually do over time at this home, based on health outcomes and preventive care.
North Carolina average: 11.5
North Carolina average: 20.6
North Carolina average: 17.5%
North Carolina average: 21.4%
North Carolina average: 3.6%
North Carolina average: 6.3%
North Carolina average: 2.6%
North Carolina average: 7.4%
North Carolina average: 4.4%
North Carolina average: 13.4%
North Carolina average: 91.6%
North Carolina average: 79.9%
North Carolina average: 1.5%
North Carolina average: 78.1%
North Carolina average: 22.9%
North Carolina average: 13.2%
North Carolina average: 0.8%
North Carolina average: 53.7%
North Carolina average: 50.6%
Quality measures are calculated from Minimum Data Set (MDS) assessments. For most measures, lower percentages indicate better care quality.
21% of new residents, usually for short-term rehab.
79% of new residents, often for short stays.
Source: CMS Long-Term Care Facility Characteristics (Data as of Jan 2026)
Residents meet regularly to discuss policies, care quality, and activities
Family members meet regularly to discuss policies, care quality, and activities
Part of a Continuing Care Retirement Community offering multiple care levels
Organized group of family members that meets regularly to discuss facility policies, resident care, and activities.
Organized group of residents that meets regularly to discuss facility policies, quality of life, and activities.
Data sourced from CMS Long-Term Care Facility Characteristics quarterly report. Payer mix reflects the current resident census by primary payment source.
Historical financial and operational data for Carol Woods from 2011–2023, based on CMS SNF Cost Reports.
Key figures below are for fiscal year ending in 12/2023.
Based on CMS SNF Cost Report for fiscal year ending in 12/2023.
Pets Allowed
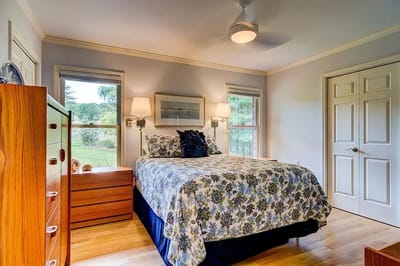
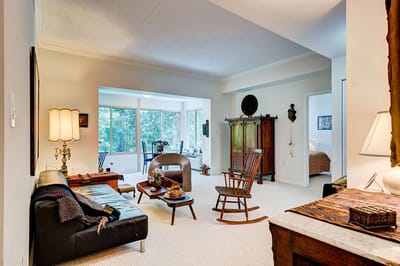
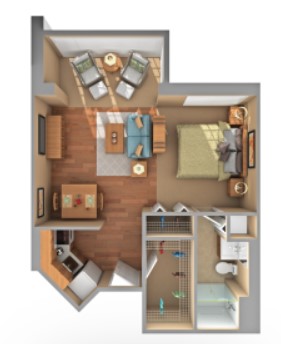
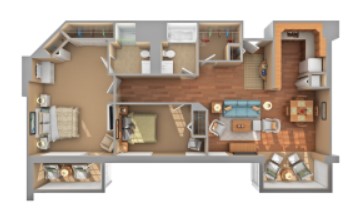
Housing Options: Studio / 1 Bed / 2 Bed
Building Type: Two-story
Fitness and Recreation
Residents typically stay for brief periods, with frequent admissions and discharges throughout the year.
Most new residents arrive under private pay (79% of admissions), and a typical private pay stay runs around 6 - 7 months.
Coverage residents most often arrive under.
Coverage residents most often leave under.
![]() 4.6 miles from city center
4.6 miles from city center
![]() Estimated distance in miles from Chapel Hill's city center to Carol Woods's address, calculated via Google Maps.
— 4.37 miles to nearest hospital (UNC Hospitals)
Estimated distance in miles from Chapel Hill's city center to Carol Woods's address, calculated via Google Maps.
— 4.37 miles to nearest hospital (UNC Hospitals)
Add your location
Info below is compiled from CMS reports & the NC Dept. of Health & Human Services (NCDHHS), senior community websites & trusted data sources such as Walk Score & BBB.
Communities are listed from highest to lowest based on our ranking methodology.
| Carol Woods | NH AL IL SNF | Chapel Hill (Carol Woods) | 30
Facility
30
NC AVG
72
Rank
#327 / 388 |
72.7%
Facility
72.7%
NC AVG
68
Rank
#127 / 240 | +7% | 5.94
Facility
5.94
NC AVG
3.98
Rank
#10 / 80 | +239% | +49% | $0
Facility
$0
NC AVG
$74.6k
Rank
#1 / 88 | 7
Facility
7
NC AVG
20.9
Rank
#26 / 84 | 3.5
Facility
3.5
NC AVG
5.0
Rank
#38 / 84 | - | 22 | - |
13
Facility
13
NC AVG
33
Rank
#433 / 573 | The Chapel Hill Residential Retirement Center, Inc | $29.1MFiscal year ending 12/2023
Facility
$29.1MFiscal year ending 12/2023
NC AVG
$13.2M
Rank
#7 / 87 | $18.0MFiscal year ending 12/2023
Facility
$18.0MFiscal year ending 12/2023
NC AVG
$4.9M
Rank
#7 / 87 | 61.7%Fiscal year ending 12/2023
Facility
61.7%Fiscal year ending 12/2023
NC AVG
39.8%
Rank
#69 / 87 | 345199 | ||||
| Signature HealthCARE of Chapel Hill | NH HOS PC SNF | Chapel Hill (East Franklin Street) | 108
Facility
108
NC AVG
72
Rank
#64 / 388 |
90.9%
Facility
90.9%
NC AVG
68
Rank
#54 / 240 | +34% | 3.96
Facility
3.96
NC AVG
3.98
Rank
#38 / 80 | +62% | 0% | $0
Facility
$0
NC AVG
$74.6k
Rank
#1 / 88 | 20
Facility
20
NC AVG
20.9
Rank
#57 / 84 | 5.0
Facility
5.0
NC AVG
5.0
Rank
#57 / 84 | - | 98 | - |
74
Facility
74
NC AVG
33
Rank
#14 / 573 | Moses Muhairwe | $11.3MFiscal year ending 12/2023
Facility
$11.3MFiscal year ending 12/2023
NC AVG
$13.2M
Rank
#60 / 87 | $4.4MFiscal year ending 12/2023
Facility
$4.4MFiscal year ending 12/2023
NC AVG
$4.9M
Rank
#66 / 87 | 39.1%Fiscal year ending 12/2023
Facility
39.1%Fiscal year ending 12/2023
NC AVG
39.8%
Rank
#45 / 87 | 345225 |
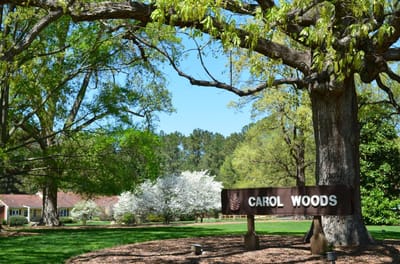
Carol Woods is located in Chapel Hill, North Carolina.
Here are the financial assistance programs available to residents in North Carolina.
Carol Woods is in the Carol Woods neighborhood of Chapel Hill.
Carol Woods has a walk score of 13. Car-dependent. Most errands require a car, with limited nearby walkable options.
Carol Woods's occupancy is 76.7%.
Carol Woods has been operating for approximately 47 years, based on available licensing and registration records.
Yes, Carol Woods allows residents to bring their pets.
Carol Woods is registered as a non-profit in NC.
Yes — there are 8 photos of Carol Woods in the photo gallery on this page.
Care Cost Calculator: See Prices in Your Area
Nursing Home Data Explorer
Don’t Wait Too Long: 7 Red Flag Signs Your Parent Needs Assisted Living Now
The True Cost of Assisted Living in 2025 – And How Families Are Paying For It
Understanding Senior Living Costs: Pricing Models, Discounts & Financial Assistance


