


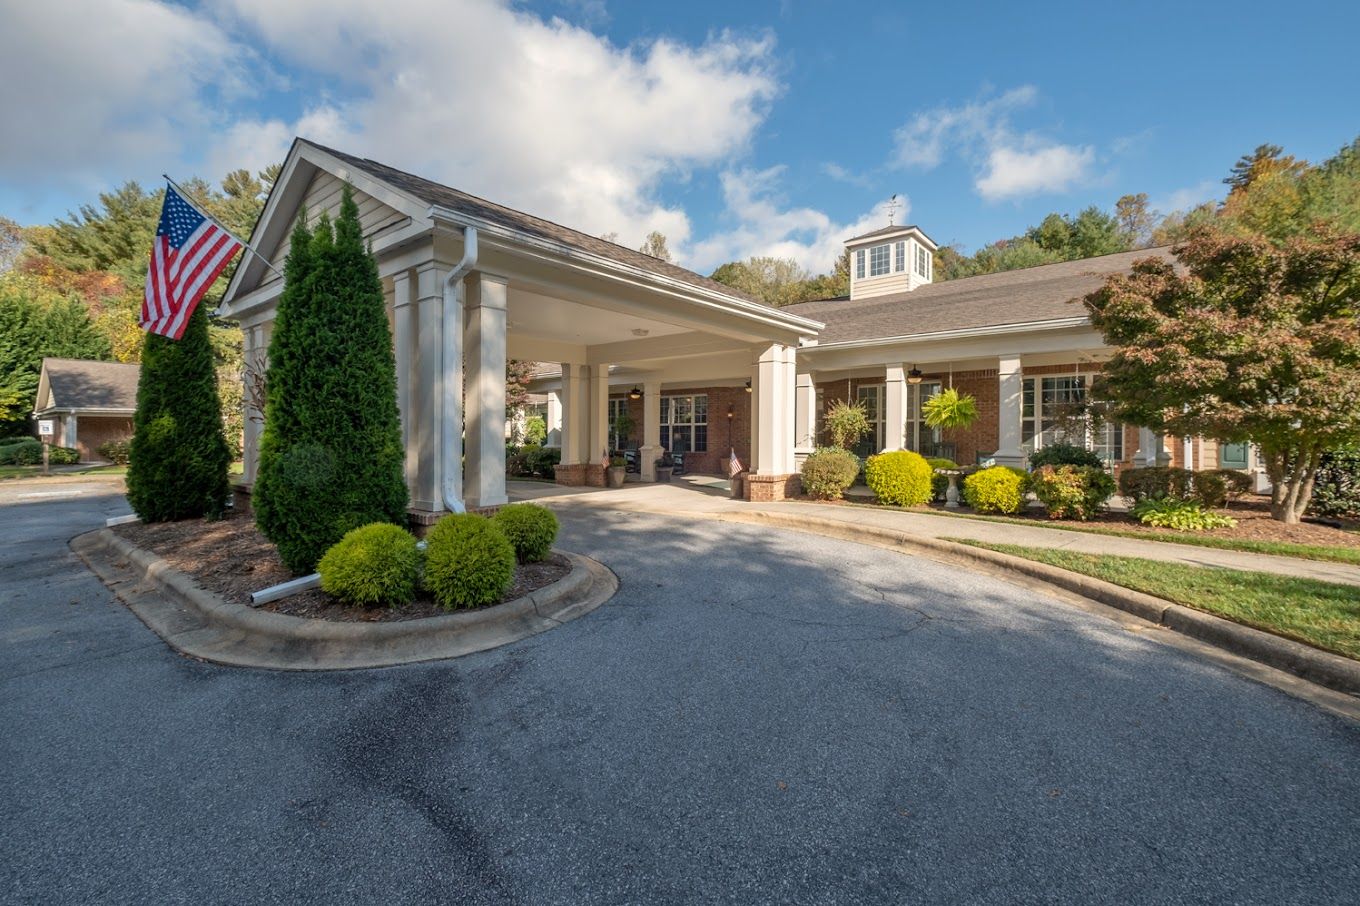
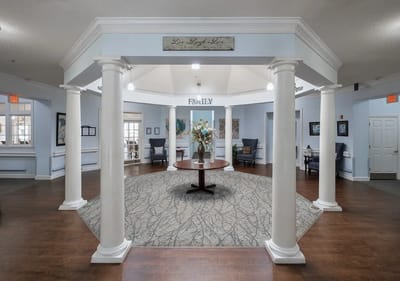
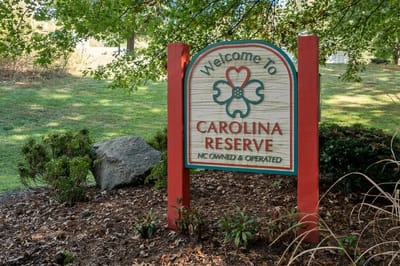
Carolina Reserve of Hendersonville
Assisted Living, Nursing Home & Memory Care · Hendersonville, NC
Carolina Reserve of Hendersonville
Assisted Living, Nursing Home & Memory Care · Hendersonville, NC
Featuring the inviting neighborhood of Hendersonville, NC, the Carolina Reserve of Hendersonville is a peculiar senior living community providing assisted living and memory care services. Here, residents can choose among a wide array of spacious and comfortable accommodations with several floor plans ranging from private rooms to privacy/companion suites, and deluxe private companion suites. With its trained and dedicated team, this community offers an emergency response system and 24/7 personalized care services for its residents. In terms of memory care, those with cognitive conditions like Alzheimer’s and dementia are provided with a cutting-edge program named Pathways to Discovery through its well-trained and empathetic team.
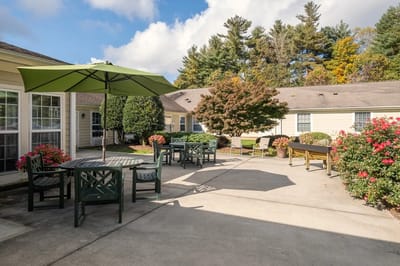
The community is committed to providing a perfect balance between personal freedom and intentional care wherein residents can enjoy delightful and healthy meals and snacks daily, weekly housekeeping and laundry services, in-house maintenance services, and free transportation to all professional services. Participate in diverse social activities like wellness programs. Equipped with the right tools and people, seniors can surely achieve a worthwhile retirement.
61-bed community Rank #230 / 388Bed count — State benchmarkedThis home is ranked 230th out of 388 homes in North Carolina for bed count. Shows this facility's certified or reported bed count compared to other North Carolina facilities. Larger communities may offer more amenities, programs, and on-site services for residents and families.Facilities with the same value for a metric share the same rank. Rankings are based only on facilities in North Carolina that report data for that category. Facilities without available data are excluded from the ranking.Click the rank badge to see the full State ranking.Click here to see the full State ranking.
A moderately sized community that may balance personal attention with shared amenities and social activities.
Walk Score: 29 / 100 Rank #322 / 573Walk Score — State benchmarkedThis home is ranked 322nd out of 573 homes in North Carolina for walk score. Shows how walkable this facility's neighborhood is compared to the average walk score across North Carolina facilities. Higher scores benefit residents, families, and staff.Facilities with the same value for a metric share the same rank. Rankings are based only on facilities in North Carolina that report data for that category. Facilities without available data are excluded from the ranking.Click the rank badge to see the full State ranking.Click here to see the full State ranking.
Somewhat walkable. A few nearby services may be reachable on foot, but most trips require transportation.
About this community
StatusActive
CountyHenderson
License NumberHAL-045-125
Staffing
Key information about the people who lead and staff this community.
ContactJulia Steingass, Director of Corporate Compliance (per state records, record updated Jul 2026)
Inspection History
In North Carolina, the Department of Health and Human Services, Division of Health Service Regulation conducts unannounced surveys to ensure nursing and adult care homes meet safety standards.
Since 2015 · 11 years of data
31 deficiencies
16 inspections
1 penalty
$12.0K fined
11 inspections with deficiencies
Penalties
 Civil monetary penalties issued by North Carolina regulators against this facility, including fines and total monetary penalties.
This Facility
NC Average
vs. NC Avg-
1——
-
$12k——
Data reflects the most recent 11 years (since 2015).
- 2022-05-13 $12,000 Paid in Full
Inspection Scorecard
This scorecard compares key inspection, deficiency, and complaint metrics at this facility against the North Carolina state average. Metrics rated ≥15% worse than average are highlighted in red; those ≥15% better are highlighted in green.
Since 2015 vs. North Carolina state average
Overall vs. NC average
0 Worse
No metrics in this bucket.
4 Better
Metrics better than North Carolina average:
• Total deficiencies (33% below)
• Deficiencies per inspection (14% below)
• Inspections with deficiencies (42% below)
• Inspection deficiency rate (23% below)
• Total deficiencies (33% below)
• Deficiencies per inspection (14% below)
• Inspections with deficiencies (42% below)
• Inspection deficiency rate (23% below)
Deficiencies
| This Facility | NC Average | vs. NC Avg |
|---|---|---|---|
|
Total deficiencies
| 31 | 46 | This facility has 33% fewer total deficiencies than a typical North Carolina nursing home (31 vs. NC avg 46).↓ 33% better |
|
Deficiencies per inspection
| 1.9 | 2.2 | This facility has 14% fewer deficiencies per inspection than a typical North Carolina nursing home (1.9 vs. NC avg 2.2).↓ 14% better |
Inspections
| This Facility | NC Average | vs. NC Avg |
|---|---|---|---|
|
Total inspections
| 16 | 21 | This facility has had 24% fewer total inspections than the North Carolina average (16 vs. NC avg 21). More inspections can mean more regulatory scrutiny rather than worse care.↓ 24% fewer |
|
Inspections with deficiencies
| 11 | 19 | This facility has 42% fewer inspections with deficiencies than a typical North Carolina nursing home (11 vs. NC avg 19).↓ 42% better |
|
Inspection deficiency rate
| 69% | 90% | This facility has 21 percentage points lower inspection deficiency rate than a typical North Carolina nursing home (69% vs. NC avg 90%).↓ 21% better |
Inspection Reports Summary
An editor-reviewed summary of the themes and findings across this facility's recent inspection reports.
- June 25, 2019 inspection found 9 deficiencies including unsafe oxygen storage, obstructed exits, compromised fire-rated walls, malfunctioning alarms, and lack of staff fire suppression training.
- December 14, 2018 annual survey cited 3 deficiencies for failure to test 2 of 6 staff for tuberculosis and improper hydromorphone labeling risking resident safety.
- March 19, 2015 follow-up survey confirmed prior fire-rated wall and ceiling deficiencies were identified and documented, showing ongoing attention to building safety issues.
What does this home offer?
Pets Allowed
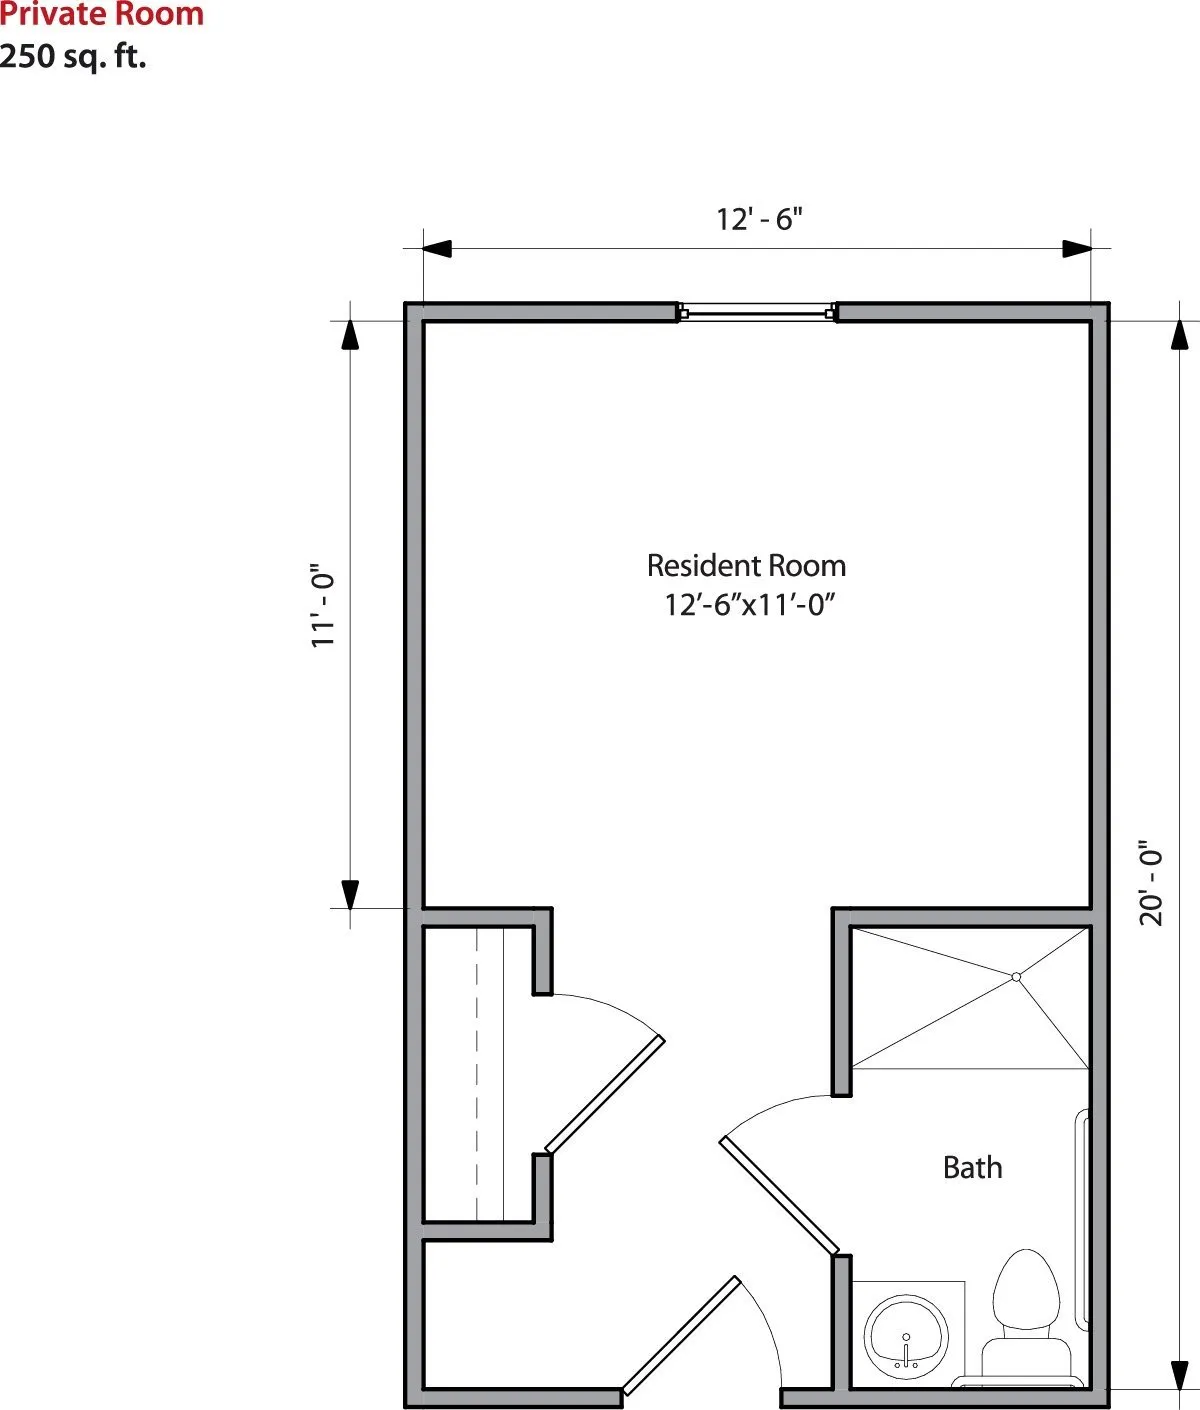
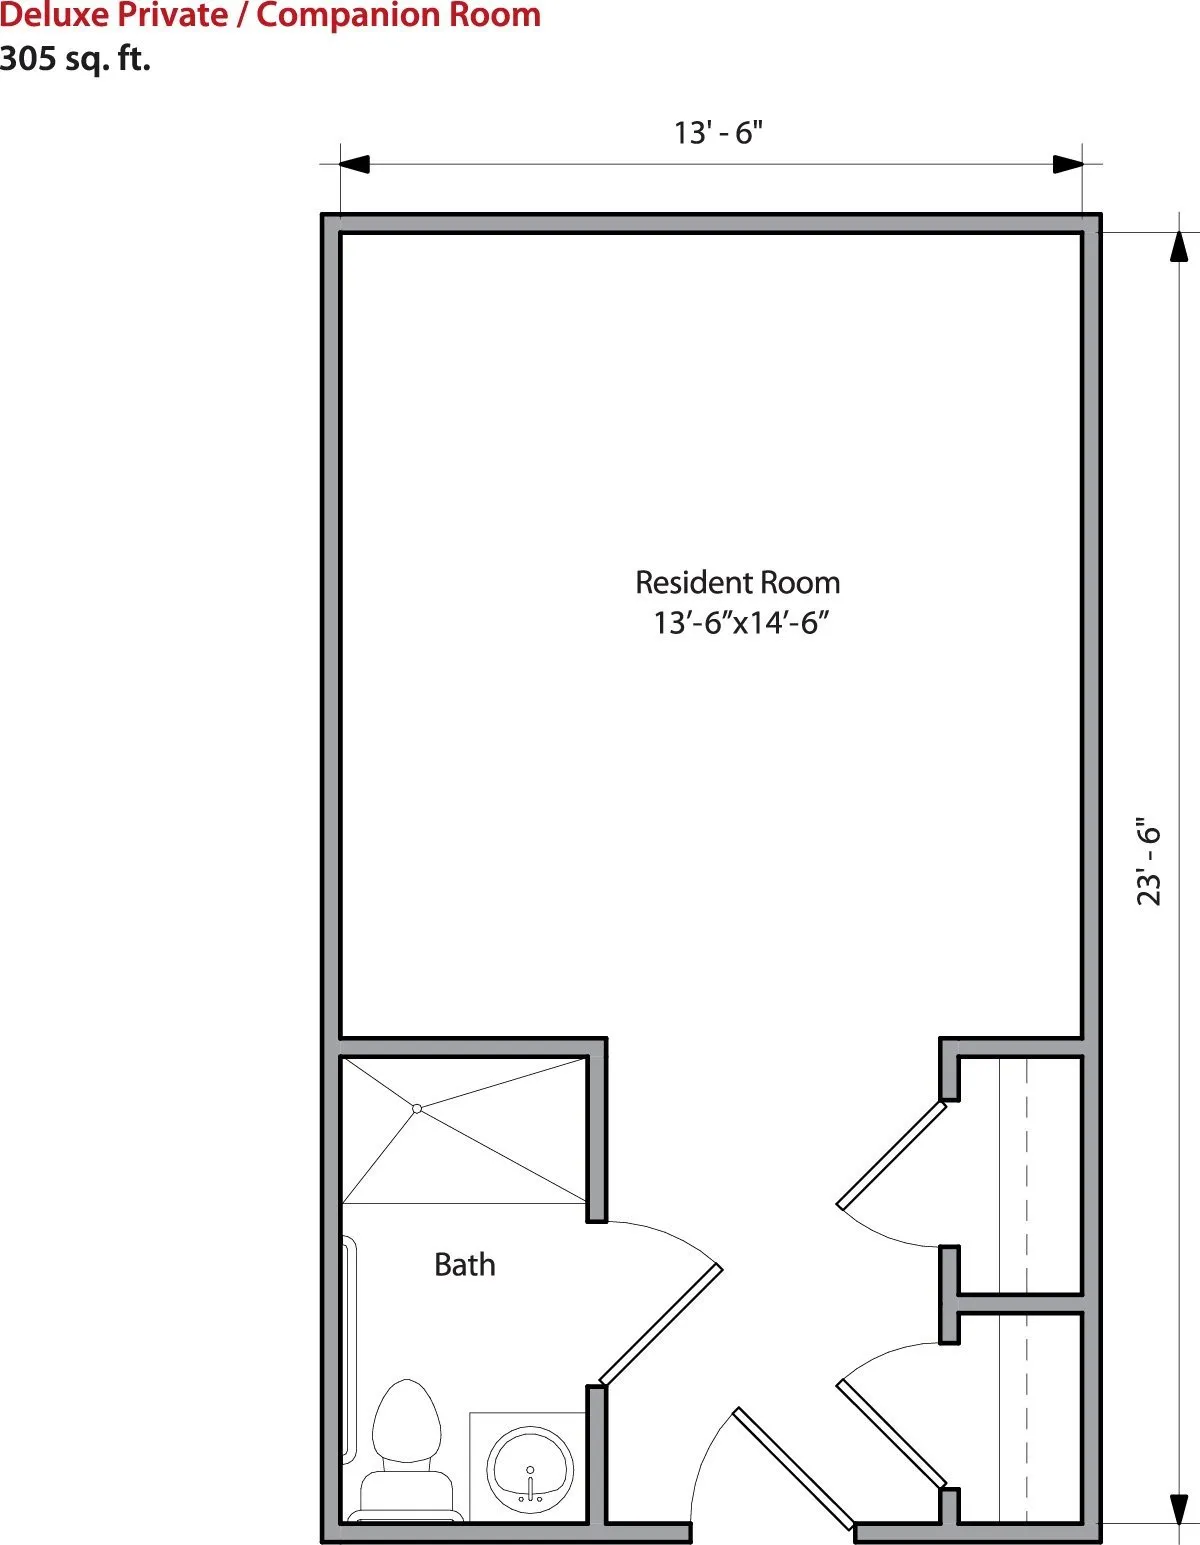
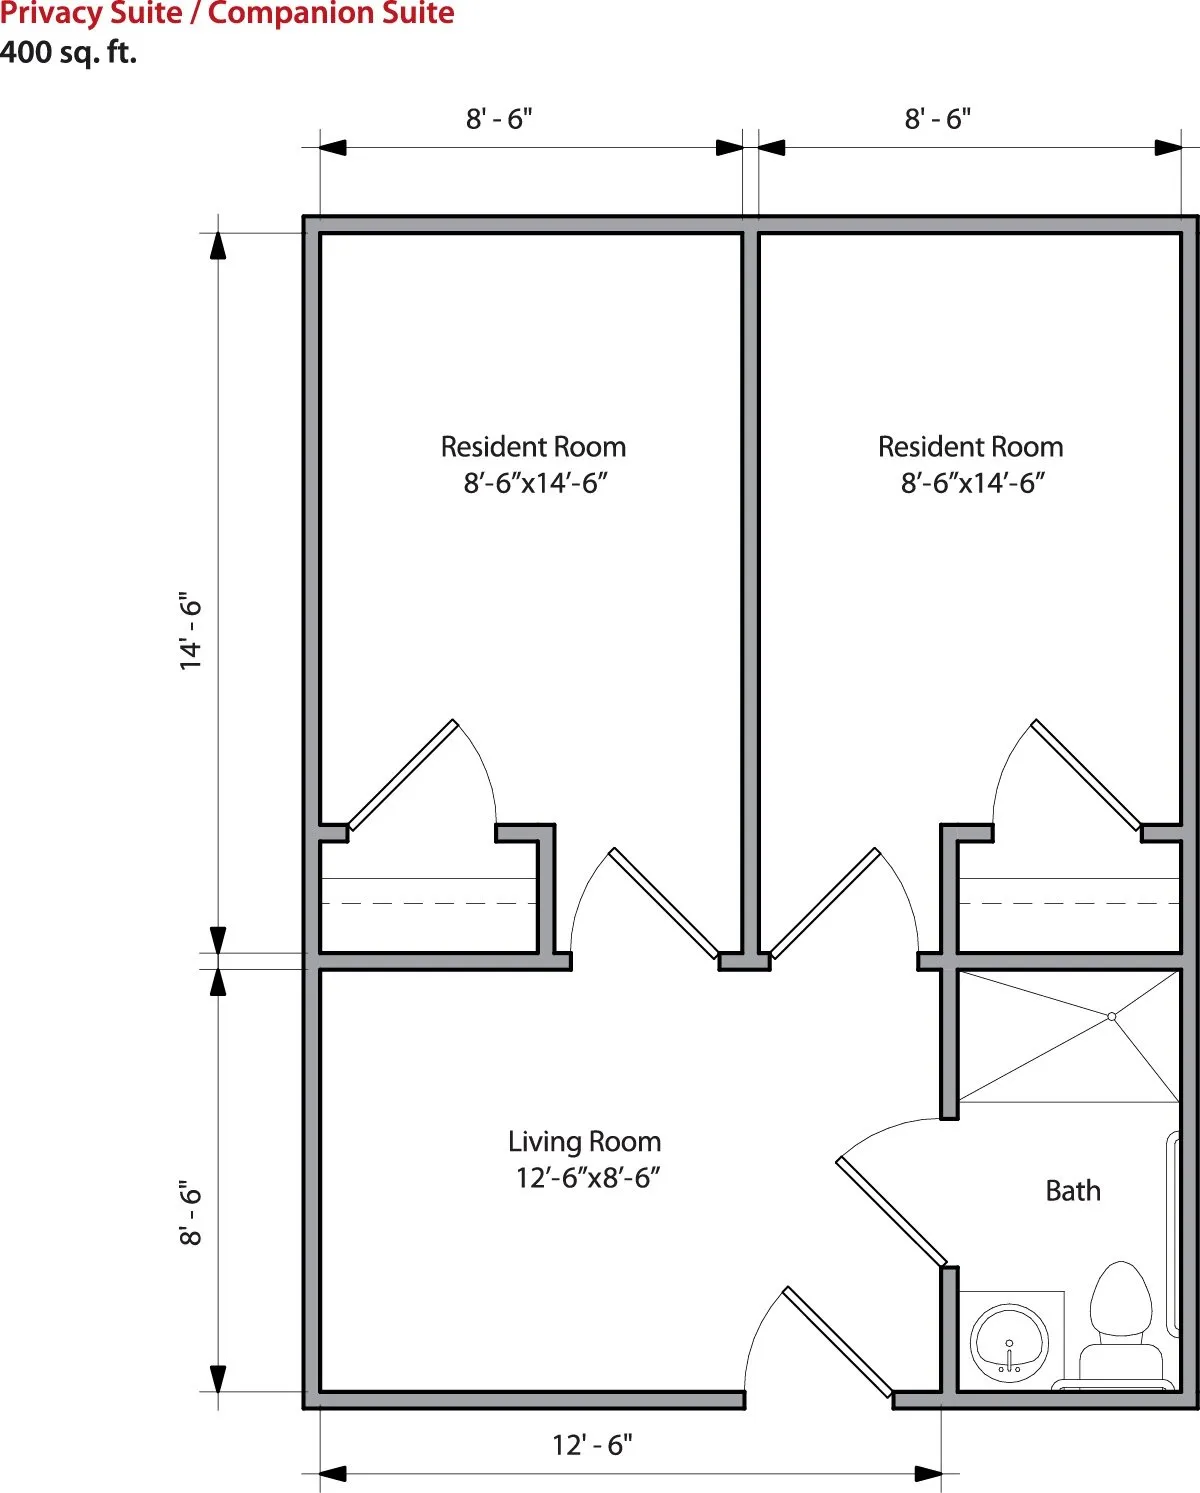
Room Sizes: 250 / 305 / 400 sq. ft
Housing Options: Private / Companion Suite
Transportation Services
Fitness and Recreation
Living Spaces & Floor Plans for Carolina Reserve of Hendersonville
Places of interest near Carolina Reserve of Hendersonville
![]() 1.9 miles from city center
1.9 miles from city center
![]() Estimated distance in miles from Hendersonville's city center to Carolina Reserve of Hendersonville's address, calculated via Google Maps.
Estimated distance in miles from Hendersonville's city center to Carolina Reserve of Hendersonville's address, calculated via Google Maps.
Calculate Travel Distance to Carolina Reserve of Hendersonville
Add your location
Financial Assistance for
Assisted Living in North Carolina
Carolina Reserve of Hendersonville is located in Hendersonville, North Carolina.
Here are the financial assistance programs available to residents in North Carolina.
Frequently Asked Questions about Carolina Reserve of Hendersonville
Is Carolina Reserve of Hendersonville in a walkable area?
Carolina Reserve of Hendersonville has a walk score of 29. Somewhat walkable. A few nearby services may be reachable on foot, but most trips require transportation.
What is the license number of Carolina Reserve of Hendersonville?
According to NC state health department records, Carolina Reserve of Hendersonville's license number is HAL-045-125.
Are pets allowed at Carolina Reserve of Hendersonville?
Yes, Carolina Reserve of Hendersonville allows residents to bring their pets.
How many beds does Carolina Reserve of Hendersonville have?
Carolina Reserve of Hendersonville has 61 beds.
Are there photos of Carolina Reserve of Hendersonville?
Yes — there are 4 photos of Carolina Reserve of Hendersonville in the photo gallery on this page.
What is the address of Carolina Reserve of Hendersonville?
Carolina Reserve of Hendersonville is located at 1820 Pisgah Dr, Hendersonville, NC 28791.
What is the phone number of Carolina Reserve of Hendersonville?
(828) 622-4988 will put you in contact with the team at Carolina Reserve of Hendersonville.
Guides for Better Senior Living
Care Cost Calculator: See Prices in Your Area
Nursing Home Data Explorer
Don’t Wait Too Long: 7 Red Flag Signs Your Parent Needs Assisted Living Now
The True Cost of Assisted Living in 2025 – And How Families Are Paying For It
Understanding Senior Living Costs: Pricing Models, Discounts & Financial Assistance
Updated on
