


Total staff
125
Employees
120
Contractors
5
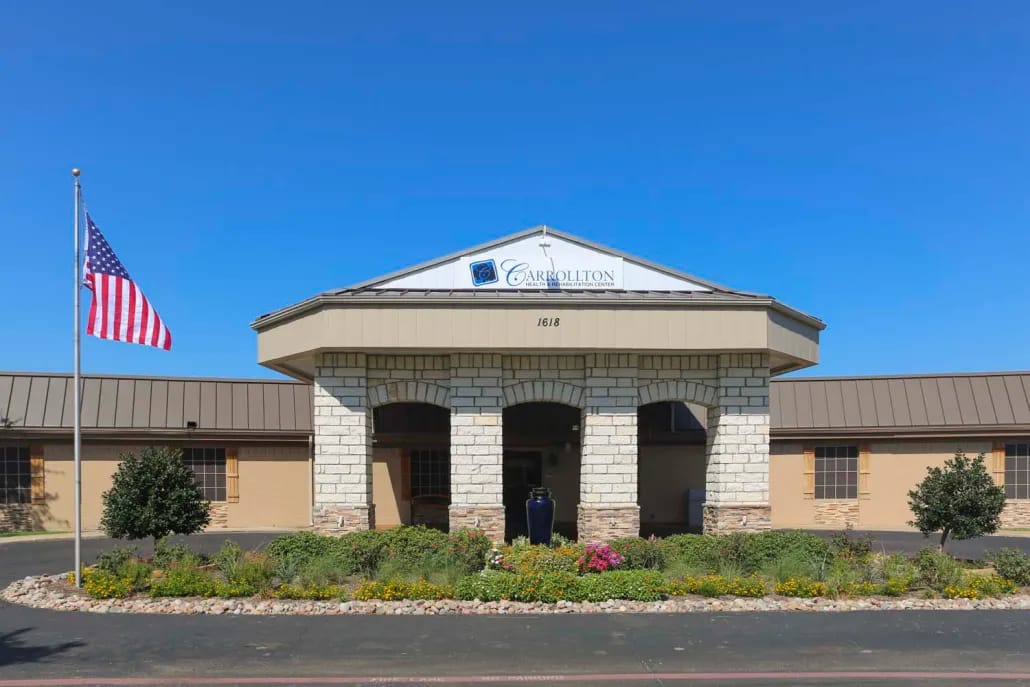
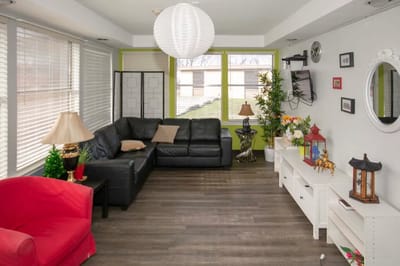
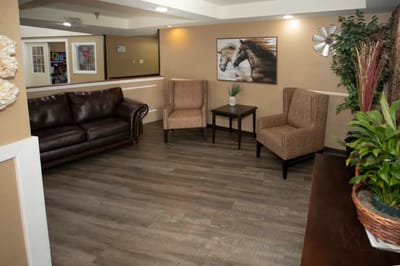
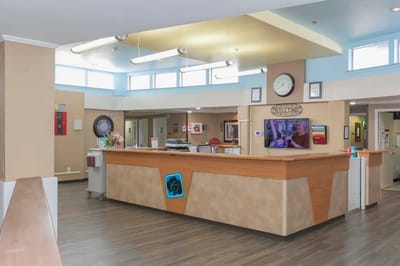
Carrollton Health and Rehabilitation Center is a trusted nursing home in Carrollton, TX, offering rehabilitation and skilled nursing. With its nurturing and inviting environment, older adults can ease their worries during their stay. Residents also experience a worry-free lifestyle, with 24-hour care, well-balanced meals, and therapy services. Following a holistic approach to care, the community ensures residents can recover and return to their routines without hassles.
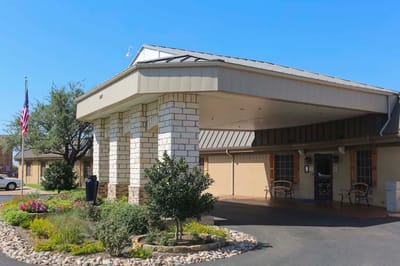
Arts and crafts, local excursions, and ice cream socials encourage residents to explore new hobbies and make friends. State-of-the-art rehabilitation equipment and spacious communal areas allow residents to live comfortably and interact with their surroundings safely. Situated in the quiet residential area of Carrollton, the community ensures residents have a stress-free retirement. This nursing home strives to help older adults thrive in retirement, making it one of the leading options for senior living in Texas.
| Staff type | Hours / Day / Resident | vs state avg |
|---|---|---|
|
Registered Nurse (RN)
| 52m per day | ▲ 100% State avg: 26m per day · National avg: 41m per day |
|
LPN / LVN
| 30m per day | ▼ 47% State avg: 57m per day · National avg: 52m per day |
|
Nurse Aide
| 1h 48m per day | ▼ 11% State avg: 2h 1m per day · National avg: 2h 21m per day |
|
Weekend Total Nursing
| 2h 38m per day | ▼ 12% State avg: 2h 59m per day · National avg: 3h 26m per day |
|
Physical Therapist
| 13m per day | ▲ 225% State avg: 4m per day · National avg: 4m per day |
|
Weekend RN
| 50m per day | ▲ 138% State avg: 21m per day · National avg: 29m per day |
Reporting period: July 1 – September 30, 2025 (Q3 2025). Source: CMS Payroll-Based Journal report.
Manages medical care and health needs.
Assists with medical care and medications.
Helps with daily care and mobility.
Total hours from contractors
136 contractor hours this quarter
| Certified Nursing Assistant | 41 | 0 | 41 | 11,243 | 92 | 100% | 8.8 |
| Registered Nurse | 17 | 0 | 17 | 5,533 | 91 | 99% | 9.5 |
| Licensed Practical Nurse | 12 | 0 | 12 | 2,354 | 88 | 96% | 10 |
| Respiratory Therapy Technician | 9 | 0 | 9 | 1,594 | 85 | 92% | 7.6 |
| Medication Aide/Technician | 6 | 0 | 6 | 1,484 | 83 | 90% | 9.9 |
| Physical Therapy Aide | 5 | 0 | 5 | 1,434 | 92 | 100% | 7.1 |
| Speech Language Pathologist | 5 | 0 | 5 | 1,289 | 90 | 98% | 6.5 |
| Qualified Social Worker | 7 | 0 | 7 | 1,254 | 89 | 97% | 7.4 |
| RN Director of Nursing | 3 | 0 | 3 | 1,233 | 66 | 72% | 8.5 |
| Physical Therapy Assistant | 3 | 0 | 3 | 1,196 | 90 | 98% | 7.3 |
| Dental Services Staff | 4 | 0 | 4 | 1,068 | 66 | 72% | 5.3 |
| Administrator | 1 | 0 | 1 | 528 | 66 | 72% | 8 |
| Nurse Practitioner | 1 | 0 | 1 | 498 | 58 | 63% | 8.6 |
| Nurse Aide in Training | 1 | 0 | 1 | 332 | 42 | 46% | 7.9 |
| Therapeutic Recreation Specialist | 1 | 0 | 1 | 250 | 30 | 33% | 8.3 |
| Clinical Nurse Specialist | 3 | 0 | 3 | 219 | 23 | 25% | 8.1 |
| Medical Director | 0 | 3 | 3 | 54 | 6 | 7% | 9 |
| Dietitian | 1 | 0 | 1 | 47 | 15 | 16% | 3.2 |
| Occupational Therapy Aide | 0 | 1 | 1 | 46 | 8 | 9% | 5.8 |
| Occupational Therapy Assistant | 0 | 1 | 1 | 36 | 3 | 3% | 12 |
Includes penalties issued in 2024-2025
Federal penalties imposed by CMS for regulatory violations, including civil money penalties (fines) and denials of payment for new Medicare/Medicaid admissions.
Source: CMS Penalties Database (Data as of Jan 2026)
Texas average: $80K
Texas average: 2.5
Texas average: 0.2
Penalties are imposed by CMS for violations of federal nursing home regulations.
2 penalties in the past 3 years
Multiple penalties were reported in the last 3 years.
Last updated: Jan 2026
These measures show how residents usually do over time at this home, based on health outcomes and preventive care.
Texas average: 8.6
Texas average: 16.0
Texas average: 16.2%
Texas average: 16.2%
Texas average: 15.7%
Texas average: 3.2%
Texas average: 4.4%
Texas average: 0.8%
Texas average: 3.5%
Texas average: 2.9%
Texas average: 7.9%
Texas average: 97.3%
Texas average: 97.9%
Texas average: 2.13
Texas average: 2.07
Texas average: 90.4%
Texas average: 1.4%
Texas average: 88.0%
Texas average: 25.9%
Texas average: 12.0%
Texas average: 0.8%
Texas average: 53.7%
Texas average: 50.6%
Quality measures are calculated from Minimum Data Set (MDS) assessments. For most measures, lower percentages indicate better care quality.
37% of new residents, usually for short-term rehab.
33% of new residents, often for short stays.
30% of new residents, often for long-term daily care.
Source: CMS Long-Term Care Facility Characteristics (Data as of Jan 2026)
Residents meet regularly to discuss policies, care quality, and activities
Organized group of residents that meets regularly to discuss facility policies, quality of life, and activities.
Data sourced from CMS Long-Term Care Facility Characteristics quarterly report. Payer mix reflects the current resident census by primary payment source.
Historical financial and operational data for Carrollton Health & Rehabilitation Center from 2011–2024, based on CMS SNF Cost Reports.
Key figures below are for fiscal year ending in 06/2024.
Based on CMS SNF Cost Report for fiscal year ending in 06/2024.
No pets allowed
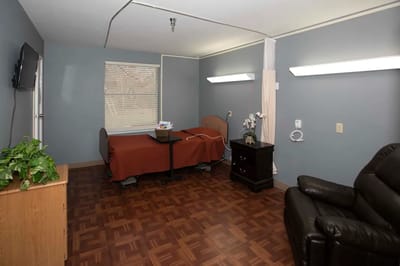
Housing Options: Private Rooms
Building Type: Single-story
Housekeeping Services
Social and Recreational Activities

On-site Medical Care and Health Services
Rehabilitative Support
Most residents typically stay for a few weeks or months before returning home or moving on.
New residents most often arrive under Medicare (37% of admissions), and a typical Medicare stay runs around 30 days.
Coverage residents most often arrive under.
Coverage residents most often leave under.
![]() 2.4 miles from city center
2.4 miles from city center
![]() Estimated distance in miles from Carrollton's city center to Carrollton Health & Rehabilitation Center's address, calculated via Google Maps.
Estimated distance in miles from Carrollton's city center to Carrollton Health & Rehabilitation Center's address, calculated via Google Maps.
Add your location
Info below is compiled from CMS reports & the TX Health & Human Services Commission (HHSC), senior community websites & trusted data sources such as Walk Score & BBB.
Communities are listed from highest to lowest based on our ranking methodology.
| The Madison on Marsh | NH PC RC SNF | Carrollton (Southwest Carrollton) | 125
Facility
125
TX AVG
79
Rank
#163 / 972 |
67.7%
Facility
67.7%
TX AVG
67.3
Rank
#109 / 195 | +1% | 3.38
Facility
3.38
TX AVG
3.63
Rank
#144 / 239 | +50% | -7% | $8.5k
Facility
$8.5k
TX AVG
$81.8k
Rank
#76 / 244 | 19
Facility
19
TX AVG
25.9
Rank
#102 / 241 | 3.2
Facility
3.2
TX AVG
3.7
Rank
#119 / 241 | 1 | 85 | - |
48
Facility
48
TX AVG
41
Rank
#567 / 1389 | Carrollton Health Care Center Ltd Co | $6.6MFiscal year ending 09/2023
Facility
$6.6MFiscal year ending 09/2023
TX AVG
$8.4M
Rank
#165 / 245 | $4.0MFiscal year ending 09/2023
Facility
$4.0MFiscal year ending 09/2023
TX AVG
$3.5M
Rank
#190 / 245 | 60.9%Fiscal year ending 09/2023
Facility
60.9%Fiscal year ending 09/2023
TX AVG
47%
Rank
#163 / 245 | 676128 | ||||
| Heritage Gardens Rehabilitation & Healthcare | NH SNF | Carrollton (North Denton Drive) | 121
Facility
121
TX AVG
79
Rank
#199 / 972 |
91.0%
Facility
91.0%
TX AVG
67.3
Rank
#23 / 195 | +35% | 3.50
Facility
3.50
TX AVG
3.63
Rank
#120 / 239 | +25% | -4% | $17.7k
Facility
$17.7k
TX AVG
$81.8k
Rank
#107 / 244 | 18
Facility
18
TX AVG
25.9
Rank
#82 / 241 | 2.6
Facility
2.6
TX AVG
3.7
Rank
#60 / 241 | 1 | 110 | - |
45
Facility
45
TX AVG
41
Rank
#626 / 1389 | - | $9.4MFiscal year ending 12/2023
Facility
$9.4MFiscal year ending 12/2023
TX AVG
$8.4M
Rank
#135 / 245 | $4.0MFiscal year ending 12/2023
Facility
$4.0MFiscal year ending 12/2023
TX AVG
$3.5M
Rank
#192 / 245 | 42.3%Fiscal year ending 12/2023
Facility
42.3%Fiscal year ending 12/2023
TX AVG
47%
Rank
#200 / 245 | 676496 | ||||
| Carrollton Health & Rehabilitation Center | NH MC SNF | Carrollton (Original Town) | 120
Facility
120
TX AVG
79
Rank
#204 / 972 |
68.1%
Facility
68.1%
TX AVG
67.3
Rank
#107 / 195 | +1% | 3.27
Facility
3.27
TX AVG
3.63
Rank
#158 / 239 | +78% | -10% | $19.2k
Facility
$19.2k
TX AVG
$81.8k
Rank
#110 / 244 | 26
Facility
26
TX AVG
25.9
Rank
#160 / 241 | 5.2
Facility
5.2
TX AVG
3.7
Rank
#220 / 241 | 2 | 82 | - |
43
Facility
43
TX AVG
41
Rank
#662 / 1389 | Carrollton Heights Healthcare, Inc | $9.0MFiscal year ending 06/2024
Facility
$9.0MFiscal year ending 06/2024
TX AVG
$8.4M
Rank
#144 / 245 | $4.9MFiscal year ending 06/2024
Facility
$4.9MFiscal year ending 06/2024
TX AVG
$3.5M
Rank
#125 / 245 | 54.9%Fiscal year ending 06/2024
Facility
54.9%Fiscal year ending 06/2024
TX AVG
47%
Rank
#85 / 245 | 675972 |
Carrollton Health & Rehabilitation Center is located in Carrollton, Texas.
Here are the financial assistance programs available to residents in Texas.
Carrollton Health & Rehabilitation Center is in the Original Town neighborhood.
Carrollton Health & Rehabilitation Center has a walk score of 43. Somewhat walkable. A few nearby services may be reachable on foot, but most trips require transportation.
Carrollton Health & Rehabilitation Center's occupancy is 65.6%.
No, Carrollton Health & Rehabilitation Center has a no-pet policy.
The team at Carrollton Health & Rehabilitation Center can be reached at contact-carrollton@ensignservices.net.
Carrollton Health & Rehabilitation Center is registered as a for-profit.
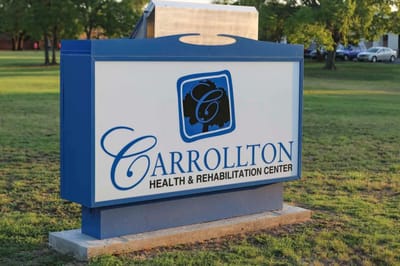
Yes — there are 7 photos of Carrollton Health & Rehabilitation Center in the photo gallery on this page.
Care Cost Calculator: See Prices in Your Area
Nursing Home Data Explorer
Don’t Wait Too Long: 7 Red Flag Signs Your Parent Needs Assisted Living Now
The True Cost of Assisted Living in 2025 – And How Families Are Paying For It
Understanding Senior Living Costs: Pricing Models, Discounts & Financial Assistance


