Casa de Ramana Rehabilitation Center
Nursing Home & Memory Care · Framingham, MA
CMS overall rating Info CMS (the Centers for Medicare & Medicaid Services) is the federal agency that rates nursing home quality. Its Overall Rating runs from 1 to 5 stars, combining health inspections, staffing, and quality measures, with inspections weighted most heavily.

Casa de Ramana Rehabilitation Center

Nursing Home & Memory Care · Framingham, MA
CMS overall rating Info CMS (the Centers for Medicare & Medicaid Services) is the federal agency that rates nursing home quality. Its Overall Rating runs from 1 to 5 stars, combining health inspections, staffing, and quality measures, with inspections weighted most heavily.
Calculator: See prices in your area
Casa de Ramana Rehabilitation Center accepts Medicare, Medicaid, and private pay.

Overview of Casa De Ramana Rehabilitation Center

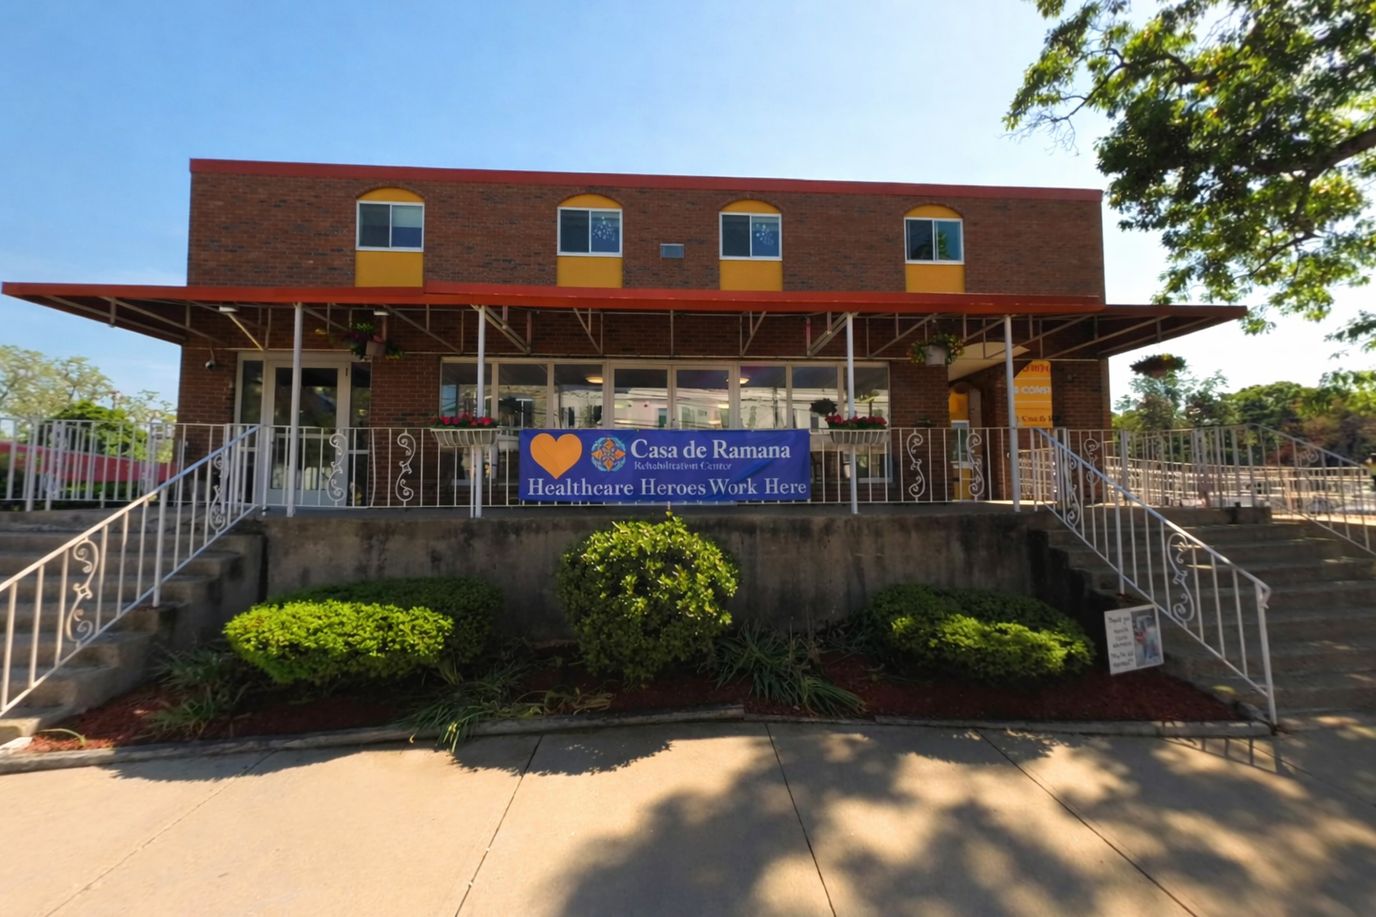
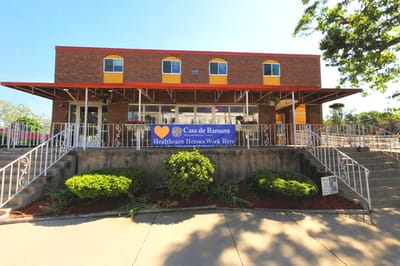
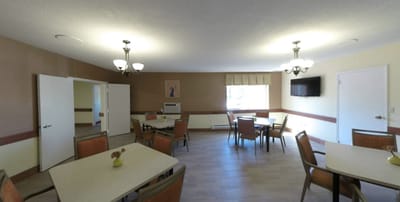
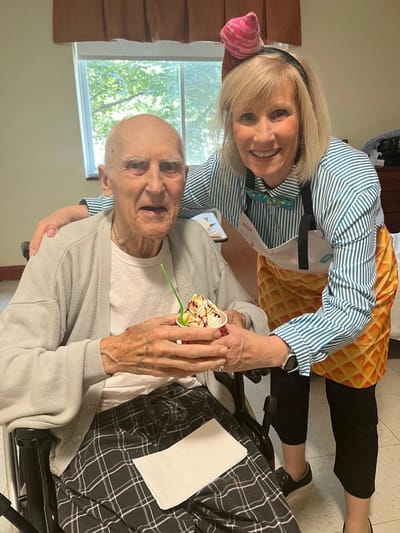
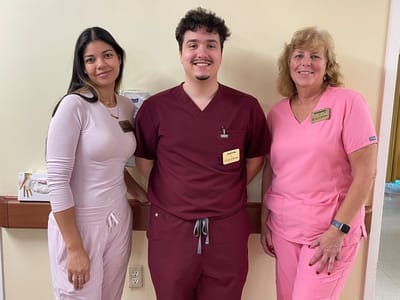
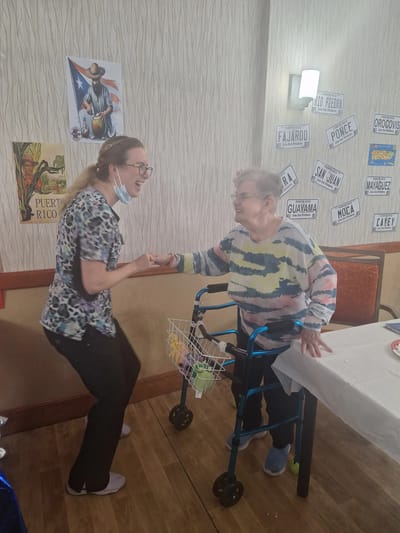
Casa De Ramana Rehabilitation Center is a nursing home in Framingham, MA, offering long-term care, memory care, hospice care, rehabilitation, and respite care. With a compassionate and welcoming environment, the community ensures older adults are treated well throughout their stay. 24-hour care, well-balanced meals, and recreational activities are also provided to improve residents’ quality of life. Following a holistic approach to care, the community strives to meet residents’ unique needs and preferences for their recovery and wellness.

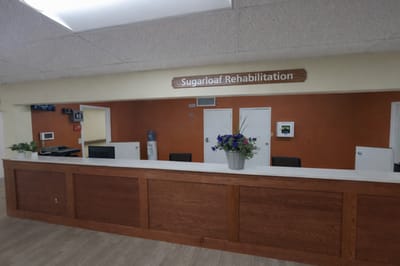
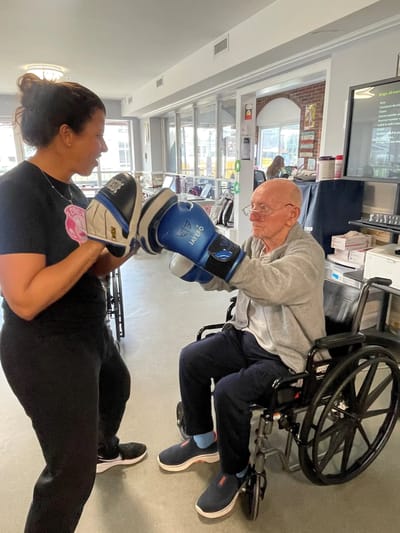
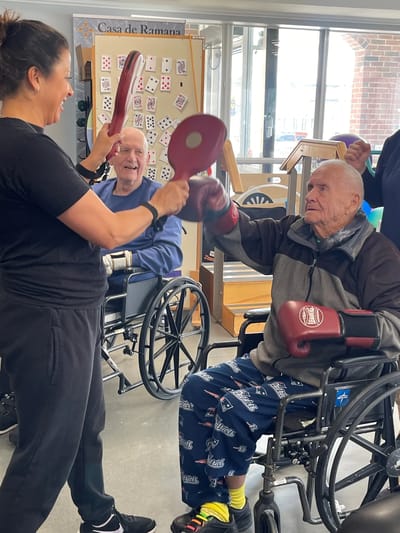
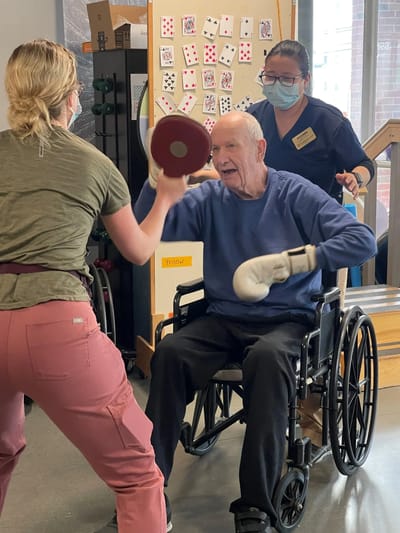
Hobby clubs, games, and arts and crafts ensure residents can explore new interests and gain meaningful experiences. Residents can also rest and freely interact with their surroundings in the spacious and clean common areas. Situated near the Farm Pond, restaurants, shops, and bus stops, the community ensures a stress-free retirement. This nursing home is a trusted choice for senior living in Massachusetts, especially with top-notch amenities and high standards of care.

Quality ratings

Measured by Centers for Medicare & Medicaid Services (CMS)

Overall rating Info The Overall CMS Rating combines results from health inspections, staffing levels and quality measures. Health inspections carry the most weight. Staffing and quality scores can increase or decrease the final rating based on performance compared to state and national standards.
▲ 38.0% Above MA avg. ▲ 38.0% Above MA avg.MA average: 2.9Click the badge to see the full State ranking.Click here to see the full State ranking.
Health Inspection Info Based on the results of the facility's three most recent standard inspections and any complaint investigations. CMS reviews the number, scope, and severity of deficiencies, with more recent findings weighted more heavily.
▲ 40.5% Above MA avg. ▲ 40.5% Above MA avg.MA average: 2.8Click the badge to see the full State ranking.Click here to see the full State ranking.
Staffing Info Measures average nursing staff hours per resident per day, including Registered Nurses (RNs) and total nursing staff. Ratings are adjusted based on the level of care residents require and are compared to state and national benchmarks.
▲ 33.3% Above MA avg. ▲ 33.3% Above MA avg.MA average: 3.0Click the badge to see the full State ranking.Click here to see the full State ranking.
Quality Measures Info Based on clinical and physical health indicators reported to CMS, such as hospital readmissions, falls, pressure ulcers, and improvements in mobility. These measures reflect how well residents' health needs are being managed.
▼ 5.6% Below MA avg. ▼ 5.6% Below MA avg.MA average: 3.2Click the badge to see the full State ranking.Click here to see the full State ranking.

Staffing hours breakdown

Info Daily nursing hours per resident by staff type, reported to CMS. Higher is generally better — compare this facility to state and national averages to see where staffing stands.

Hours per resident per day — compared to Massachusetts state averages

Total nursing care / resident Info This home is ranked 38th out of 93 homes in Massachusetts for nurse hours. Total adjusted nursing hours per resident per day, combining RN, LPN, and aide time. CMS adjusts this for case-mix so facilities can be fairly compared.
4h 1m per day
Rank #38 / 93Nurse hours — State benchmarkedThis home is ranked 38th out of 93 homes in Massachusetts. Shows adjusted nurse hours per resident per day benchmarked to the Massachusetts average, with a ranking across 93 Massachusetts facilities. More hours mean more direct care. The national average is about 3.5 hrs; below 3.0 is a red flag.Rankings are based only on facilities in Massachusetts that report data for that category. Facilities without available data are excluded from the ranking.Click the rank badge to see the full State ranking.Click here to see the full State ranking.
This facility Massachusetts avg (3h 56m per day)
vs Massachusetts avg
+2%

2 of 6 metrics below state avg

Standout metric Physical Therapist is +49% above state avg
Staff typeHours / Day / Residentvs state avg
Registered Nurse (RN) Info RNs hold the highest nursing license and can assess residents, interpret test results, and direct care plans. More RN hours per day often signals stronger clinical oversight and faster response to health changes. 39m per day ■ Avg State avg: 39m per day · National avg: 41m per day
LPN / LVN Info Licensed Practical Nurses (LPNs) or Licensed Vocational Nurses (LVNs) deliver routine hands-on care — medication administration, wound dressing, and monitoring vital signs. They work under RN supervision and make up a large share of daily bedside care. 57m per day ■ Avg State avg: 57m per day · National avg: 52m per day
Nurse Aide Info Certified Nurse Aides (CNAs) provide the most direct day-to-day assistance: bathing, dressing, feeding, and mobility. Nurse aide hours are typically the largest staffing category and directly affect residents' quality of life. 2h 0m per day ▼ 12% State avg: 2h 16m per day · National avg: 2h 20m per day
Weekend Total Nursing Info Combined nursing hours (RN + LPN + Nurse Aide) per resident per day on weekends. Staffing often drops on weekends — this figure reveals whether the facility maintains adequate coverage outside of weekday hours. 3h 20m per day ▼ 4% State avg: 3h 29m per day · National avg: 3h 27m per day
Physical Therapist Info Hours per resident per day provided by licensed Physical Therapists (PTs) or PT Assistants. PT services help residents recover mobility after injury or illness and are especially important for post-acute (short-stay) rehabilitation. 7m per day ▲ 49% State avg: 5m per day · National avg: 4m per day
Weekend RN Info Registered nurse hours specifically on weekends. Facilities sometimes reduce RN presence on Saturdays and Sundays — a low weekend RN figure compared to weekday hours can indicate reduced clinical oversight when most administrative staff are absent. 27m per day ■ Avg State avg: 27m per day · National avg: 29m per day

Capacity and availability

This home usually has limited availability

Higher occupancy than the Massachusetts average: 82%
Occupancy rate
89.6% Rank #34 / 96Occupancy rate — State benchmarkedThis home is ranked 34th out of 96 homes in Massachusetts. Shows this facility's occupancy rate versus the Massachusetts average, with its Statewide rank out of 96. Higher occupancy signals strong local demand and financial stability.Rankings are based only on facilities in Massachusetts that report data for that category. Facilities without available data are excluded from the ranking.Click the rank badge to see the full State ranking.Click here to see the full State ranking.
Avg. Length of Stay
269 days
Bed community size
124-bed community Rank #50 / 280Bed count — State benchmarkedThis home is ranked 50th out of 280 homes in Massachusetts. Shows this facility's certified or reported bed count compared to other Massachusetts facilities. Larger communities may offer more amenities, programs, and on-site services for residents and families.Rankings are based only on facilities in Massachusetts that report data for that category. Facilities without available data are excluded from the ranking.Click the rank badge to see the full State ranking.Click here to see the full State ranking.
A larger shared setting that may offer more common spaces and organized community services.
Walk Score
Walk Score: 63 / 100 Rank #205 / 499Walk Score — State benchmarkedThis home is ranked 205th out of 499 homes in Massachusetts. Shows how walkable this facility's neighborhood is compared to the average Walk Score across Massachusetts facilities. Higher scores benefit residents, families, and staff.Rankings are based only on facilities in Massachusetts that report data for that category. Facilities without available data are excluded from the ranking.Click the rank badge to see the full State ranking.Click here to see the full State ranking.
Moderately walkable. Some errands can be accomplished on foot, with a mix of nearby amenities.

Therapy & Rehabilitation

1 service
Rehabilitation Services

Staffing & Medical

1 service
Doctor on Staff

Additional Services

1 service
Home Care

Amenities & Lifestyle

Specific ProgramsAlzheimer/Dementia Program, Orthopedic Needs, Cardio Pulmonary, Falls/Parkinson's, Stroke Recovery, Wound Care Program, Peritoneal Dialysis, Therapy Services

Contact Casa de Ramana Rehabilitation Center

Staffing Data

Reporting period: October 1 – December 31, 2025 (Q4 2025). Source: CMS Payroll-Based Journal report.

Total staff 156
Employees 148
Contractors 8
Staff to resident ratio 1.43 : 1
14% fewer staff per resident than Massachusetts average
Massachusetts average ratio: 1.66 : 1 Massachusetts average ratio: 1.66 : 1See full Massachusetts ranking
Avg staff/day 61
Average shift 7.7 hours
0% compared with Massachusetts average
Massachusetts average: 7.9 hours Massachusetts average shift: 7.9 hoursSee full Massachusetts ranking
Total staff hours (quarter) 43,471

Nursing staff breakdown

Q4 2025 · Oct 1 – Dec 31 More info This data comes from the CMS Payroll-Based Journal report covering October 1 – December 31, 2025.
Registered Nurse

Manages medical care and health needs.

RN Staff Info All 16 RN Staff are full-time employees. No contractors work on this role. 16
Average shift length Info Average shift length. Calculated as total hours divided by days worked and average staff per day. 8.6 hours
Licensed Practical Nurse

Assists with medical care and medications.

LPN Staff Info All 26 LPN Staff are full-time employees. No contractors work on this role. 26
Average shift length Info Average shift length. Calculated as total hours divided by days worked and average staff per day. 8.8 hours
Certified Nursing Assistant

Helps with daily care and mobility.

CNA Staff Info All 65 CNA Staff are full-time employees. No contractors work on this role. 65
Average shift length Info Average shift length. Calculated as total hours divided by days worked and average staff per day. 7.6 hours

Contractor staffing

Q4 2025 · Oct 1 – Dec 31 More info This data comes from the CMS Payroll-Based Journal report covering October 1 – December 31, 2025.

Total hours from contractors

0.5%

216 contractor hours this quarter

Occupational Therapy Assistant: 4 Medical Director: 3 Mental Health Service Worker: 1

Staff by category

Q4 2025 · Oct 1 – Dec 31 More info This data comes from the CMS Payroll-Based Journal report covering October 1 – December 31, 2025.
Certified Nursing Assistant6506519,01992100%7.6
Licensed Practical Nurse260268,99392100%8.8
Registered Nurse160164,91392100%8.6
Speech Language Pathologist4041,4969098%7.2
Other Dietary Services Staff7071,44892100%6.8
Respiratory Therapy Technician3031,0876874%7.4
Mental Health Service Worker2139226571%7.8
Physical Therapy Assistant8088966773%7
Clinical Nurse Specialist3038486470%8
Qualified Social Worker6066246975%6.2
Physical Therapy Aide2025566975%7.2
Administrator1015126470%8
Dietitian1014966267%8
Therapeutic Recreation Specialist1014786065%8
Nurse Practitioner1014485661%8
Occupational Therapy Aide1013366065%5.6
Qualified Activities Professional1012103336%6.4
Medical Director0331373134%4
Occupational Therapy Assistant044544043%1.3
65 Certified Nursing Assistant
% of Days 100%
26 Licensed Practical Nurse
% of Days 100%
16 Registered Nurse
% of Days 100%
4 Speech Language Pathologist
% of Days 98%
7 Other Dietary Services Staff
% of Days 100%
3 Respiratory Therapy Technician
% of Days 74%
3 Mental Health Service Worker
% of Days 71%
8 Physical Therapy Assistant
% of Days 73%
3 Clinical Nurse Specialist
% of Days 70%
6 Qualified Social Worker
% of Days 75%
2 Physical Therapy Aide
% of Days 75%
1 Administrator
% of Days 70%
1 Dietitian
% of Days 67%
1 Therapeutic Recreation Specialist
% of Days 65%
1 Nurse Practitioner
% of Days 61%
1 Occupational Therapy Aide
% of Days 65%
1 Qualified Activities Professional
% of Days 36%
3 Medical Director
% of Days 34%
4 Occupational Therapy Assistant
% of Days 43%

Penalties and fines

Includes penalties issued in 2024

Federal penalties imposed by CMS for regulatory violations, including civil money penalties (fines) and denials of payment for new Medicare/Medicaid admissions.

Source: CMS Penalties Database (Data as of Jan 2026)

Total fines amount $9K Rank #53 / 94Federal fines — State benchmarkedThis home is ranked 53rd out of 94 homes in Massachusetts. Shows this facility's cumulative CMS federal fine dollars versus the Massachusetts average among facilities with fines, and where it ranks among 94 facilities in the pool. Lower total dollars mean a better rank.Rankings are based only on facilities in Massachusetts that report data for that category. Facilities without available data are excluded from the ranking.Click the rank badge to see the full State ranking.Click here to see the full State ranking.
88% lower than Massachusetts average

Massachusetts average: $72K

Number of fines 1
42% fewer fines than Massachusetts average

Massachusetts average: 1.7

Payment Denials Info Serious action where Medicare and/or Medicaid temporarily stops payments for new residents until issues are fixed. 0
100% fewer payment denials than Massachusetts average

Massachusetts average: 0.1

Fines amount comparison
This facility $9K
Massachusetts average $72K
Penalty History

Penalties are imposed by CMS for violations of federal nursing home regulations.

1 penalty in the past 3 years

Sep 3, 2024 · $9K

Civil Money Penalty Info Fines imposed for noncompliance, which can be assessed per day or per instance of violation. Sep 3, 2024
$9K

Last updated: Jan 2026

Quality of care over time

These measures show how residents usually do over time at this home, based on health outcomes and preventive care.

High-risk clinical events score Info A composite score based on pressure ulcers, falls with injury, weight loss, walking ability decline, and activities of daily living decline. 10.7
In line with Massachusetts average

Massachusetts average: 10.2

Functional decline score Info A composite score based on activities of daily living decline, walking ability decline, and incontinence. 22.4
12% worse than Massachusetts average

Massachusetts average: 20.0

Long-stay resident measures
Need for Help with Daily Activities Increased Info Percent of long-stay residents whose need for help with daily activities has increased 22.1%
18% worse than Massachusetts average

Massachusetts average: 18.7%

Walking Ability Worsened Info Percent of long-stay residents whose ability to move independently worsened 20.1%
In line with Massachusetts average

Massachusetts average: 19.3%

Low Risk Residents with Bowel/Bladder Incontinence Info Percent of low risk long-stay residents who lose control of their bowels or bladder 24.9%
13% worse than Massachusetts average

Massachusetts average: 22.1%

Falls with Major Injury Info Percent of long-stay residents experiencing one or more falls with major injury 4.6%
29% worse than Massachusetts average

Massachusetts average: 3.6%

High Risk Residents with Pressure Ulcers Info Percent of long-stay high risk residents with pressure ulcers 4.6%
In line with Massachusetts average

Massachusetts average: 4.7%

Urinary Tract Infection Info Percent of long-stay residents with a urinary tract infection 0.5%
74% better than Massachusetts average

Massachusetts average: 2.1%

Lost Too Much Weight Info Percent of long-stay residents who lose too much weight 2.0%
62% better than Massachusetts average

Massachusetts average: 5.2%

Depressive Symptoms Info Percent of long-stay residents who have depressive symptoms 11.0%
In line with Massachusetts average

Massachusetts average: 10.7%

Antipsychotic Use Info Percent of long-stay residents who received an antipsychotic medication 23.6%
17% worse than Massachusetts average

Massachusetts average: 20.3%

Pneumococcal Vaccine Info Percent of long-stay residents assessed and appropriately given the pneumococcal vaccine 98.5%
7% better than Massachusetts average

Massachusetts average: 91.9%

Influenza Vaccine Info Percent of long-stay residents assessed and appropriately given the seasonal influenza vaccine 99.1%
In line with Massachusetts average

Massachusetts average: 94.8%

Short-stay resident measures
Pneumococcal Vaccine Info Percent of short-stay residents assessed and appropriately given the pneumococcal vaccine 94.0%
23% better than Massachusetts average

Massachusetts average: 76.7%

Antipsychotic medication increase Info Percent of short-stay residents who newly received an antipsychotic medication 3.4%
158% worse than Massachusetts average

Massachusetts average: 1.3%

Influenza Vaccine Info Percent of short-stay residents assessed and appropriately given the seasonal influenza vaccine 97.5%
25% better than Massachusetts average

Massachusetts average: 77.7%

Breakdown by payment type

Medicare

43% of new residents, usually for short-term rehab.

Typical stay 1 months

Private pay

54% of new residents, often for short stays.

Typical stay 2 - 3 months

Medicaid

3% of new residents, often for long-term daily care.

Typical stay 9 - 10 years

Facility Characteristics

Source: CMS Long-Term Care Facility Characteristics (Data as of Jan 2026)

Total residents 109
Medicare
10
9.2% of residents
Medicaid
54
49.5% of residents
Private pay or other
45
41.3% of residents
Programs & Services
Residents Group

Residents meet regularly to discuss policies, care quality, and activities

Active Resident Council

Organized group of residents that meets regularly to discuss facility policies, quality of life, and activities.

Finances and operations

Based on CMS SNF Cost Report for fiscal year ending in 12/2023.

For-profit
Operated by a single business entity.
Net patient revenue Info Net patient revenue — what the home actually collects for resident care, after contractual allowances, bad debt and discounts are subtracted from its gross charges (CMS cost report, Worksheet G-3). It covers resident care only; money the home earns from other sources is shown separately as "Other income."
$13.5M
Net patient income Info Net patient income: net patient revenue minus the home's total operating expenses. A positive figure means it earns more from resident care than it spends to deliver it; a negative figure means the opposite. It excludes non-operating "other income."
-$691.3K
For-profit Operated by a single business entity.
Net patient revenue Info Net patient revenue — what the home actually collects for resident care, after contractual allowances, bad debt and discounts are subtracted from its gross charges (CMS cost report, Worksheet G-3). It covers resident care only; money the home earns from other sources is shown separately as "Other income."
$13.5M Rank #54 / 96Revenue — State benchmarkedThis home is ranked 54th out of 96 homes in Massachusetts. Shows this facility's annual revenue compared to the Massachusetts average. Higher revenue generally means more resources for staffing and capital — read alongside Payroll %.Rankings are based only on facilities in Massachusetts that report data for that category. Facilities without available data are excluded from the ranking.Click the rank badge to see the full State ranking.Click here to see the full State ranking.
Net patient income Info Net patient income: net patient revenue minus the home's total operating expenses. A positive figure means it earns more from resident care than it spends to deliver it; a negative figure means the opposite. It excludes non-operating "other income."
-$691.3K
Other income Info Money the home earns outside of resident care — such as investments, grants, rentals and other non-operating sources (CMS cost report, Worksheet G-3). It is tracked separately from net patient revenue: it is not part of that figure, and it is not included in net patient income.
$44.8K
Payroll costs Info Staff salaries plus wage-related costs — benefits such as payroll taxes, health insurance and retirement — from the home's own accounting records (CMS cost report, Worksheet A). Contract or agency labor is counted separately, under other operating costs. Rank #55 / 96Payroll — State benchmarkedThis home is ranked 55th out of 96 homes in Massachusetts. Shows total annual staff payroll benchmarked to the Massachusetts average. Higher payroll investment relative to peers often signals better staffing and less reliance on cheaper contract labor.Rankings are based only on facilities in Massachusetts that report data for that category. Facilities without available data are excluded from the ranking.Click the rank badge to see the full State ranking.Click here to see the full State ranking.
$9.0M 66.3% of net patient revenue Info Payroll as a share of revenue: staff salaries and wage-related benefits divided by net patient revenue. A higher figure means more of each revenue dollar goes to staff pay. Rank #63 / 96Payroll % — State benchmarkedThis home is ranked 63rd out of 96 homes in Massachusetts. Shows payroll as a percentage of revenue versus the Massachusetts average. Well-run Massachusetts facilities typically land around 54–65% — the top third Statewide. Below 25% may signal understaffing or heavy agency use — read with Staffing ratings.Rankings are based only on facilities in Massachusetts that report data for that category. Facilities without available data are excluded from the ranking.Click the rank badge to see the full State ranking.Click here to see the full State ranking.
Other operating costs Info Everything it costs to run the home apart from payroll — food, utilities, supplies, maintenance, contract labor and administration. Calculated as total operating expense minus payroll (staff salaries and wage-related benefits).
$5.2M
Total costs Info The home's total operating expense for the year — all the costs of running it, salaries included (CMS cost report, Worksheet G-3).
$14.2M

What does this home offer?

Building type icon
Building type icon

Building Type: 3-story

On-site medical care and health services icon

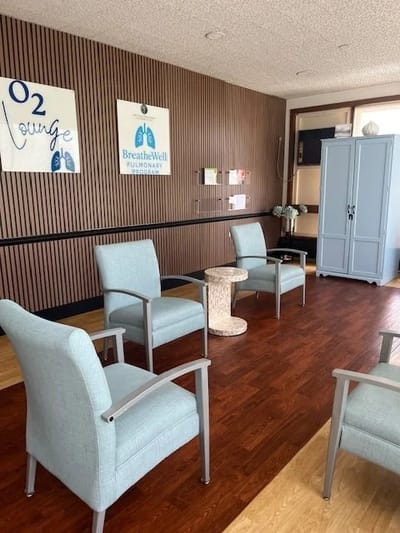
On-site Medical Care and Health Services

Rehabilitative support icon

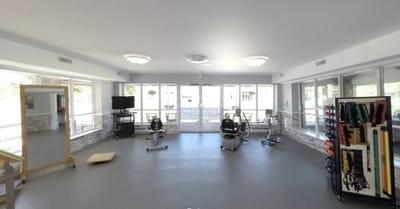
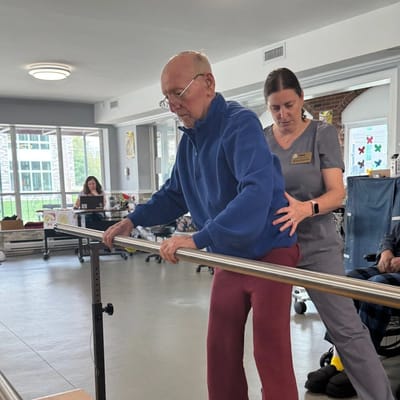
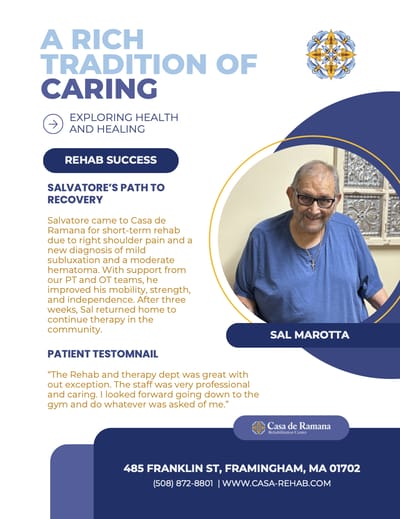
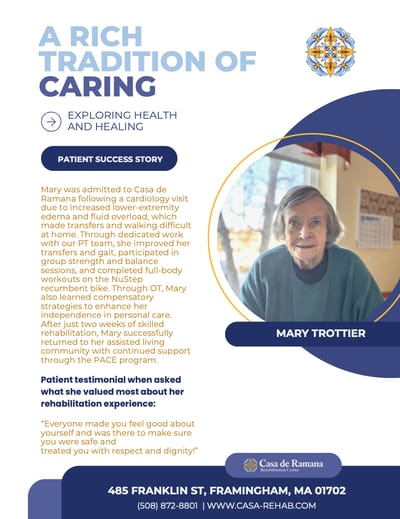
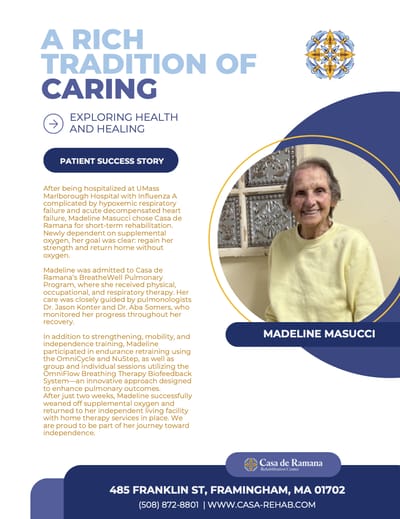
Rehabilitative Support

Who this home usually serves

TYPE OF STAY

Mix of rehab and long-term care

This home supports both short-term rehab and long-term care, with residents staying for a wide range of durations.

Most new residents arrive under private pay (54% of admissions), and a typical private pay stay runs around 2 - 3 months.

Admissions
243 total

Coverage residents most often arrive under.

Medicare 43%
Private pay 54%
Medicaid 3%
Discharges
141 total

Coverage residents most often leave under.

Medicare 64%
Private pay 27%
Medicaid 9%

Living Spaces & Floor Plans for Casa de Ramana Rehabilitation Center

Places of interest near Casa de Ramana Rehabilitation Center

Address 1.1 miles from city center Info Estimated distance in miles from Framingham's city center to Casa de Ramana Rehabilitation Center's address, calculated via Google Maps.

Calculate Travel Distance to Casa de Ramana Rehabilitation Center

Add your location

Address

Compare Nursing Homes around Framingham

The information below is reported by the Massachusetts Executive Office of Elder Affairs and Department of Public Health.

3 facilities compared · CMS & MA Dept. of Health data

Bethany Health Care Center
NH
HC
MC
NC
RC
Framingham
169
Facility 169
MA AVG 94
Rank #14 / 280
78.3%
Facility 78.3%
MA AVG 82%
Rank #61 / 96
-4%
6.03
Facility 6.03
MA AVG 3.93
Rank #4 / 93
+45%+53%
$9.3k
Facility $9.3k
MA AVG $76.6k
Rank #59 / 94
4
Facility 4
MA AVG 32.7
Rank #2 / 93
1.3
Facility 1.3
MA AVG 7.2
Rank #1 / 93
280-
50
Facility 50
MA AVG 53
Rank #259 / 499
Marian Batho
$12.8M
Facility $12.8M
MA AVG $17.4M
Rank #60 / 96
$11.0M
Facility $11.0M
MA AVG $6.5M
Rank #19 / 96
86.2%
Facility 86.2%
MA AVG 43.6%
Rank #1 / 96
225535
Casa de Ramana Rehabilitation Center
NH
MC
Framingham
124
Facility 124
MA AVG 94
Rank #50 / 280
89.6%
Facility 89.6%
MA AVG 82%
Rank #34 / 96
+9%
4.01
Facility 4.01
MA AVG 3.93
Rank #38 / 93
-19%+2%
$8.5k
Facility $8.5k
MA AVG $76.6k
Rank #53 / 94
20
Facility 20
MA AVG 32.7
Rank #30 / 93
5.0
Facility 5.0
MA AVG 7.2
Rank #31 / 93
1104-
63
Facility 63
MA AVG 53
Rank #205 / 499
Michael Castro
$13.5M
Facility $13.5M
MA AVG $17.4M
Rank #54 / 96
$9.0M
Facility $9.0M
MA AVG $6.5M
Rank #55 / 96
66.3%
Facility 66.3%
MA AVG 43.6%
Rank #63 / 96
225179
St Patrick’s Manor
NH
AL
HC
MC
PC
RC
Framingham
333
Facility 333
MA AVG 94
Rank #2 / 280
71.9%
Facility 71.9%
MA AVG 82%
Rank #72 / 96
-12%
3.79
Facility 3.79
MA AVG 3.93
Rank #50 / 93
0%-4%
$33.2k
Facility $33.2k
MA AVG $76.6k
Rank #77 / 94
29
Facility 29
MA AVG 32.7
Rank #52 / 93
4.1
Facility 4.1
MA AVG 7.2
Rank #21 / 93
4273-
16
Facility 16
MA AVG 53
Rank #439 / 499
David Hines
$32.9M
Facility $32.9M
MA AVG $17.4M
Rank #3 / 96
$17.2M
Facility $17.2M
MA AVG $6.5M
Rank #2 / 96
52.3%
Facility 52.3%
MA AVG 43.6%
Rank #72 / 96
225430

Financial Assistance for
Nursing Home in Massachusetts

Casa de Ramana Rehabilitation Center is located in Framingham, Massachusetts.
Here are the financial assistance programs available to residents in Massachusetts.

Get Financial aid guidance

Home Care Program

MassHealth Home Care

Age 60+
General Massachusetts resident, at risk of nursing home placement.
Income Limits (2025) ~$1,500/month individual, varies by region
Asset Limits $2,000 individual, excludes home, car
MA

Coordinated through Aging Services Access Points (ASAPs); high demand in urban areas.

Benefits
In-home care (3-5 hours/day) Homemaker services Respite care (up to 14 days/year) Adult day care (~$75/day)

Frail Elder Waiver

Massachusetts Medicaid FE Waiver

Age 65+
General Massachusetts resident, Medicaid-eligible, nursing home-level care need.
Income Limits (2025) ~$2,829/month 300% FBR, individual
Asset Limits $2,000 (individual), $3,000 (couple).
MA

Requires clinical eligibility determination.

Benefits
Personal care (5-7 hours/day) Respite care (240 hours/year) Adult day care (~$75/day) Home health services

Senior Care Options (SCO)

Massachusetts Senior Care Options

Age 65+
General Massachusetts resident, eligible for MassHealth (Medicare optional), nursing home-level care need.
Income Limits (2025) ~$2,829/month (300% FBR, individual); QIT allowed.
Asset Limits $2,000 (individual), $3,000 (couple) (excludes home up to $713,000, car).
MA

Not available in Dukes/Nantucket Counties; multiple SCO providers (e.g., CCA, Tufts).

Benefits
Personal care (5-7 hours/day) Medical care Respite (240 hours/year) Adult

Medicare Savings Program (MSP)

Massachusetts Medicare Savings Program (MassHealth Buy-In)

Age 65+ or disabled
General Massachusetts resident, Medicare Part A/B.
Income Limits (2025) ~$2,510/month (QMB), ~$3,380/month (SLMB), ~$3,598/month (QI)—individual.
Asset Limits $9,430 (individual), $14,130 (couple).
MA

Three tiers; no waitlist; includes Extra Help for Part D.

Benefits
Covers Part B premiums ($174.70/month) Deductibles ($240/year) Copays (~20%)

National Family Caregiver Support Program (NFCSP) Respite

Massachusetts NFCSP Respite Care

Age
General Caregivers of 60+ needing care or 55+ caregivers of others; Massachusetts resident; functional needs (2+ ADLs).
Income Limits (2025) Prioritizes ~$24,980/year (individual); no strict cap.
Asset Limits Not assessed; need-based.
MA

27 ASAPs; prioritizes low-income, rural caregivers.

Benefits
Respite (4-6 hours/week or 5 days/year) Adult day care ($60/day) Caregiver training Supplies (~$500/year)

Prescription Advantage

Massachusetts Prescription Advantage

Age 65+ or disabled
General Massachusetts resident, enrolled in Medicare Part D (or ineligible for Medicare).
Income Limits (2025) No strict limit; copays vary by income ~$24,980-$75,000/year individual
Asset Limits Not assessed.
MA

Supplements Medicare Part D; no enrollment fee for low-income.

Benefits
Covers prescription copays ($5-$40/drug) Fills coverage gaps Catastrophic cost protection ($4,000+ covered)

VA Aid and Attendance (A&A) and Housebound Benefits

Massachusetts VA Aid and Attendance/Housebound

Age 65+ or disabled veteran/spouse
General Massachusetts resident, wartime service, need for ADL help (A&A) or homebound.
Income Limits (2025) Net income < ~$1,984/month (veteran with dependent, A&A); pension offsets income.
Asset Limits ~$155,356 net worth limit
MA

High veteran demand statewide.

Benefits
Cash (~$1,433-$2,642/month veteran, ~$951-$1,318 spouse) for care costs (e.g., in-home, assisted living)

Frequently Asked Questions about Casa de Ramana Rehabilitation Center

Is Casa de Ramana Rehabilitation Center in a walkable area?

Casa de Ramana Rehabilitation Center has a walk score of 63. Moderately walkable. Some errands can be accomplished on foot, with a mix of nearby amenities.

What is the occupancy rate at Casa de Ramana Rehabilitation Center?

Casa de Ramana Rehabilitation Center's occupancy is 89.6%.

Does Casa de Ramana Rehabilitation Center have different floorplan options?

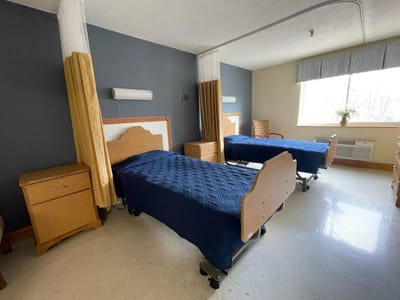
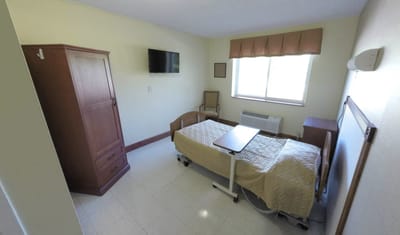
Yes — see the floorplan options available at Casa de Ramana Rehabilitation Center on this page.

Does Casa de Ramana Rehabilitation Center operate as a for-profit or non-profit?

Casa de Ramana Rehabilitation Center is registered as a for-profit.

Are there photos of Casa de Ramana Rehabilitation Center?

Yes — there are 44 photos of Casa de Ramana Rehabilitation Center in the photo gallery on this page.

What is the address of Casa de Ramana Rehabilitation Center?

Casa de Ramana Rehabilitation Center is located at 485 Franklin St, Framingham, MA 01702.

What is the phone number of Casa de Ramana Rehabilitation Center?

(508) 872-8801 will put you in contact with the team at Casa de Ramana Rehabilitation Center.

Guides for Better Senior Living

Care Cost Calculator: See Prices in Your Area

Nursing Home Data Explorer

Don’t Wait Too Long: 7 Red Flag Signs Your Parent Needs Assisted Living Now

The True Cost of Assisted Living in 2025 – And How Families Are Paying For It

Understanding Senior Living Costs: Pricing Models, Discounts & Financial Assistance