


Occupancy rate
100%
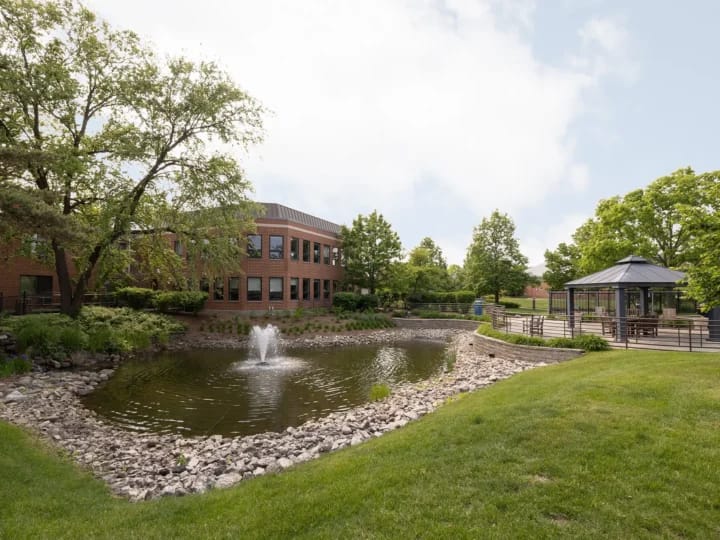

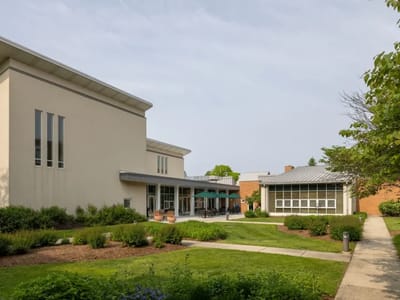


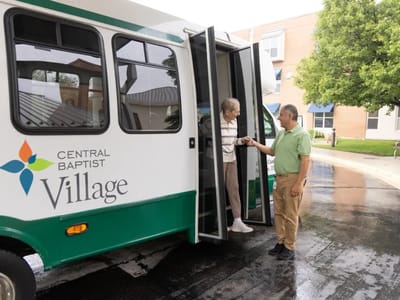
Central Baptist Village is a non-profit, 97-resident senior living community in Norridge, Illinois, that operates at full capacity. Founded in 1896, the facility is owned by Anna-Liisa Lacroix, led by Executive Director Dawn Mondschein, and functions as both an assisted living and skilled nursing home. They accept Medicare, Medicaid, and private pay. Since the average length of stay is 424 days, the population is a mix of people finishing up short-term rehabilitation and residents there for permanent long-term care.
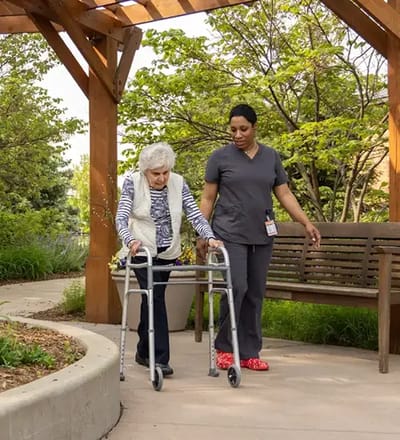
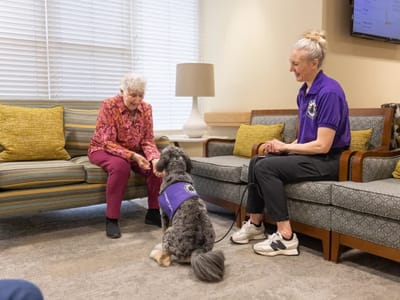
The nursing staff provides an average of 4 hours and 33 minutes of direct care to each resident every day. That daily hands-on time breaks down to 1 hour and 6 minutes from registered nurses, 33 minutes from licensed practical nurses, and 2 hours and 49 minutes from certified nurse aides. This 24-hour clinical support covers physical rehabilitation services alongside three distinct tiers of memory support, including the Bridge Care and Campus programs.
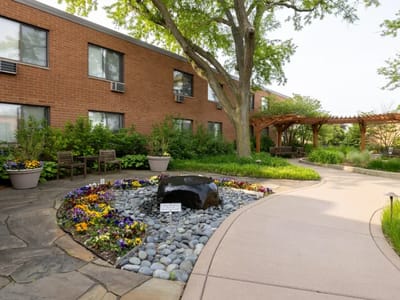
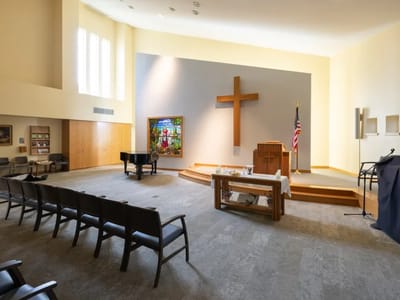
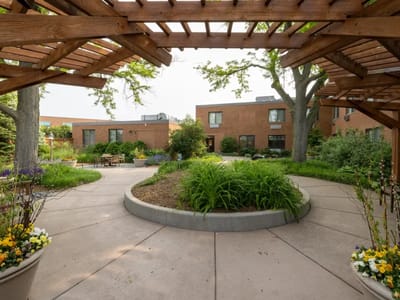
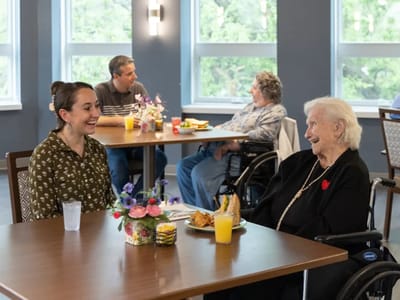
For day-to-day life, the community hosts general spiritual activities to serve seniors of all faiths. The surrounding urban neighborhood is highly walkable, scoring an 87 out of 100, which makes it easy for visitors to access public transit and nearby services on foot.
Older adults exploring care options can contact the main desk to ask about the different memory care programs, check on room openings, or schedule a tour of the property. The business office is also available to explain how Medicare and Medicaid coverages apply to the monthly billing.
| Staff type | Hours / Day / Resident | vs state avg |
|---|---|---|
|
Registered Nurse (RN)
| 1h 6m per day | ▲ 49% State avg: 44m per day · National avg: 41m per day |
|
LPN / LVN
| 33m per day | ▼ 13% State avg: 38m per day · National avg: 52m per day |
|
Nurse Aide
| 2h 49m per day | ▲ 32% State avg: 2h 8m per day · National avg: 2h 20m per day |
|
Weekend Total Nursing
| 3h 48m per day | ▲ 23% State avg: 3h 5m per day · National avg: 3h 26m per day |
|
Physical Therapist
| 2m per day | ▼ 41% State avg: 3m per day · National avg: 4m per day |
|
Weekend RN
| 38m per day | ▲ 10% State avg: 34m per day · National avg: 28m per day |
Key information about the people who lead and staff this community.
In Illinois, the Department of Public Health, Office of Health Care Regulation conducts annual unannounced surveys to assess compliance with state and federal healthcare facility standards.
Deficiencies
| This Facility | IL Average | vs. IL Avg |
|---|---|---|---|
|
Total deficiencies
| 25 | 7 | This facility has 257% more total deficiencies than a typical Illinois nursing home (25 vs. IL avg 7).↑ 257% worse |
|
Deficiencies per inspection
| 6.3 | 0.9 | This facility has 600% more deficiencies per inspection than a typical Illinois nursing home (6.3 vs. IL avg 0.9).↑ 600% worse |
Inspections
| This Facility | IL Average | vs. IL Avg |
|---|---|---|---|
|
Total inspections
| 4 | 8 | This facility has had 50% fewer total inspections than the Illinois average (4 vs. IL avg 8). More inspections can mean more regulatory scrutiny rather than worse care.↓ 50% fewer |
State average 10.4
Last Health inspection on Aug 2024
State average 36.8
State average 3.68
Health citations are formal notices following inspections when they fail to comply with safety and care standards.
All 19 citations resulted from standard inspections.
State average: 0.7
State average: 3.6
Reporting period: October 1 – December 31, 2025 (Q4 2025). Source: CMS Payroll-Based Journal report.
Manages medical care and health needs.
Assists with medical care and medications.
Helps with daily care and mobility.
Total hours from contractors
3,578 contractor hours this quarter
| Certified Nursing Assistant | 80 | 20 | 100 | 23,919 | 92 | 100% | 7.4 |
| Registered Nurse | 16 | 14 | 30 | 5,802 | 92 | 100% | 7.9 |
| Licensed Practical Nurse | 14 | 5 | 19 | 4,697 | 92 | 100% | 7.8 |
| Other Dietary Services Staff | 14 | 1 | 15 | 3,045 | 92 | 100% | 6.8 |
| Clinical Nurse Specialist | 6 | 0 | 6 | 3,005 | 71 | 77% | 8.1 |
| Dental Services Staff | 4 | 1 | 5 | 1,230 | 72 | 78% | 7.5 |
| Administrator | 2 | 0 | 2 | 562 | 63 | 68% | 4.8 |
| Nurse Practitioner | 1 | 0 | 1 | 481 | 60 | 65% | 8 |
| Mental Health Service Worker | 1 | 0 | 1 | 458 | 61 | 66% | 7.5 |
| Occupational Therapy Aide | 0 | 1 | 1 | 456 | 57 | 62% | 8 |
| Physical Therapy Aide | 0 | 3 | 3 | 444 | 64 | 70% | 6.4 |
| Dietitian | 1 | 0 | 1 | 397 | 61 | 66% | 6.5 |
| Speech Language Pathologist | 0 | 2 | 2 | 375 | 60 | 65% | 6.2 |
| Qualified Social Worker | 0 | 2 | 2 | 307 | 61 | 66% | 5 |
| Physical Therapy Assistant | 0 | 2 | 2 | 302 | 68 | 74% | 4.4 |
| Respiratory Therapy Technician | 0 | 4 | 4 | 249 | 46 | 50% | 5.4 |
| Occupational Therapy Assistant | 0 | 1 | 1 | 47 | 9 | 10% | 5.2 |
| Medical Director | 1 | 0 | 1 | 39 | 13 | 14% | 3 |
Federal penalties imposed by CMS for regulatory violations, including civil money penalties (fines) and denials of payment for new Medicare/Medicaid admissions.
Source: CMS Penalties Database
No penalties in the past 3 years
No civil money penalties or payment denials were reported in the last 3 years.
These measures show how residents usually do over time at this home, based on health outcomes and preventive care.
Illinois average: 9.7
Illinois average: 18.6
Illinois average: 15.5%
Illinois average: 18.4%
Illinois average: 21.6%
Illinois average: 3.4%
Illinois average: 5.3%
Illinois average: 1.8%
Illinois average: 6.5%
Illinois average: 48.1%
Illinois average: 20.2%
Illinois average: 89.2%
Illinois average: 91.6%
Illinois average: 2.04
Illinois average: 2.25
Illinois average: 68.3%
Illinois average: 2.3%
Illinois average: 63.0%
Illinois average: 26.2%
Illinois average: 14.0%
Illinois average: 0.8%
Illinois average: 53.7%
Illinois average: 50.6%
Quality measures are calculated from Minimum Data Set (MDS) assessments. For most measures, lower percentages indicate better care quality.
56% of new residents, usually for short-term rehab.
36% of new residents, often for short stays.
8% of new residents, often for long-term daily care.
Source: CMS Long-Term Care Facility Characteristics (Data as of Jan 2026)
Residents meet regularly to discuss policies, care quality, and activities
Organized group of residents that meets regularly to discuss facility policies, quality of life, and activities.
Data sourced from CMS Long-Term Care Facility Characteristics quarterly report. Payer mix reflects the current resident census by primary payment source.
Historical financial and operational data for CENTRAL BAPTIST VILLAGE (Assisted Living) from 2011–2023, based on CMS SNF Cost Reports.
Key figures below are for fiscal year ending in 12/2023.
Based on CMS SNF Cost Report for fiscal year ending in 12/2023.
Most residents typically stay for a few weeks or months before returning home or moving on.
Most new residents arrive under Medicare (56% of admissions), and a typical Medicare stay runs around 1 - 2 months.
Coverage residents most often arrive under.
Coverage residents most often leave under.
![]() 0.7 miles from city center
0.7 miles from city center
![]() Estimated distance in miles from Norridge's city center to CENTRAL BAPTIST VILLAGE (Assisted Living)'s address, calculated via Google Maps.
Estimated distance in miles from Norridge's city center to CENTRAL BAPTIST VILLAGE (Assisted Living)'s address, calculated via Google Maps.
Add your location
The information below is reported by the Illinois Department of Public Health, Office of Health Care Regulation.
| Vi at The Glen | NH AL IL MC | Glenview | 36
Facility
36
IL AVG
85
Rank
#365 / 419 | - | - | 6.15
Facility
6.15
IL AVG
3.10
Rank
#3 / 166 | +48% | +98% | $0
Facility
$0
IL AVG
$151.3k
Rank
#1 / 167 | 6
Facility
6
IL AVG
36.8
Rank
#4 / 167 | 3.0
Facility
3.0
IL AVG
3.7
Rank
#44 / 167 | - | 42 | A+ |
52
Facility
52
IL AVG
51
Rank
#310 / 648 | Pamela Lamb | $6.7MFiscal year ending 12/2023
Facility
$6.7MFiscal year ending 12/2023
IL AVG
$12.2M
Rank
#6 / 166 | $7.6MFiscal year ending 12/2023
Facility
$7.6MFiscal year ending 12/2023
IL AVG
$4.8M
Rank
#70 / 166 | 112.7%Fiscal year ending 12/2023
Facility
112.7%Fiscal year ending 12/2023
IL AVG
44.3%
Rank
#165 / 166 | 146107 | ||||
| Avantara Long Grove | NH HOS MC PC SNF | Long Grove (Edgebrook Downs) | 195
Facility
195
IL AVG
85
Rank
#30 / 419 |
83.6%
Facility
83.6%
IL AVG
73
Rank
#57 / 157 | +15% | 2.60
Facility
2.60
IL AVG
3.10
Rank
#113 / 166 | +33% | -16% | $0
Facility
$0
IL AVG
$151.3k
Rank
#1 / 167 | 27
Facility
27
IL AVG
36.8
Rank
#64 / 167 | 3.4
Facility
3.4
IL AVG
3.7
Rank
#76 / 167 | - | 163 | - |
34
Facility
34
IL AVG
51
Rank
#465 / 648 | Lily Osei | $19.9MFiscal year ending 12/2023
Facility
$19.9MFiscal year ending 12/2023
IL AVG
$12.2M
Rank
#19 / 166 | $9.0MFiscal year ending 12/2023
Facility
$9.0MFiscal year ending 12/2023
IL AVG
$4.8M
Rank
#36 / 166 | 45.2%Fiscal year ending 12/2023
Facility
45.2%Fiscal year ending 12/2023
IL AVG
44.3%
Rank
#145 / 166 | 145868 | ||||
| Bella Terra Streamwood | NH MC PC SNF | Streamwood | 214
Facility
214
IL AVG
85
Rank
#20 / 419 |
61.5%
Facility
61.5%
IL AVG
73
Rank
#127 / 157 | -16% | 2.62
Facility
2.62
IL AVG
3.10
Rank
#113 / 166 | +144% | -16% | $0
Facility
$0
IL AVG
$151.3k
Rank
#1 / 167 | 14
Facility
14
IL AVG
36.8
Rank
#21 / 167 | 2.3
Facility
2.3
IL AVG
3.7
Rank
#15 / 167 | - | 132 | - |
74
Facility
74
IL AVG
51
Rank
#135 / 648 | Forbright Bank | $15.3MFiscal year ending 12/2023
Facility
$15.3MFiscal year ending 12/2023
IL AVG
$12.2M
Rank
#48 / 166 | $5.7MFiscal year ending 12/2023
Facility
$5.7MFiscal year ending 12/2023
IL AVG
$4.8M
Rank
#58 / 166 | 37.4%Fiscal year ending 12/2023
Facility
37.4%Fiscal year ending 12/2023
IL AVG
44.3%
Rank
#122 / 166 | 145701 | ||||
| GreenFields of Geneva | NH AL IL MC SNF | Geneva | 77
Facility
77
IL AVG
85
Rank
#188 / 419 |
54.5%
Facility
54.5%
IL AVG
73
Rank
#139 / 157 | -25% | 4.58
Facility
4.58
IL AVG
3.10
Rank
#24 / 166 | +61% | +48% | $14.2k
Facility
$14.2k
IL AVG
$151.3k
Rank
#82 / 167 | 19
Facility
19
IL AVG
36.8
Rank
#38 / 167 | 4.8
Facility
4.8
IL AVG
3.7
Rank
#140 / 167 | 3 | 42 | A+ |
6
Facility
6
IL AVG
51
Rank
#610 / 648 | Brian Robbins | $20.4MFiscal year ending 03/2024
Facility
$20.4MFiscal year ending 03/2024
IL AVG
$12.2M
Rank
#26 / 166 | $8.9MFiscal year ending 03/2024
Facility
$8.9MFiscal year ending 03/2024
IL AVG
$4.8M
Rank
#45 / 166 | 43.5%Fiscal year ending 03/2024
Facility
43.5%Fiscal year ending 03/2024
IL AVG
44.3%
Rank
#142 / 166 | 146166 | ||||
| CENTRAL BAPTIST VILLAGE (Assisted Living) | NH AL MC SNF | Norridge (Norwood Park Township) | 97
Facility
97
IL AVG
85
Rank
#128 / 419 | - | - | 4.55
Facility
4.55
IL AVG
3.10
Rank
#32 / 166 | +8% | +47% | $0
Facility
$0
IL AVG
$151.3k
Rank
#1 / 167 | 19
Facility
19
IL AVG
36.8
Rank
#38 / 167 | 6.3
Facility
6.3
IL AVG
3.7
Rank
#162 / 167 | - | 102 | A+ |
87
Facility
87
IL AVG
51
Rank
#55 / 648 | Anna-Liisa Lacroix | $19.2MFiscal year ending 12/2023
Facility
$19.2MFiscal year ending 12/2023
IL AVG
$12.2M
Rank
#32 / 166 | $12.3MFiscal year ending 12/2023
Facility
$12.3MFiscal year ending 12/2023
IL AVG
$4.8M
Rank
#20 / 166 | 64%Fiscal year ending 12/2023
Facility
64%Fiscal year ending 12/2023
IL AVG
44.3%
Rank
#79 / 166 | 145853 |
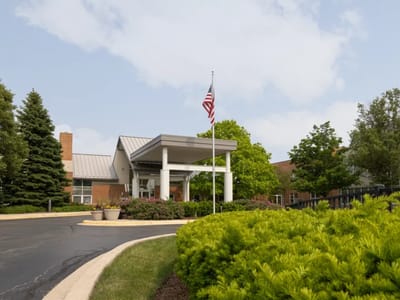
CENTRAL BAPTIST VILLAGE (Assisted Living) is in the Norwood Park Township neighborhood of Norridge.
CENTRAL BAPTIST VILLAGE (Assisted Living) is legally operated by Central Baptist Village.
CENTRAL BAPTIST VILLAGE (Assisted Living) has a walk score of 87. Very walkable. Most errands can be accomplished on foot, and many essentials are within a short walk.
According to IL state health department records, CENTRAL BAPTIST VILLAGE (Assisted Living)'s license number is 5100364.
According to IL state health department records, CENTRAL BAPTIST VILLAGE (Assisted Living)'s license expires on May 14, 2027.
CENTRAL BAPTIST VILLAGE (Assisted Living)'s occupancy is 100%.
No, CENTRAL BAPTIST VILLAGE (Assisted Living) has a no-pet policy.
Care Cost Calculator: See Prices in Your Area
Nursing Home Data Explorer
Don’t Wait Too Long: 7 Red Flag Signs Your Parent Needs Assisted Living Now
The True Cost of Assisted Living in 2025 – And How Families Are Paying For It
Understanding Senior Living Costs: Pricing Models, Discounts & Financial Assistance


