Nursing Home

Centre Avenue Health and Rehab Facility

Nursing Home

Centre Avenue Health and Rehab Facility

815 Centre Ave, Fort Collins, CO 80526 View map
Overview of Centre Avenue Health and Rehab Facility

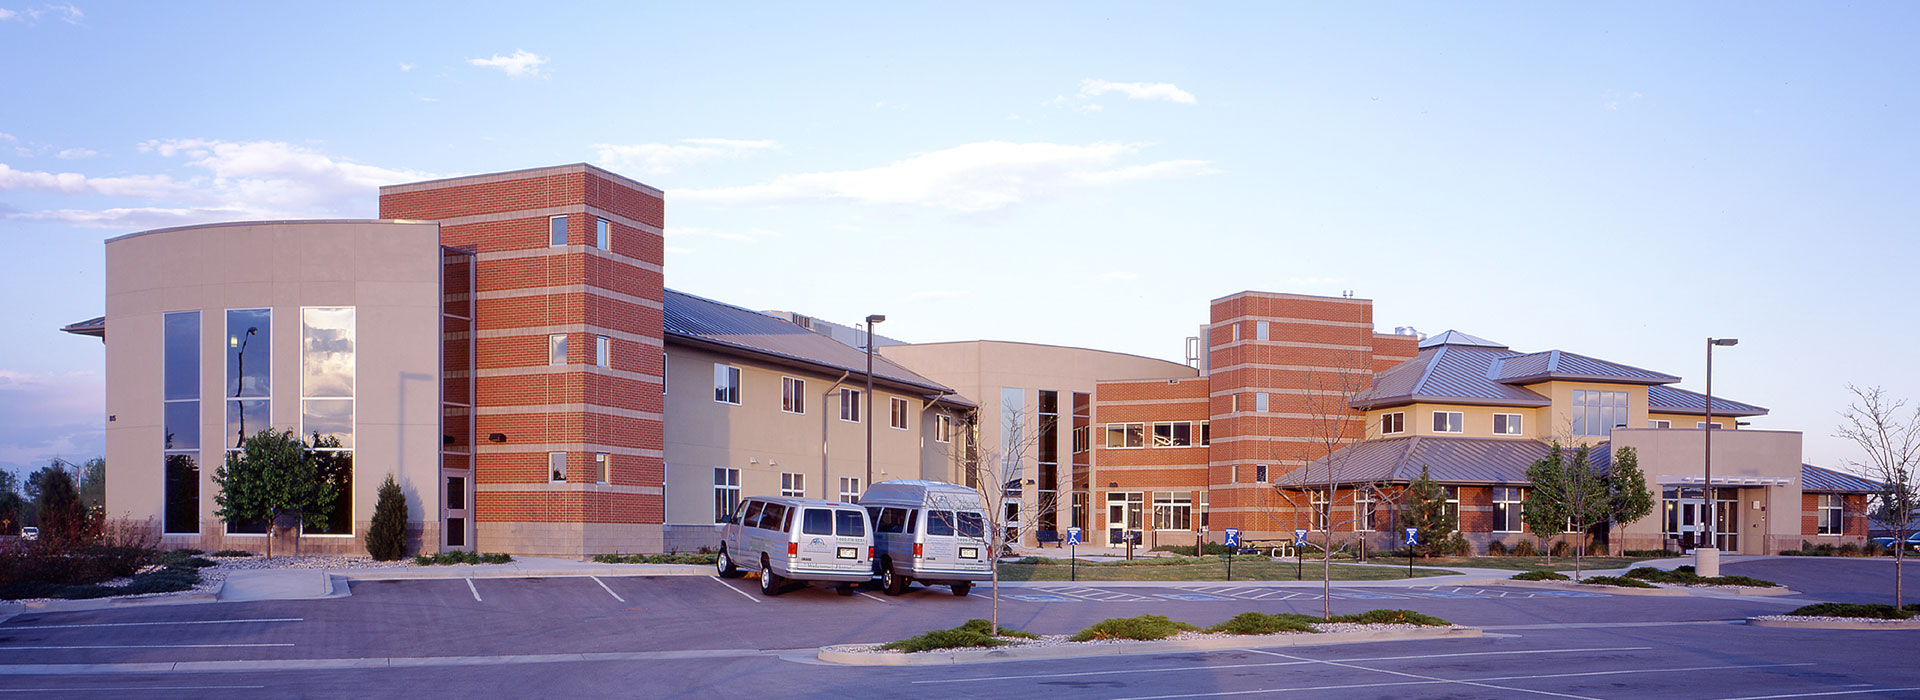
Centre Avenue Health and Rehab offer a warm and welcoming atmosphere that ensures a service delivered with compassion and respect. Focusing on skilled nursing, the retirement home creates a vibrant atmosphere for seniors to maintain their independence and individuality. Centre Avenue creates an environment of compassion and kindness for each senior.
As a member of the Columbine Cares for Seniors community, residential life is all about amenities: housekeeping, physical therapy, memory care, fully-equipped bedrooms with utilities included (piped-in oxygen, private sink, wardrobe), restaurant-style dining, short-term stays available, spiritual programs, specialized activities, educational and social engagements, pet therapy, and fitness classes offered.

(970) 484-0300

Quality ratings

Measured by Centers for Medicare & Medicaid Services (CMS)

Overall rating Info Official CMS rating based on health inspections, staffing and quality measures.
5/5
Colorado average: 3.2/5
Health Inspection Info Official CMS rating based on deficiencies found during state health inspections.
5/5
Colorado average: 2.8/5
Staffing Info Official CMS rating based on nurse staffing hours per resident per day.
4/5
Colorado average: 3.1/5
Quality Measures Info Official CMS rating based on clinical outcomes for residents.
5/5
Colorado average: 4.1/5

Nursing care per resident

Info Average daily nursing hours per resident (adjusted for acuity). Higher values indicate more nursing time per resident.
4h 20m per day

This home provides 12% more nursing time per resident than the Colorado average.

Colorado average: 3h 51m per day

Staffing hours breakdown

Info Hours of care per resident per day, broken down by staff type. Data from CMS Medicare.
Staff type Facility State avg National avg
Registered Nurse (RN) Info Registered nurse hours per resident per day. 1h 5m per day 36m per day 29m per day

Capacity and availability

Smaller home

May offer a more intimate, personalized care environment.

Total beds 90

This home usually has limited availability

Occupancy is moderate, suggesting balanced demand.

Similar demand to the Colorado average
Occupancy rate 88.9%
Residents per day (avg) 82
Occupancy rate
88.9%
Residents per day (avg)
82

Who this home usually serves

TYPE OF STAY

Mix of rehab and long-term care

This home supports both short-term rehab and long-term care, with residents staying for a wide range of durations.

Breakdown by payment type

Medicare

44% of new residents, usually for short-term rehab.

Typical stay 21 days

Private pay

51% of new residents, often for short stays.

Typical stay 1 - 2 months

Medicaid

5% of new residents, often for long-term daily care.

Typical stay 6 - 7 months

Finances and operations

Privately-owned community
Operated by a business corporation.
Home revenue
$16.8M
Operating loss
-$1.7M
Privately-owned community Operated by a business corporation.
Home revenue
$16,794,718.00
Operating loss
$-1,684,245.00
Payroll costs Info The portion of the home's budget spent on staff, including nurses, caregivers, and other employees who support care and operations.
$6.6M
39.5% of revenue
Other operating costs Info All remaining costs needed to run the home, such as food, utilities, building maintenance, supplies and administrative expenses.
$11.8M
Total costs $18.5M
Bed community size
90-bed community
A larger shared setting that may offer more common spaces and organized community services.
Walk Score
Walk Score: 73 / 100
Very walkable. Most errands can be accomplished on foot, and many essentials are within a short walk.
BBB Rating
BBB Rating: A+ (Not Accredited)
An independent rating from the Better Business Bureau based on factors such as complaint history, transparency, and business practices.
How BBB ratings work

About this community

License details

Status Active

Additional licensing details

CMS Certification Number: 65377

Ownership & operating entity

Centre Avenue Health and Rehab Facility is administrated by Dale, Clinton C..

Owner: CENTRE AVENUE HEALTH AND REHAB LLC

Care Services

Nursing Services
Rehabilitation Services
Respite Care
Memory Care
Independent Living
Skilled Nursing
Licensed Nurses/CNAs
24-Hour Staffing
Short-Term Rehab

All Levels of Care

Independent Living
Assisted Living
Memory Care

Programs & Activities

Specific Programs
Rehabilitation, Memory Care, Assisted Living, Home Care, Therapy Services, Family Support, Transportation Services
Contact Centre Avenue Health and Rehab Facility

Access & Eligibility

Ways to qualify for care at this community, including accepted programs and payment options.

Medicaid Accepted

This facility is certified for eligible Medicaid services.

Medicare Accepted

This facility is certified for eligible Medicare services.

Payment & Funding Options

Private pay Medicaid Medicare

Health Inspection History

Inspections
Total health inspections 2

Colorado average 4.8


Last Health inspection on Apr 2023

Total health citations 5
Citations per inspection
2.5

Health citations are formal notices following inspections when they fail to comply with safety and care standards.

All 5 citations resulted from standard inspections.

Breakdown of citation severity (last 3 years)
Critical Health citations More info 0
100% better than Colorado average

Colorado average: 0.4


Serious Health citations More info 2
5% better than Colorado average

Colorado average: 2.1

0 critical citations More info Colorado average: 0.4

2 serious citations More info Colorado average: 2.1

3 moderate citations More info Colorado average: 22.2

0 minor citations More info Colorado average: 0.2
Citations history (last 3 years)
Quality of Care moderate citation Apr 18, 2023
Corrected

Quality of Care serious citation Apr 18, 2023
Corrected

Resident Rights moderate citation Apr 18, 2023
Corrected

Quality of Care moderate citation Feb 09, 2022
Corrected

Compare Nursing Homes around Fort Collins

The information below is reported by the Colorado Department of Public Health and Environment, Health Facilities Division.
Centre Avenue Health and Rehab Facility
SNF

Nursing Home 24/7 care needed

AL

Assisted Living For seniors needing help with daily tasks but not full-time nursing.

Fort Collins
90
A+
73
-
88.9%
$16,759,746.00
$6,629,342.00
39.6%
81.50
5/5
4.3266
5/5
4/5
5/5
1
5
2
+12%
+12%
+16%
-
Lemy Avenue Health and Rehab Facility
SNF

Nursing Home 24/7 care needed

AL

Assisted Living For seniors needing help with daily tasks but not full-time nursing.

Fort Collins
130
A+
48
-
93.3%
$20,918,712.00
$8,259,461.00
39.5%
120.00
5/5
4.7150
4/5
5/5
4/5
1
7
1
-5%
+22%
+22%
-
Good Samaritan Society – Fort Collins Village
SNF

Nursing Home 24/7 care needed

AL

Assisted Living For seniors needing help with daily tasks but not full-time nursing.

Fort Collins
92
A+
16
BERMINGHAM, ROGER
62.4%
$8,529,930.00
$3,888,336.00
45.6%
55.70
4/5
3.9645
4/5
4/5
3/5
-
5
-
+50%
+3%
-18%
-
Columbine West Health and Rehab Facility
SNF

Nursing Home 24/7 care needed

AL

Assisted Living For seniors needing help with daily tasks but not full-time nursing.

Fort Collins (Prospect/Shields)
100
A+
72
-
89.4%
$12,585,186.00
$6,400,310.00
50.9%
88.60
2/5
5.2531
1/5
5/5
5/5
2
17
2
-29%
+36%
+17%
-
Creekside Village Health and Rehabilitation Center
AL

Assisted Living For seniors needing help with daily tasks but not full-time nursing.

SNF

Nursing Homes 24/7 care needed

Fort Collins (Prospect at Spring Meadows)
120
-
73
-
57.9%
$11,056,451.00
$2,212,155.00
20%
71.30
1/5
2.6251
1/5
1/5
4/5
4
40
6
+1%
-32%
-24%
Studio / Semi-Private Rooms

Places of interest near Centre Avenue Health and Rehab Facility

Address 2.1 miles from city center — 0.15 miles to nearest hospital (US Veterans Center/ VetCenter)

Address 815 Centre Ave, Fort Collins, CO 80526

Calculate Travel Distance to Centre Avenue Health and Rehab Facility

Add your location

Address

Staffing Data

Source: CMS Payroll-Based Journal (Q2 2025)

199
Total Staff
187
Employees
12
Contractors
42,132
Total Hours (Quarter)
59
Avg Staff/Day
7.8
Avg Shift (hrs)
Nursing Staff Breakdown
Role Count Avg Shift (hrs) Uses Contractors?
Registered Nurse309.5 No
Licensed Practical Nurse138.4 Yes
Certified Nursing Assistant688.3 Yes
Staff by Category
Administration
2 staff
8hs shift avg
Nursing Staff
113 staff
8.7hs shift avg
Physicians & Practitioners
5 staff
8.1hs shift avg
Therapy Services
53 staff
5.8hs shift avg
Activities & Recreation
1 staff
1.6hs shift avg
Social Services
9 staff
5.3hs shift avg
Dietary Services
9 staff
5.9hs shift avg
Other Services
7 staff
8hs shift avg
Contractor Analysis
0.7%
of total hours from contractors
303 contractor hours this quarter
Certified Nursing Assistant: 3 Licensed Practical Nurse: 7 Qualified Activities Professional: 1 Medical Director: 1
Role Employees Contractors Total Staff Total Hours Days Worked % of Days Avg Shift (hrs)
Certified Nursing Assistant6536816,77691100%8.3
Registered Nurse3003010,10391100%9.5
Licensed Practical Nurse67132,04491100%8.4
Mental Health Service Worker4041,9746470%8
Respiratory Therapy Technician140141,7049099%5.9
Clinical Nurse Specialist4041,6356470%8.1
Physical Therapy Assistant170171,2748593%5.5
Other Dietary Services Staff7071,12591100%5.6
Speech Language Pathologist110111,0457886%5.7
Dental Services Staff3039497582%8
Occupational Therapy Aide3038726470%7.3
Qualified Social Worker9097027582%5.3
Dietitian2026266673%6.5
Physical Therapy Aide7075147380%5.3
Administrator1014806066%8
Nurse Practitioner101801011%8
Medication Aide/Technician202731011%7.3
Occupational Therapy Assistant101702831%2.5
Qualified Activities Professional011633842%1.6
Medical Director0112433%8

Facility Characteristics

Source: CMS Long-Term Care Facility Characteristics (Data as of Jan 2026)

Total census
80 residents
Residents by payment source
Medicare
28 residents (35%)
Private pay or other
52 residents (65%)
Programs & Services
Residents' Group

Residents meet regularly to discuss policies, care quality, and activities

CCRC

Part of a Continuing Care Retirement Community offering multiple care levels

Active Resident Council

Organized group of residents that meets regularly to discuss facility policies, quality of life, and activities.

Quality of care over time

These measures show how residents usually do over time at this home, based on health outcomes and preventive care.

High-risk clinical events score Info A composite score based on pressure ulcers, falls with injury, weight loss, walking ability decline, and activities of daily living decline. 6.7
26% better than Colorado average

Colorado average: 9.0

Functional decline score Info A composite score based on activities of daily living decline, walking ability decline, and incontinence. 14.0
25% better than Colorado average

Colorado average: 18.8

Long-stay resident measures
Significantly above average Colorado avg: 3.8 Info CMS star rating based on long-stay quality measure performance. 5 stars = significantly above average, 1 star = significantly below average.
Need for Help with Daily Activities Increased Info Percent of long-stay residents whose need for help with daily activities has increased 8.6%
46% better than Colorado average

Colorado average: 16.0%

Walking Ability Worsened Info Percent of long-stay residents whose ability to move independently worsened 14.6%
14% better than Colorado average

Colorado average: 17.0%

Low Risk Residents with Bowel/Bladder Incontinence Info Percent of low risk long-stay residents who lose control of their bowels or bladder 18.8%
19% better than Colorado average

Colorado average: 23.2%

Falls with Major Injury Info Percent of long-stay residents experiencing one or more falls with major injury 1.0%
69% better than Colorado average

Colorado average: 3.3%

High Risk Residents with Pressure Ulcers Info Percent of long-stay high risk residents with pressure ulcers 4.1%
5% worse than Colorado average

Colorado average: 3.9%

Urinary Tract Infection Info Percent of long-stay residents with a urinary tract infection 4.2%
189% worse than Colorado average

Colorado average: 1.4%

Lost Too Much Weight Info Percent of long-stay residents who lose too much weight 4.9%
5% better than Colorado average

Colorado average: 5.2%

Depressive Symptoms Info Percent of long-stay residents who have depressive symptoms 1.6%
77% better than Colorado average

Colorado average: 7.2%

Antipsychotic Use Info Percent of long-stay residents who received an antipsychotic medication 9.3%
51% better than Colorado average

Colorado average: 18.8%

Pneumococcal Vaccine Info Percent of long-stay residents assessed and appropriately given the pneumococcal vaccine 100.0%
7% better than Colorado average

Colorado average: 93.3%

Influenza Vaccine Info Percent of long-stay residents assessed and appropriately given the seasonal influenza vaccine 100.0%
6% better than Colorado average

Colorado average: 94.7%

Hospitalizations per 1,000 days Info Number of hospitalizations per 1,000 long-stay resident days. 0.97
25% better than Colorado average

Colorado average: 1.30

ED visits per 1,000 days Info Number of outpatient emergency department visits per 1,000 long-stay resident days. 1.45
13% better than Colorado average

Colorado average: 1.67

Short-stay resident measures
Significantly above average Colorado avg: 2.9 Info CMS star rating based on short-stay quality measure performance. 5 stars = much above average, 1 star = much below average.
Pneumococcal Vaccine Info Percent of short-stay residents assessed and appropriately given the pneumococcal vaccine 97.5%
27% better than Colorado average

Colorado average: 76.6%

Antipsychotic medication increase Info Percent of short-stay residents who newly received an antipsychotic medication 0.4%
69% better than Colorado average

Colorado average: 1.4%

Influenza Vaccine Info Percent of short-stay residents assessed and appropriately given the seasonal influenza vaccine 95.3%
26% better than Colorado average

Colorado average: 75.6%

Re-hospitalized after SNF stay Info Percentage of short-stay residents who were re-hospitalized after their nursing home admission. 16.6%
18% better than Colorado average

Colorado average: 20.3%

Emergency department visits Info Percentage of short-stay residents who had an outpatient emergency department visit. 13.4%
5% worse than Colorado average

Colorado average: 12.8%

Falls with major injury Info Percentage of SNF residents who experience falls with major injury during their stay. 1.3%
71% worse than Colorado average

Colorado average: 0.8%

Ability to care for self at discharge Info Percentage of residents at or above expected ability to care for themselves at discharge. 59.7%
11% better than Colorado average

Colorado average: 53.7%

Successful return to home or community Info Rate of successful return to home or community from a skilled nursing facility. 71.9%
42% better than Colorado average

Colorado average: 50.6%

Penalties and fines

Federal penalties imposed by CMS for regulatory violations, including civil money penalties (fines) and denials of payment for new Medicare/Medicaid admissions.

Source: CMS Penalties Database (Data as of Jan 2026)

Total fines amount $8K
80% lower than Colorado average

Colorado average: $40K

Number of fines 1
55% fewer fines than Colorado average

Colorado average: 2.2

Payment Denials Info Serious action where Medicare and/or Medicaid temporarily stops payments for new residents until issues are fixed. 0
100% fewer payment denials than Colorado average

Colorado average: 0.3

Fines amount comparison
This facility $8K
Colorado average $40K
Penalty History

Penalties are imposed by CMS for violations of federal nursing home regulations.

Civil Money Penalty Info Fines imposed for noncompliance, which can be assessed per day or per instance of violation. Apr 18, 2023
$8K

Last updated: Jan 2026

Guides for Better Senior Living

Care Cost Calculator: See Prices in Your Area

Nursing Home Data Explorer

Don’t Wait Too Long: 7 Red Flag Signs Your Parent Needs Assisted Living Now

The True Cost of Assisted Living in 2025 – And How Families Are Paying For It

Understanding Senior Living Costs: Pricing Models, Discounts & Financial Assistance

Financial Aid for Colorado Seniors

Get financial aid guidance

Elderly, Blind, and Disabled Waiver

Colorado Medicaid EBD Waiver

Age 65+ or disabled, Colorado resident, Medicaid- eligible, nursing home-level care need.

~$2,829/month (300% FBR, individual).

$2,000 (individual), $3,000 (couple).

Requires level-of-care assessment by case manager.

Old Age Pension (OAP) Health Care Program

Colorado OAP

Age 60+, Colorado resident.

~$1,215/month (individual).

$2,000 (individual).

Supplements SSI; limited medical coverage.

Program of All-Inclusive Care for the Elderly (PACE)

Colorado Medicaid PACE

Age 55+, Colorado resident, nursing home-level care need, safe with PACE support.

~$2,829/month (300% FBR).

$2,000 (individual), $3,000 (couple).

Limited to specific regions (e.g., Denver, Pueblo).

Home Care Allowance (HCA)

Colorado Home Care Allowance (HCA)

Seniors typically 65+, Age 5+ with disability, Colorado resident, financial/functional need.

~$1,004/month (individual, stricter than waivers).

$2,000 (individual), $3,000 (couple).

Must need help with ADLs; not Medicaid-waiver eligible.

Senior Community Service Employment Program (SCSEP)

Colorado SCSEP (federally funded, state-administered)

Age 55+, unemployed, low-income, Colorado resident.

~$1,983/month (125% FPL, individual).

Not specified; income-focused.

Priority for veterans, rural residents.