Columbine West Health and Rehab Facility
Nursing Home · Fort Collins, CO
CMS overall rating Info The Overall CMS Rating is scored from 1 to 5 stars and combines results from health inspections, staffing levels, and quality measures. Health inspections carry the most weight. Staffing and quality scores can increase or decrease the final rating based on performance compared to state and national standards.

Columbine West Health and Rehab Facility

Nursing Home · Fort Collins, CO
CMS overall rating Info The Overall CMS Rating is scored from 1 to 5 stars and combines results from health inspections, staffing levels, and quality measures. Health inspections carry the most weight. Staffing and quality scores can increase or decrease the final rating based on performance compared to state and national standards.
Calculator: See prices in your area
Columbine West Health and Rehab Facility accepts Medicaid, Medicare, and private pay.

Overview of Columbine West Health and Rehab Facility

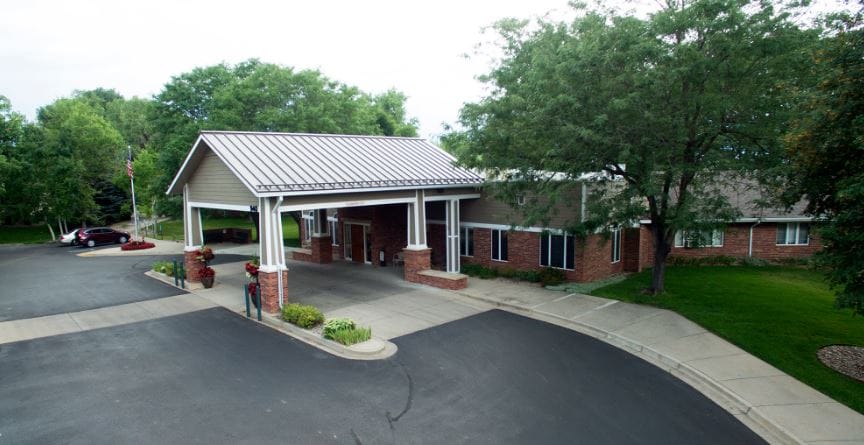
The Sister community of Lemy Avenue, Columbine West Health and Rehab Facility, offers a warm and welcoming atmosphere that ensures a service delivered with compassion and respect. Focusing on skilled nursing, the retirement home creates a vibrant atmosphere for seniors to maintain their independence and individuality. Columbine West creates an environment of compassion and kindness for each senior.
As a member of the Columbine Cares for Seniors community, residential life is all about amenities: housekeeping, physical therapy, memory care, fully-equipped bedrooms with utilities included (piped-in oxygen, private sink, wardrobe), restaurant-style dining, short-term stays available, spiritual programs, specialized activities, educational and social engagements, pet therapy, and fitness classes offered.

(970) 221-2273

Quality ratings

Measured by Centers for Medicare & Medicaid Services (CMS)

Overall rating Info The Overall CMS Rating combines results from health inspections, staffing levels and quality measures. Health inspections carry the most weight. Staffing and quality scores can increase or decrease the final rating based on performance compared to state and national standards.
▼ 36.9% Below CO avg. ▼ 36.9% Below CO avg.Click the badge to see the full State ranking.Click here to see the full State ranking.
Health Inspection Info Based on the results of the facility's three most recent standard inspections and any complaint investigations. CMS reviews the number, scope, and severity of deficiencies, with more recent findings weighted more heavily.
▼ 64.3% Below CO avg. ▼ 64.3% Below CO avg.Click the badge to see the full State ranking.Click here to see the full State ranking.
Staffing Info Measures average nursing staff hours per resident per day, including Registered Nurses (RNs) and total nursing staff. Ratings are adjusted based on the level of care residents require and are compared to state and national benchmarks.
▲ 59.2% Above CO avg. ▲ 59.2% Above CO avg.Click the badge to see the full State ranking.Click here to see the full State ranking.
Quality Measures Info Based on clinical and physical health indicators reported to CMS, such as hospital readmissions, falls, pressure ulcers, and improvements in mobility. These measures reflect how well residents' health needs are being managed.
▲ 21.4% Above CO avg. ▲ 21.4% Above CO avg.Click the badge to see the full State ranking.Click here to see the full State ranking.

Staffing hours breakdown

Info Daily nursing hours per resident by staff type, reported to CMS. Higher is generally better — compare this facility to state and national averages to see where staffing stands.

Hours per resident per day — compared to Colorado state averages

Total nursing care / resident Info This home is ranked 15th out of 177 homes in Colorado. Total adjusted nursing hours per resident per day, combining RN, LPN, and aide time. CMS adjusts this for case-mix so facilities can be fairly compared.
5h 15m per day
Rank #15 / 177Nurse hours — State benchmarkedThis home is ranked 15th out of 177 homes in Colorado. Shows adjusted nurse hours per resident per day benchmarked to the Colorado average, with a ranking across 177 Colorado SNFs. More hours mean more direct care. The national average is about 3.5 hrs; below 3.0 is a red flag.Click the rank badge to see the full State ranking.Click here to see the full State ranking.
This facility Colorado avg (3h 51m per day)
vs Colorado avg
+36%

1 of 6 metrics below state avg

Standout metric Weekend RN is +31% above state avg
Staff typeHours / Day / Residentvs state avg
Registered Nurse (RN) Info RNs hold the highest nursing license and can assess residents, interpret test results, and direct care plans. More RN hours per day often signals stronger clinical oversight and faster response to health changes. 1h 5m per day ▲ 30% State avg: 50m per day · National avg: 41m per day
LPN / LVN Info Licensed Practical Nurses (LPNs) or Licensed Vocational Nurses (LVNs) deliver routine hands-on care — medication administration, wound dressing, and monitoring vital signs. They work under RN supervision and make up a large share of daily bedside care. 29m per day ▼ 29% State avg: 41m per day · National avg: 52m per day
Nurse Aide Info Certified Nurse Aides (CNAs) provide the most direct day-to-day assistance: bathing, dressing, feeding, and mobility. Nurse aide hours are typically the largest staffing category and directly affect residents' quality of life. 2h 22m per day ▲ 7% State avg: 2h 13m per day · National avg: 2h 21m per day
Weekend Total Nursing Info Combined nursing hours (RN + LPN + Nurse Aide) per resident per day on weekends. Staffing often drops on weekends — this figure reveals whether the facility maintains adequate coverage outside of weekday hours. 3h 49m per day ▲ 16% State avg: 3h 17m per day · National avg: 3h 26m per day
Physical Therapist Info Hours per resident per day provided by licensed Physical Therapists (PTs) or PT Assistants. PT services help residents recover mobility after injury or illness and are especially important for post-acute (short-stay) rehabilitation. 6m per day ▲ 20% State avg: 5m per day · National avg: 4m per day
Weekend RN Info Registered nurse hours specifically on weekends. Facilities sometimes reduce RN presence on Saturdays and Sundays — a low weekend RN figure compared to weekday hours can indicate reduced clinical oversight when most administrative staff are absent. 47m per day ▲ 31% State avg: 36m per day · National avg: 29m per day

Capacity and availability

Avg. Length of Stay
87 days
Bed community size
100-bed community Rank #167 / 542Bed count — State benchmarkedThis home is ranked 167th out of 542 homes in Colorado. Shows this facility's certified or reported bed count compared to other Colorado SNFs. Larger communities may offer more amenities, programs, and on-site services for residents and families.Click the rank badge to see the full State ranking.Click here to see the full State ranking.
A larger shared setting that may offer more common spaces and organized community services.
Walk Score
Walk Score: 72 / 100 Rank #193 / 875Walk Score — State benchmarkedThis home is ranked 193rd out of 875 homes in Colorado. Shows how walkable this facility's neighborhood is compared to the average Walk Score across Colorado SNFs. Higher scores benefit residents, families, and staff.Click the rank badge to see the full State ranking.Click here to see the full State ranking.
Very walkable. Most errands can be accomplished on foot, and many essentials are within a short walk.
BBB Rating
BBB Rating: A+ (Not Accredited)
An independent rating from the Better Business Bureau based on factors such as complaint history, transparency, and business practices.
How BBB ratings work

About this community

Occupancy

Occupancy rate
14%
Rank #183 / 185Occupancy rate — State benchmarkedThis home is ranked 183rd out of 185 homes in Colorado. Shows this facility's occupancy rate versus the Colorado average, with its Statewide rank out of 185. Higher occupancy signals strong local demand and financial stability.Click the rank badge to see the full State ranking.Click here to see the full State ranking.
Lower than the Colorado average: 76.5%
Occupied beds
14 / 100
Average residents per home in Colorado 72 per day

License Details

StatusActive

Ownership & Operating Entity

Columbine West Health and Rehab Facility is administrated by Julie Ann Sleath.

OwnerCOLUMBINE WEST HEALTH AND REHAB LLC

Therapy & Rehabilitation

3 services
Rehabilitation Services
Respite Care
Short-Term Rehab

Staffing & Medical

1 service
24-Hour Staffing

Amenities & Lifestyle

Specific ProgramsHome Care, Therapy Services, Family Support, Infusion Services, Medical Equipment, Transportation

Contact Columbine West Health and Rehab Facility

Inspection History

In Colorado, the Department of Public Health and Environment, Health Facilities Division is the regulatory body that performs unannounced surveys and publishes facility inspection findings.

Since 2018 · 8 years of data 20 deficiencies

Inspection Scorecard Info This scorecard compares key inspection, citation, and complaint metrics at this facility against the Colorado state average. Metrics rated ≥15% worse than average are highlighted in red; those ≥15% better are highlighted in green.

Since 2018 vs. Colorado state average
Overall vs. CO average 0 Worse No metrics in this bucket. 2 Better Metrics better than Colorado average:
• Total deficiencies (33% below)
• Deficiencies per year (34% below)
Latest Inspection February 27, 2025 Complaint Investigation

Deficiencies Info Deficiencies are formal regulatory issues recorded during state inspections.

This FacilityCO Averagevs. CO Avg
Total deficiencies Info Formal regulatory issues recorded by inspectors across all inspection types. 2030 This facility has 33% fewer total deficiencies than a typical Colorado nursing home (20 vs. CO avg 30).↓ 33% better
Deficiencies per year Info Average deficiencies per year since 2018. 2.53.8 This facility has 34% fewer deficiencies per year than a typical Colorado nursing home (2.5 vs. CO avg 3.8).↓ 34% better

Inspection Reports Summary Info An editor-reviewed summary of the themes and findings across this facility's recent inspection reports.

This facility’s inspection record is problematic due to repeated failures in protecting residents from abuse, providing adequate dementia care, and maintaining quality assurance, culminating in an immediate jeopardy finding on February 27, 2025. Inspectors cited three deficiencies then, including failure to prevent resident-to-resident sexual abuse, inadequate staff education, and poor monitoring of interventions, alongside earlier findings of multiple care and safety issues in April 2024. The record shows worsening conditions with serious compliance gaps in abuse prevention, care planning, infection control, and environmental safety.

Read the full inspection reports for this facility, including detailed findings and corrective actions.

Show Inspection Reports

Health Inspection History

Inspections since 2018
Total health inspections 5

Colorado average 4.8


Last Health inspection on Feb 2025

Total health citations
17 Rank #56 / 182Health citations — State benchmarkedThis home is ranked 56th out of 182 homes in Colorado. Shows this facility's total health deficiency citations benchmarked to the Colorado State average, with a ranking across all 182 CO SNFs. Lower citation counts earn a better rank.Click the rank badge to see the full State ranking.Click here to see the full State ranking.

Colorado average 24.8

Citations per inspection
3.4 Rank #45 / 182Citations per inspection — State benchmarkedThis home is ranked 45th out of 182 homes in Colorado. Shows average deficiency citations per CMS inspection for this facility versus the Colorado mean across 182 SNFs with citation data. Lower is better.Click the rank badge to see the full State ranking.Click here to see the full State ranking.

Colorado average 5.2


Health citations are formal notices following inspections when they fail to comply with safety and care standards.

13 of 17 citations resulted from standard inspections; and 4 of 17 resulted from complaint investigations.

Breakdown of citation severity (last 8 years)
Critical Health citations
1
150% worse than Colorado average

Colorado average: 0.4


Serious Health citations
1 Rank #1 / 144Serious citations (G–I) — State benchmarkedThis home is ranked 1st out of 144 homes in Colorado. Shows G–I scope serious health citations for this facility versus other Colorado SNFs. Lower counts rank better.Click the rank badge to see the full State ranking.Click here to see the full State ranking.
52% better than Colorado average

Colorado average: 2.1

1 critical citation Colorado average: 0.4

1 serious citation Colorado average: 2.1

15 moderate citations Colorado average: 22.2

0 minor citations Colorado average: 0.2
Citations history (last 8 years)
Abuse/Neglect critical citation Feb 27, 2025
Corrected

Administration moderate citation Feb 27, 2025
Corrected

Quality of Care moderate citation Feb 27, 2025
Corrected

Resident Rights moderate citation Aug 06, 2024
Corrected

Staffing Data

Reporting period: October 1 – December 31, 2025 (Q4 2025). Source: CMS Payroll-Based Journal report.

Total staff 269
Employees 224
Contractors 45
Staff to resident ratio 2.99:1
57% better than Colorado average
Colorado average ratio: 1.91:1 Colorado average ratio: 1.91:1See full Colorado ranking
Avg staff/day 53
Average shift 7.8 hours
6% worse than Colorado average
Colorado average: 8.3 hours Colorado average shift: 8.3 hoursSee full Colorado ranking
Total staff hours (quarter) 38,204

Nursing staff breakdown

Q4 2025 · Oct 1 – Dec 31 More info This data comes from the CMS Payroll-Based Journal report covering October 1 – December 31, 2025.
Registered Nurse

Manages medical care and health needs.

RN Staff 33
Average shift length Info Average shift length. Calculated as total hours divided by days worked and average staff per day. 8.9 hours

This role is partially covered by contractors.

Licensed Practical Nurse

Assists with medical care and medications.

LPN Staff 19
Average shift length Info Average shift length. Calculated as total hours divided by days worked and average staff per day. 8.5 hours

This role is partially covered by contractors.

Certified Nursing Assistant

Helps with daily care and mobility.

CNA Staff 136
Average shift length Info Average shift length. Calculated as total hours divided by days worked and average staff per day. 7.7 hours

This role is partially covered by contractors.

Contractor staffing

Q4 2025 · Oct 1 – Dec 31 More info This data comes from the CMS Payroll-Based Journal report covering October 1 – December 31, 2025.

Total hours from contractors

1.8%

703 contractor hours this quarter

Certified Nursing Assistant: 30 Licensed Practical Nurse: 6 Registered Nurse: 3 Respiratory Therapy Technician: 2 Physical Therapy Assistant: 2 Speech Language Pathologist: 1 Qualified Social Worker: 1

Staff by category

Q4 2025 · Oct 1 – Dec 31 More info This data comes from the CMS Payroll-Based Journal report covering October 1 – December 31, 2025.
Certified Nursing Assistant1063013618,97092100%7.7
Registered Nurse303336,76992100%8.9
Licensed Practical Nurse136192,5059199%8.5
Clinical Nurse Specialist8081,3976874%8.5
Other Dietary Services Staff100101,0548087%6.8
Dental Services Staff6069987278%7.5
Mental Health Service Worker3038314347%7.2
RN Director of Nursing4046856470%7.8
Dietitian2026414246%8
Nurse Practitioner3036296672%8.3
Medication Aide/Technician3036194650%8.3
Occupational Therapy Aide2026164246%8
Respiratory Therapy Technician7296125560%6.5
Administrator3034905964%8.1
Physical Therapy Assistant7294686267%5.4
Nurse Aide in Training2022932224%7.5
Qualified Social Worker5162774549%5.9
Speech Language Pathologist7181985155%3.9
Physical Therapy Aide3031544043%3.8
136 Certified Nursing Assistant
% of Days 100%
33 Registered Nurse
% of Days 100%
19 Licensed Practical Nurse
% of Days 99%
8 Clinical Nurse Specialist
% of Days 74%
10 Other Dietary Services Staff
% of Days 87%
6 Dental Services Staff
% of Days 78%
3 Mental Health Service Worker
% of Days 47%
4 RN Director of Nursing
% of Days 70%
2 Dietitian
% of Days 46%
3 Nurse Practitioner
% of Days 72%
3 Medication Aide/Technician
% of Days 50%
2 Occupational Therapy Aide
% of Days 46%
9 Respiratory Therapy Technician
% of Days 60%
3 Administrator
% of Days 64%
9 Physical Therapy Assistant
% of Days 67%
2 Nurse Aide in Training
% of Days 24%
6 Qualified Social Worker
% of Days 49%
8 Speech Language Pathologist
% of Days 55%
3 Physical Therapy Aide
% of Days 43%

Penalties and fines

Includes penalties issued in 2024-2025

Federal penalties imposed by CMS for regulatory violations, including civil money penalties (fines) and denials of payment for new Medicare/Medicaid admissions.

Source: CMS Penalties Database (Data as of Jan 2026)

Total fines amount $27K Rank #124 / 182Federal fines — State benchmarkedThis home is ranked 124th out of 182 homes in Colorado. Shows this facility's cumulative CMS federal fine dollars versus the Colorado average among facilities with fines, and where it ranks among 182 skilled nursing facilities in the pool. Lower total dollars mean a better rank.Click the rank badge to see the full State ranking.Click here to see the full State ranking.
32% lower than Colorado average

Colorado average: $40K

Number of fines 2
10% fewer fines than Colorado average

Colorado average: 2.2

Payment Denials Info Serious action where Medicare and/or Medicaid temporarily stops payments for new residents until issues are fixed. 0
100% fewer payment denials than Colorado average

Colorado average: 0.3

Fines amount comparison
This facility $27K
Colorado average $40K
Penalty History

Penalties are imposed by CMS for violations of federal nursing home regulations.

2 penalties in the past 3 years

Multiple penalties were reported in the last 3 years.

Civil Money Penalty Info Fines imposed for noncompliance, which can be assessed per day or per instance of violation. Feb 27, 2025
$17K
Civil Money Penalty Info Fines imposed for noncompliance, which can be assessed per day or per instance of violation. Apr 11, 2024
$10K

Last updated: Jan 2026

Quality of care over time

These measures show how residents usually do over time at this home, based on health outcomes and preventive care.

High-risk clinical events score Info A composite score based on pressure ulcers, falls with injury, weight loss, walking ability decline, and activities of daily living decline. 8.3
8% better than Colorado average

Colorado average: 9.0

Functional decline score Info A composite score based on activities of daily living decline, walking ability decline, and incontinence. 20.3
8% worse than Colorado average

Colorado average: 18.8

Long-stay resident measures
Significantly above average Colorado avg: 3.9 Info CMS star rating based on long-stay quality measure performance. 5 stars = significantly above average, 1 star = significantly below average.
Need for Help with Daily Activities Increased Info Percent of long-stay residents whose need for help with daily activities has increased 13.6%
15% better than Colorado average

Colorado average: 16.0%

Walking Ability Worsened Info Percent of long-stay residents whose ability to move independently worsened 22.5%
32% worse than Colorado average

Colorado average: 17.0%

Low Risk Residents with Bowel/Bladder Incontinence Info Percent of low risk long-stay residents who lose control of their bowels or bladder 24.9%
7% worse than Colorado average

Colorado average: 23.2%

Falls with Major Injury Info Percent of long-stay residents experiencing one or more falls with major injury 0.0%
100% better than Colorado average

Colorado average: 3.3%

High Risk Residents with Pressure Ulcers Info Percent of long-stay high risk residents with pressure ulcers 0.7%
81% better than Colorado average

Colorado average: 3.9%

Urinary Tract Infection Info Percent of long-stay residents with a urinary tract infection 2.4%
67% worse than Colorado average

Colorado average: 1.4%

Lost Too Much Weight Info Percent of long-stay residents who lose too much weight 4.7%
11% better than Colorado average

Colorado average: 5.2%

Depressive Symptoms Info Percent of long-stay residents who have depressive symptoms 3.8%
48% better than Colorado average

Colorado average: 7.2%

Antipsychotic Use Info Percent of long-stay residents who received an antipsychotic medication 13.0%
31% better than Colorado average

Colorado average: 18.8%

Pneumococcal Vaccine Info Percent of long-stay residents assessed and appropriately given the pneumococcal vaccine 90.4%
In line with Colorado average

Colorado average: 93.3%

Influenza Vaccine Info Percent of long-stay residents assessed and appropriately given the seasonal influenza vaccine 98.9%
In line with Colorado average

Colorado average: 94.7%

Hospitalizations per 1,000 days Info Number of hospitalizations per 1,000 long-stay resident days. 1.68
29% worse than Colorado average

Colorado average: 1.30

ED visits per 1,000 days Info Number of outpatient emergency department visits per 1,000 long-stay resident days. 1.18
29% better than Colorado average

Colorado average: 1.67

Short-stay resident measures
Significantly above average Colorado avg: 2.7 Info CMS star rating based on short-stay quality measure performance. 5 stars = much above average, 1 star = much below average.
Pneumococcal Vaccine Info Percent of short-stay residents assessed and appropriately given the pneumococcal vaccine 81.8%
7% better than Colorado average

Colorado average: 76.6%

Antipsychotic medication increase Info Percent of short-stay residents who newly received an antipsychotic medication 1.3%
10% better than Colorado average

Colorado average: 1.4%

Influenza Vaccine Info Percent of short-stay residents assessed and appropriately given the seasonal influenza vaccine 80.3%
6% better than Colorado average

Colorado average: 75.6%

Re-hospitalized after SNF stay Info Percentage of short-stay residents who were re-hospitalized after their nursing home admission. 22.0%
8% worse than Colorado average

Colorado average: 20.3%

Emergency department visits Info Percentage of short-stay residents who had an outpatient emergency department visit. 4.3%
66% better than Colorado average

Colorado average: 12.8%

Falls with major injury Info Percentage of SNF residents who experience falls with major injury during their stay. 0.0%
100% better than Colorado average

Colorado average: 0.8%

Ability to care for self at discharge Info Percentage of residents at or above expected ability to care for themselves at discharge. 40.6%
24% worse than Colorado average

Colorado average: 53.7%

Successful return to home or community Info Rate of successful return to home or community from a skilled nursing facility. 59.2%
17% better than Colorado average

Colorado average: 50.6%

Breakdown by payment type

Medicare

23% of new residents, usually for short-term rehab.

Typical stay 16 days

Private pay

63% of new residents, often for short stays.

Typical stay 2 - 3 months

Medicaid

15% of new residents, often for long-term daily care.

Typical stay 9 - 10 months

Facility Characteristics

Source: CMS Long-Term Care Facility Characteristics (Data as of Jan 2026)

Total residents 90
Medicare
3
3.3% of residents
Medicaid
38
42.2% of residents
Private pay or other
49
54.4% of residents
Programs & Services
Residents Group

Residents meet regularly to discuss policies, care quality, and activities

Nurse Aide Training

State-approved Nurse Aide Training and Competency Evaluation Program on-site

CCRC

Part of a Continuing Care Retirement Community offering multiple care levels

Active Resident Council

Organized group of residents that meets regularly to discuss facility policies, quality of life, and activities.

Finances and operations

Privately-owned community
Operated by a business corporation.
Home revenue
$12.6M
Operating loss
-$655.8K
Privately-owned community Operated by a business corporation.
Home revenue
$12.6M Rank #76 / 182Revenue — State benchmarkedThis home is ranked 76th out of 182 homes in Colorado. Shows this facility's annual revenue compared to the Colorado SNF average. Higher revenue generally means more resources for staffing and capital — read alongside Payroll %.Click the rank badge to see the full State ranking.Click here to see the full State ranking.
Operating loss
-$655.8K
Payroll costs Info The portion of the home's budget spent on staff, including nurses, caregivers, and other employees who support care and operations. Rank #42 / 182Payroll — State benchmarkedThis home is ranked 42nd out of 182 homes in Colorado. Shows total annual staff payroll benchmarked to the Colorado average. Higher payroll investment relative to peers often signals better staffing and less reliance on cheaper contract labor.Click the rank badge to see the full State ranking.Click here to see the full State ranking.
$8.5M
67.5% of revenue Rank #16 / 182Payroll % — State benchmarkedThis home is ranked 16th out of 182 homes in Colorado. Shows payroll as a percentage of revenue versus the Colorado average. Well-run Colorado SNFs typically land around 59–66% — the top third Statewide. Below 25% may signal understaffing or heavy agency use — read with Staffing ratings.Click the rank badge to see the full State ranking.Click here to see the full State ranking.
Other operating costs Info All remaining costs needed to run the home, such as food, utilities, building maintenance, supplies and administrative expenses.
$4.8M
Total costs $13.3M

Who this home usually serves

TYPE OF STAY

Primarily short stays

Residents typically stay for brief periods, with frequent admissions and discharges throughout the year.

Places of interest near Columbine West Health and Rehab Facility

Address 2.0 miles from city center Info Estimated distance in miles from Fort Collins's city center to Columbine West Health and Rehab Facility's address, calculated via Google Maps. — 0.37 miles to nearest hospital (US Veterans Center/ VetCenter)

Calculate Travel Distance to Columbine West Health and Rehab Facility

Add your location

Address

Financial Assistance for
Nursing Home in Colorado

Columbine West Health and Rehab Facility is located in Fort Collins, Colorado.
Here are the financial assistance programs available to residents in Colorado.

Get Financial aid guidance

Elderly, Blind, and Disabled Waiver

Colorado Medicaid EBD Waiver

Age 65+ or disabled
General Colorado resident, Medicaid- eligible, nursing home-level care need.
Income Limits (2025) ~$2,829/month 300% FBR, individual
Asset Limits $2,000 (individual), $3,000 (couple).
CO

Requires level-of-care assessment by case manager.

Benefits
Personal care (5-7 hours/day) Respite care (up to 240 hours/year) Adult day care ($65/day) Home modifications ($1,500 avg.)

Old Age Pension (OAP) Health Care Program

Colorado OAP

Age 60+
General Colorado resident.
Income Limits ~$1,215/month individual
Asset Limits $2,000 individual
CO

Supplements SSI; limited medical coverage.

Benefits
Cash (~$100-$800/month) Limited in-home care (2-3 hours/week) Medical assistance

Program of All-Inclusive Care for the Elderly (PACE)

Colorado Medicaid PACE

Age 55+
General Colorado resident, nursing home-level care need, safe with PACE support.
Income Limits (2025) ~$2,829/month 300% FBR
Asset Limits $2,000 (individual), $3,000 (couple).
CO

Limited to specific regions (e.g., Denver, Pueblo).

Benefits
All-inclusive care—personal care (5-7 hours/day) Meals Transportation Therapy Medical visits

Home Care Allowance (HCA)

Colorado Home Care Allowance (HCA)

Age
General Seniors typically 65+, Age 5+ with disability, Colorado resident, financial/functional need.
Income Limits (2025) ~$1,004/month individual, stricter than waivers
Asset Limits $2,000 (individual), $3,000 (couple).
CO

Must need help with ADLs; not Medicaid-waiver eligible.

Benefits
Personal care (~4-6 hours/day, paid to provider) E.g. Bathing Dressing

Compare Nursing Home around Fort Collins

The information below is reported by the Colorado Department of Public Health and Environment, Health Facilities Division.

5 facilities compared · CMS & CO Dept. of Health data

Filter by care type
Centre Avenue Health and Rehab Facility
NH

Nursing Home Licensed facility providing 24/7 skilled nursing care for residents with complex, ongoing medical needs. Staffed by RNs, LPNs, and CNAs. Inspected and star-rated annually by CMS. Accepts Medicare (short-term rehab) and Medicaid (long-term care).

AL

Assisted Living A licensed, long-term care setting for seniors or individuals with disabilities who need help with daily activities — like bathing, dressing, and medication management — but not 24-hour skilled nursing. Offers housing, meals, and around-the-clock support while aiming to maximize resident independence.

Fort Collins (Centre Avenue)90 88.9% +16%4.33 +21%+12%$8.0k52.5282A+ 73 -$16.8M$10.2M60.6%65377
Lemy Avenue Health and Rehab Facility
NH

Nursing Home Licensed facility providing 24/7 skilled nursing care for residents with complex, ongoing medical needs. Staffed by RNs, LPNs, and CNAs. Inspected and star-rated annually by CMS. Accepts Medicare (short-term rehab) and Medicaid (long-term care).

AL

Assisted Living A licensed, long-term care setting for seniors or individuals with disabilities who need help with daily activities — like bathing, dressing, and medication management — but not 24-hour skilled nursing. Offers housing, meals, and around-the-clock support while aiming to maximize resident independence.

Fort Collins (South Lemay Avenue)130 93.3% +22%4.72 +1%+22%$7.4k71.41120A+ 48 -$21.0M$12.3M58.7%65142
Good Samaritan Society – Fort Collins Village
NH

Nursing Home Licensed facility providing 24/7 skilled nursing care for residents with complex, ongoing medical needs. Staffed by RNs, LPNs, and CNAs. Inspected and star-rated annually by CMS. Accepts Medicare (short-term rehab) and Medicaid (long-term care).

AL

Assisted Living A licensed, long-term care setting for seniors or individuals with disabilities who need help with daily activities — like bathing, dressing, and medication management — but not 24-hour skilled nursing. Offers housing, meals, and around-the-clock support while aiming to maximize resident independence.

Fort Collins (West Trilby Road)64 62.4% -18%3.96 +58%+3%$052.5-56A+ 16 Roger Bermingham$9.5M$5.4M56.9%65227
Columbine West Health and Rehab Facility
NH

Nursing Home Licensed facility providing 24/7 skilled nursing care for residents with complex, ongoing medical needs. Staffed by RNs, LPNs, and CNAs. Inspected and star-rated annually by CMS. Accepts Medicare (short-term rehab) and Medicaid (long-term care).

AL

Assisted Living A licensed, long-term care setting for seniors or individuals with disabilities who need help with daily activities — like bathing, dressing, and medication management — but not 24-hour skilled nursing. Offers housing, meals, and around-the-clock support while aiming to maximize resident independence.

Fort Collins (Prospect/Shields)100 89.4% +17%5.25 -9%+36%$26.9k173.4289A+ 72 -$12.6M$8.5M67.5%65245
Rehabilitation and Nursing Center of the Rockies
NH

Nursing Home Licensed facility providing 24/7 skilled nursing care for residents with complex, ongoing medical needs. Staffed by RNs, LPNs, and CNAs. Inspected and star-rated annually by CMS. Accepts Medicare (short-term rehab) and Medicaid (long-term care).

AL

Assisted Living A licensed, long-term care setting for seniors or individuals with disabilities who need help with daily activities — like bathing, dressing, and medication management — but not 24-hour skilled nursing. Offers housing, meals, and around-the-clock support while aiming to maximize resident independence.

Fort Collins106 67.3% -12%3.00 -64%-22%$0223.1289A+ 53 Todd Truax$15.8M$3.2M20%65192

Frequently Asked Questions about Columbine West Health and Rehab Facility

What neighborhood is Columbine West Health and Rehab Facility in?

Columbine West Health and Rehab Facility is in the Prospect/Shields neighborhood of Fort Collins.

Who is the owner of Columbine West Health and Rehab Facility?

The legal owner and operator of Columbine West Health and Rehab Facility is Columbine West Health And Rehab Llc.

Is Columbine West Health and Rehab Facility in a walkable area?

Columbine West Health and Rehab Facility has a walk score of 72. Very walkable. Most errands can be accomplished on foot, and many essentials are within a short walk.

What is the occupancy rate at Columbine West Health and Rehab Facility?

Columbine West Health and Rehab Facility's occupancy is 14%.

Who is the administrator of Columbine West Health and Rehab Facility?

Julie Ann Sleath is the administrator of Columbine West Health and Rehab Facility.

How many beds does Columbine West Health and Rehab Facility have?

Columbine West Health and Rehab Facility has 100 beds.

Are there photos of Columbine West Health and Rehab Facility?

Yes — there are 14 photos of Columbine West Health and Rehab Facility in the photo gallery on this page.

Guides for Better Senior Living

Care Cost Calculator: See Prices in Your Area

Nursing Home Data Explorer

Don’t Wait Too Long: 7 Red Flag Signs Your Parent Needs Assisted Living Now

The True Cost of Assisted Living in 2025 – And How Families Are Paying For It

Understanding Senior Living Costs: Pricing Models, Discounts & Financial Assistance

Explore Open Rooms
1 Contact details
2 What type of senior care service are you looking for?
3 What budget do you have in mind for senior care?
4 How soon do you need to find care?
5 Additional details

Thank you for your interest!

Our team will be in touch shortly to help with next steps.