Creekside Village Health and Rehabilitation Center
Nursing Home & Assisted Living · Fort Collins, CO
CMS overall rating Info The Overall CMS Rating is scored from 1 to 5 stars and combines results from health inspections, staffing levels, and quality measures. Health inspections carry the most weight. Staffing and quality scores can increase or decrease the final rating based on performance compared to state and national standards.

Creekside Village Health and Rehabilitation Center

Nursing Home & Assisted Living · Fort Collins, CO
CMS overall rating Info The Overall CMS Rating is scored from 1 to 5 stars and combines results from health inspections, staffing levels, and quality measures. Health inspections carry the most weight. Staffing and quality scores can increase or decrease the final rating based on performance compared to state and national standards.
Calculator: See prices in your area
Creekside Village Health and Rehabilitation Center accepts Medicare, Medicaid, and private pay.

Overview of Creekside Village Health and Rehabilitation Center

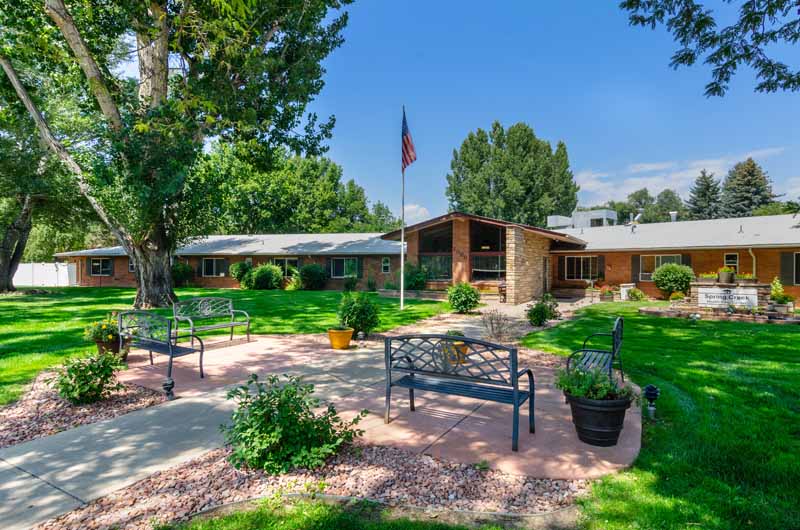
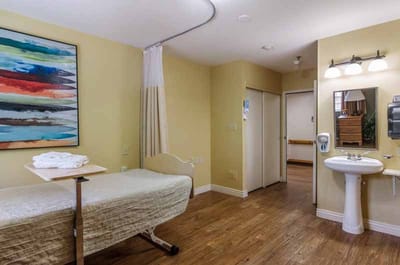
Live a blissful retirement at Creekside Village Health and Rehabilitation Center, an outstanding community in Fort Collins, CO, offering skilled nursing and rehabilitation. Residents receive top-notch care tailored to their unique needs from a compassionate and well-trained team available 24/7. Purposely built and secure accommodations are provided in a nurturing and welcoming environment, ensuring older adults feel at ease during their stay.

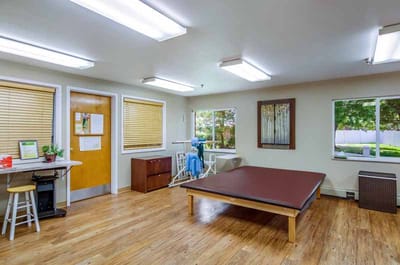
The community participates in Medicare and Medicaid to ease financial burdens. With therapy services, including physical, occupational, and speech therapy, the community strives to enhance residents’ living experiences. With exceptional care and extensive amenities, residents are guaranteed the finest retirement experience.

(970) 482-5712

Quality ratings

Measured by Centers for Medicare & Medicaid Services (CMS)

Overall rating Info The Overall CMS Rating combines results from health inspections, staffing levels and quality measures. Health inspections carry the most weight. Staffing and quality scores can increase or decrease the final rating based on performance compared to state and national standards.
▼ 68.2% Below CO avg.
Health Inspection Info Based on the results of the facility's three most recent standard inspections and any complaint investigations. CMS reviews the number, scope, and severity of deficiencies, with more recent findings weighted more heavily.
▼ 63.9% Below CO avg.
Staffing Info Measures average nursing staff hours per resident per day, including Registered Nurses (RNs) and total nursing staff. Ratings are adjusted based on the level of care residents require and are compared to state and national benchmarks.
▼ 67.1% Below CO avg.
Quality Measures Info Based on clinical and physical health indicators reported to CMS, such as hospital readmissions, falls, pressure ulcers, and improvements in mobility. These measures reflect how well residents' health needs are being managed.
▼ 3.6% Below CO avg.

Staffing hours breakdown

Info Daily nursing hours per resident by staff type, reported to CMS. Higher is generally better — compare this facility to state and national averages to see where staffing stands.

Hours per resident per day — compared to Colorado state averages

Total nursing care / resident Info This home is ranked 154th out of 161 homes in Colorado.

Total adjusted nursing hours per resident per day, combining RN, LPN, and aide time. CMS adjusts this for case-mix so facilities can be fairly compared.
2h 38m per day
Rank #154 / 161Nurse hours — state benchmarkedThis home is ranked 154th out of 161 homes in Colorado.Shows adjusted nurse hours per resident per day benchmarked to the Colorado average, with a ranking across 161 Colorado SNFs. More hours mean more direct care. The national average is about 3.5 hrs; below 3.0 is a red flag.
This facility Colorado avg (3h 52m per day)
vs Colorado avg
-32%

5 of 6 metrics below state avg

Standout metric RN (Weekend) is +6% above state avg
Staff typeHours / dayvs state avg
Registered Nurse (RN) Info RNs hold the highest nursing license and can assess residents, interpret test results, and direct care plans. More RN hours per day often signals stronger clinical oversight and faster response to health changes. 44m per day ▼ 12% State avg: 50m per day · National avg: 41m per day
LPN / LVN Info Licensed Practical Nurses (LPNs) or Licensed Vocational Nurses (LVNs) deliver routine hands-on care — medication administration, wound dressing, and monitoring vital signs. They work under RN supervision and make up a large share of daily bedside care. 17m per day ▼ 59% State avg: 41m per day · National avg: 52m per day
Nurse Aide Info Certified Nurse Aides (CNAs) provide the most direct day-to-day assistance: bathing, dressing, feeding, and mobility. Nurse aide hours are typically the largest staffing category and directly affect residents' quality of life. 2h 5m per day ▼ 6% State avg: 2h 13m per day · National avg: 2h 21m per day
Total Nursing (Weekend) Info Combined nursing hours (RN + LPN + Nurse Aide) per resident per day on weekends. Staffing often drops on weekends — this figure reveals whether the facility maintains adequate coverage outside of weekday hours. 2h 22m per day ▼ 28% State avg: 3h 17m per day · National avg: 3h 26m per day
Physical Therapist Info Hours per resident per day provided by licensed Physical Therapists (PTs) or PT Assistants. PT services help residents recover mobility after injury or illness and are especially important for post-acute (short-stay) rehabilitation. 3m per day ▼ 40% State avg: 5m per day · National avg: 4m per day
RN (Weekend) Info Registered nurse hours specifically on weekends. Facilities sometimes reduce RN presence on Saturdays and Sundays — a low weekend RN figure compared to weekday hours can indicate reduced clinical oversight when most administrative staff are absent. 38m per day ▲ 6% State avg: 36m per day · National avg: 29m per day

Capacity and availability

This home usually has availability

Occupancy lower than 85% suggests more openings may be available.

Lower occupancy than the Colorado average: 76.5%
Occupancy rate 57.9% Rank #131 / 165Occupancy rate — state benchmarkedThis home is ranked 131st out of 165 homes in Colorado.Shows this facility's occupancy rate versus the Colorado average, with its statewide rank out of 165. Higher occupancy signals strong local demand and financial stability.
Avg. Length of Stay 390 days
Occupancy rate
57.9% Rank #131 / 165Occupancy rate — state benchmarkedThis home is ranked 131st out of 165 homes in Colorado.Shows this facility's occupancy rate versus the Colorado average, with its statewide rank out of 165. Higher occupancy signals strong local demand and financial stability.
Avg. Length of Stay
390 days

Who this home usually serves

TYPE OF STAY

Mostly long-term care residents

Most residents stay for extended periods and receive ongoing daily care.

Breakdown by payment type

Medicare

21% of new residents, usually for short-term rehab.

Typical stay 2 - 3 months

Private pay

45% of new residents, often for short stays.

Typical stay 1 - 2 months

Medicaid

34% of new residents, often for long-term daily care.

Typical stay 5 years

Finances and operations

Privately-owned community
Operated by a business corporation.
Home revenue
$11.2M
Operating loss
-$3.8M
Privately-owned community Operated by a business corporation.
Home revenue
$11.2M Rank #87 / 165Revenue — state benchmarkedThis home is ranked 87th out of 165 homes in Colorado.Shows this facility's annual revenue compared to the Colorado SNF average. Higher revenue generally means more resources for staffing and capital — read alongside Payroll %.
Operating loss
-$3.8M
Payroll costs Info The portion of the home's budget spent on staff, including nurses, caregivers, and other employees who support care and operations. Rank #151 / 165Payroll — state benchmarkedThis home is ranked 151st out of 165 homes in Colorado.Shows total annual staff payroll benchmarked to the Colorado average. Higher payroll investment relative to peers often signals better staffing and less reliance on cheaper contract labor.
$7.8M
70.2% of revenue Rank #165 / 165Payroll % — state benchmarkedThis home is ranked 165th out of 165 homes in Colorado.Shows payroll as a percentage of revenue versus the Colorado average. Well-run SNFs often land around 55–65%. Below 25% may signal understaffing or heavy agency use — read with Staffing ratings.
Other operating costs Info All remaining costs needed to run the home, such as food, utilities, building maintenance, supplies and administrative expenses.
$7.1M
Total costs $14.9M
Walk Score
Walk Score: 73 / 100 Rank #12 / 74Walk Score — state benchmarkedThis home is ranked 12th out of 74 homes in Colorado.Shows how walkable this facility's neighborhood is compared to the average Walk Score across Colorado SNFs. Higher scores benefit residents, families, and staff.
Very walkable. Most errands can be accomplished on foot, and many essentials are within a short walk.

What does this home offer?

Housing options icon

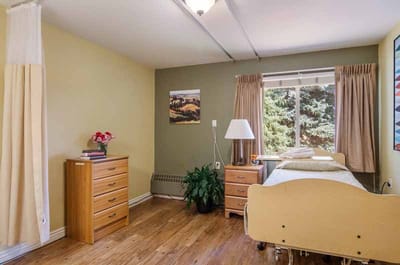
Housing Options: Studio / Semi-Private Rooms

Building type icon
Building type icon

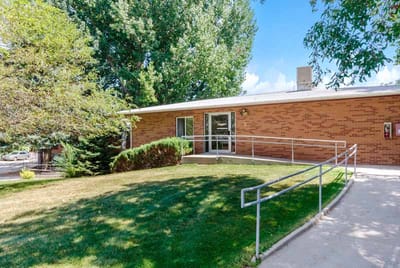
Building Type: Single-story

Dining services icon

Dining Services

Social and recreational activities icon

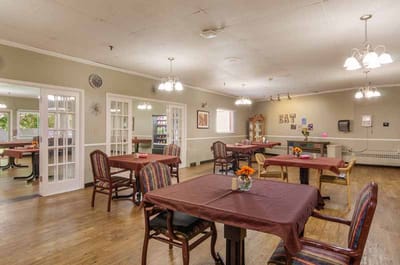
Social and Recreational Activities

On-site medical care and health services icon

On-site Medical Care and Health Services

Types of Care at Creekside Village Health and Rehabilitation Center

Nursing Home Assisted Living

Contact Creekside Village Health and Rehabilitation Center

Health Inspection History

Inspections
Total health inspections 12

Colorado average 4.8


Last Health inspection on Sep 2025

Total health citations
40 Rank #140 / 165Health citations — state benchmarkedThis home is ranked 140th out of 165 homes in Colorado.Shows this facility's total health deficiency citations benchmarked to the Colorado state average, with a ranking across all 165 CO SNFs. Lower citation counts earn a better rank.

Colorado average 24.8

Citations per inspection
3.33 Rank #37 / 165Citations per inspection — state benchmarkedThis home is ranked 37th out of 165 homes in Colorado.Shows average deficiency citations per CMS inspection for this facility versus the Colorado mean across 165 SNFs with citation data. Lower is better.

Colorado average 5.2


Health citations are formal notices following inspections when they fail to comply with safety and care standards.

24 of 40 citations resulted from standard inspections; 15 of 40 resulted from complaint investigations; and 1 of 40 came from combined inspections (standard and complaint).

Breakdown of citation severity (last 8 years)
Critical Health citations More info
0
100% better than Colorado average

Colorado average: 0.4


Serious Health citations More info 6
186% worse than Colorado average

Colorado average: 2.1

0 critical citations More info Colorado average: 0.4

6 serious citations More info Colorado average: 2.1

34 moderate citations More info Colorado average: 22.2

0 minor citations More info Colorado average: 0.2
Citations history (last 8 years)
Abuse/Neglect moderate citation Info Issues related to protecting resident's from harm, including abuse, neglect, or mistreatment. Sep 04, 2025
Corrected

Nutrition moderate citation Info Issues related to food quality, meal service, and resident's nutritional needs. Sep 04, 2025
Corrected

Abuse/Neglect moderate citation Info Issues related to protecting resident's from harm, including abuse, neglect, or mistreatment. Jul 08, 2025
Corrected

Pharmacy serious citation Info Issues related to medication management, including how drugs are stored, administered, and monitored. Jul 08, 2025
Corrected

Financial Assistance for
Nursing Home in Colorado

Creekside Village Health and Rehabilitation Center is located in Fort Collins, Colorado.
Here are the financial assistance programs available to residents in Colorado.

Get Financial aid guidance

Elderly, Blind, and Disabled Waiver

Colorado Medicaid EBD Waiver

Age 65+ or disabled
General Colorado resident, Medicaid- eligible, nursing home-level care need.
Income Limits (2025) ~$2,829/month 300% FBR, individual
Asset Limits $2,000 (individual), $3,000 (couple).
CO

Requires level-of-care assessment by case manager.

Benefits
Personal care (5-7 hours/day) Respite care (up to 240 hours/year) Adult day care ($65/day) Home modifications ($1,500 avg.)

Old Age Pension (OAP) Health Care Program

Colorado OAP

Age 60+
General Colorado resident.
Income Limits ~$1,215/month individual
Asset Limits $2,000 individual
CO

Supplements SSI; limited medical coverage.

Benefits
Cash (~$100-$800/month) Limited in-home care (2-3 hours/week) Medical assistance

Program of All-Inclusive Care for the Elderly (PACE)

Colorado Medicaid PACE

Age 55+
General Colorado resident, nursing home-level care need, safe with PACE support.
Income Limits (2025) ~$2,829/month 300% FBR
Asset Limits $2,000 (individual), $3,000 (couple).
CO

Limited to specific regions (e.g., Denver, Pueblo).

Benefits
All-inclusive care—personal care (5-7 hours/day) Meals Transportation Therapy Medical visits

Home Care Allowance (HCA)

Colorado Home Care Allowance (HCA)

Age
General Seniors typically 65+, Age 5+ with disability, Colorado resident, financial/functional need.
Income Limits (2025) ~$1,004/month individual, stricter than waivers
Asset Limits $2,000 (individual), $3,000 (couple).
CO

Must need help with ADLs; not Medicaid-waiver eligible.

Benefits
Personal care (~4-6 hours/day, paid to provider) E.g. Bathing Dressing

Places of interest near Creekside Village Health and Rehabilitation Center

Address 2.8 miles from city center Info Estimated distance in miles from Fort Collins's city center to Creekside Village Health and Rehabilitation Center's address, calculated via Google Maps.

Calculate Travel Distance to Creekside Village Health and Rehabilitation Center

Add your location

Address

Staffing Data (Q2 2025)

This data corresponds to Q2 2025 and is based on CMS Payroll-Based Journal.

Total staff 95
Employees 79
Contractors 16
Staff to resident ratio 1.64:1
14% worse than Colorado average

Colorado average ratio: 1.91:1

Avg staff/day 27
Average shift 8.9 hours
7% better than Colorado average

Colorado average: 8.3 hours

Total staff hours (quarter) 21,884

Nursing staff breakdown

Registered Nurse

Manages medical care and health needs.

Total count 13
Average shift length Info Average shift length. Calculated as total hours divided by days worked and average staff per day. 9.8 hours

No contractors work on this role.

Licensed Practical Nurse

Assists with medical care and medications.

Total count 3
Average shift length Info Average shift length. Calculated as total hours divided by days worked and average staff per day. 13 hours

No contractors work on this role.

Certified Nursing Assistant

Helps with daily care and mobility.

Total count 53
Average shift length Info Average shift length. Calculated as total hours divided by days worked and average staff per day. 9.2 hours

No contractors work on this role.

Contractor staffing

Total hours from contractors

10.3%

2,249 contractor hours this quarter

Physical Therapy Assistant: 3 Mental Health Service Worker: 3 Respiratory Therapy Technician: 3 Speech Language Pathologist: 2 Qualified Social Worker: 1 Occupational Therapy Aide: 1 Dietitian: 1 Occupational Therapy Assistant: 1 Medical Director: 1

Staff by category

Certified Nursing Assistant530539,45491100%9.2
Registered Nurse130134,87391100%9.8
Administrator3031,1376875%7.7
Other Dietary Services Staff2029628998%8.2
Physical Therapy Assistant0338557279%9.1
Medication Aide/Technician1017466571%11.5
Licensed Practical Nurse3037014853%13
Nurse Practitioner1015207077%7.4
Qualified Social Worker0115116673%7.7
Mental Health Service Worker1344585560%7.8
Nurse Aide in Training1014084145%10
RN Director of Nursing1013955662%7.1
Respiratory Therapy Technician0333875156%7.3
Speech Language Pathologist0223526167%5.8
Occupational Therapy Aide0111102426%4.6
Dietitian011922%4.5
Medical Director011411%4
Occupational Therapy Assistant011333%1
53 Certified Nursing Assistant
% of Days 100%
13 Registered Nurse
% of Days 100%
3 Administrator
% of Days 75%
2 Other Dietary Services Staff
% of Days 98%
3 Physical Therapy Assistant
% of Days 79%
1 Medication Aide/Technician
% of Days 71%
3 Licensed Practical Nurse
% of Days 53%
1 Nurse Practitioner
% of Days 77%
1 Qualified Social Worker
% of Days 73%
4 Mental Health Service Worker
% of Days 60%
1 Nurse Aide in Training
% of Days 45%
1 RN Director of Nursing
% of Days 62%
3 Respiratory Therapy Technician
% of Days 56%
2 Speech Language Pathologist
% of Days 67%
1 Occupational Therapy Aide
% of Days 26%
1 Dietitian
% of Days 2%
1 Medical Director
% of Days 1%
1 Occupational Therapy Assistant
% of Days 3%

Facility Characteristics

Source: CMS Long-Term Care Facility Characteristics (Data as of Jan 2026)

Total residents 58
Medicare
1
1.7% of residents
Medicaid
55
94.8% of residents
Private pay or other
2
3.4% of residents
Programs & Services
Residents Group

Residents meet regularly to discuss policies, care quality, and activities

Active Resident Council

Organized group of residents that meets regularly to discuss facility policies, quality of life, and activities.

Quality of care over time

These measures show how residents usually do over time at this home, based on health outcomes and preventive care.

High-risk clinical events score Info A composite score based on pressure ulcers, falls with injury, weight loss, walking ability decline, and activities of daily living decline. 7.2
20% better than Colorado average

Colorado average: 9.0

Functional decline score Info A composite score based on activities of daily living decline, walking ability decline, and incontinence. 13.7
27% better than Colorado average

Colorado average: 18.8

Long-stay resident measures
Above average Colorado avg: 3.9 Info CMS star rating based on long-stay quality measure performance. 5 stars = significantly above average, 1 star = significantly below average.
Need for Help with Daily Activities Increased Info Percent of long-stay residents whose need for help with daily activities has increased 11.2%
30% better than Colorado average

Colorado average: 16.0%

Walking Ability Worsened Info Percent of long-stay residents whose ability to move independently worsened 14.8%
13% better than Colorado average

Colorado average: 17.0%

Low Risk Residents with Bowel/Bladder Incontinence Info Percent of low risk long-stay residents who lose control of their bowels or bladder 15.1%
35% better than Colorado average

Colorado average: 23.2%

Falls with Major Injury Info Percent of long-stay residents experiencing one or more falls with major injury 2.5%
26% better than Colorado average

Colorado average: 3.3%

High Risk Residents with Pressure Ulcers Info Percent of long-stay high risk residents with pressure ulcers 2.7%
31% better than Colorado average

Colorado average: 3.9%

Urinary Tract Infection Info Percent of long-stay residents with a urinary tract infection 0.0%
100% better than Colorado average

Colorado average: 1.4%

Lost Too Much Weight Info Percent of long-stay residents who lose too much weight 5.0%
In line with Colorado average

Colorado average: 5.2%

Depressive Symptoms Info Percent of long-stay residents who have depressive symptoms 22.8%
217% worse than Colorado average

Colorado average: 7.2%

Antipsychotic Use Info Percent of long-stay residents who received an antipsychotic medication 23.6%
26% worse than Colorado average

Colorado average: 18.8%

Pneumococcal Vaccine Info Percent of long-stay residents assessed and appropriately given the pneumococcal vaccine 92.2%
In line with Colorado average

Colorado average: 93.3%

Influenza Vaccine Info Percent of long-stay residents assessed and appropriately given the seasonal influenza vaccine 97.1%
In line with Colorado average

Colorado average: 94.7%

Hospitalizations per 1,000 days Info Number of hospitalizations per 1,000 long-stay resident days. 2.21
70% worse than Colorado average

Colorado average: 1.30

ED visits per 1,000 days Info Number of outpatient emergency department visits per 1,000 long-stay resident days. 3.01
80% worse than Colorado average

Colorado average: 1.67

Short-stay resident measures
Pneumococcal Vaccine Info Percent of short-stay residents assessed and appropriately given the pneumococcal vaccine 70.2%
8% worse than Colorado average

Colorado average: 76.6%

Antipsychotic medication increase Info Percent of short-stay residents who newly received an antipsychotic medication 6.3%
344% worse than Colorado average

Colorado average: 1.4%

Influenza Vaccine Info Percent of short-stay residents assessed and appropriately given the seasonal influenza vaccine 59.4%
21% worse than Colorado average

Colorado average: 75.6%

Penalties and fines

Federal penalties imposed by CMS for regulatory violations, including civil money penalties (fines) and denials of payment for new Medicare/Medicaid admissions.

Source: CMS Penalties Database (Data as of Jan 2026)

Total fines amount $61K
54% higher than Colorado average

Colorado average: $40K

Number of fines 5
125% more fines than Colorado average

Colorado average: 2.2

Payment Denials Info Serious action where Medicare and/or Medicaid temporarily stops payments for new residents until issues are fixed. 0
100% fewer payment denials than Colorado average

Colorado average: 0.3

Fines amount comparison
This facility $61K
Colorado average $40K
Penalty History

Penalties are imposed by CMS for violations of federal nursing home regulations.

4 penalties in the past 3 years

Multiple penalties were reported in the last 3 years.

Civil Money Penalty Info Fines imposed for noncompliance, which can be assessed per day or per instance of violation. Jul 8, 2025
$14K
Civil Money Penalty Info Fines imposed for noncompliance, which can be assessed per day or per instance of violation. Dec 19, 2023
$8K
Civil Money Penalty Info Fines imposed for noncompliance, which can be assessed per day or per instance of violation. Nov 6, 2023
$3K
Civil Money Penalty Info Fines imposed for noncompliance, which can be assessed per day or per instance of violation. Oct 17, 2023
$7K

Last updated: Jan 2026

Guides for Better Senior Living

Care Cost Calculator: See Prices in Your Area

Nursing Home Data Explorer

Don’t Wait Too Long: 7 Red Flag Signs Your Parent Needs Assisted Living Now

The True Cost of Assisted Living in 2025 – And How Families Are Paying For It

Understanding Senior Living Costs: Pricing Models, Discounts & Financial Assistance

Frequently Asked Questions about Creekside Village Health and Rehabilitation Center

What neighborhood is Creekside Village Health and Rehabilitation Center in?

Creekside Village Health and Rehabilitation Center is in the Prospect at Spring Meadows neighborhood.

Is Creekside Village Health and Rehabilitation Center in a walkable area?

Creekside Village Health and Rehabilitation Center has a walk score of 73. Very walkable. Most errands can be accomplished on foot, and many essentials are within a short walk.

What is the address of Creekside Village Health and Rehabilitation Center?

Creekside Village Health and Rehabilitation Center is located at 1000 E. Stuart St, Fort Collins, CO 80525.

What is the phone number of Creekside Village Health and Rehabilitation Center?

(970) 482-5712 will put you in contact with the team at Creekside Village Health and Rehabilitation Center.

Is Creekside Village Health and Rehabilitation Center Medicare or Medicaid certified?

Yes — Creekside Village Health and Rehabilitation Center is a CMS-certified provider of Medicare and Medicaid.

Explore Open Rooms
1 Contact details
2 What type of senior care service are you looking for?
3 What budget do you have in mind for senior care?
4 How soon do you need to find care?
5 Additional details

Thank you for your interest!

Our team will be in touch shortly to help with next steps.