Total health inspections
9
Arizona average 6.3
Last Health inspection on Nov 2025

We arrange tours, appointments, and even moving support so you don’t have to
Thank you for your interest!
Our team will be in touch shortly to help with next steps.
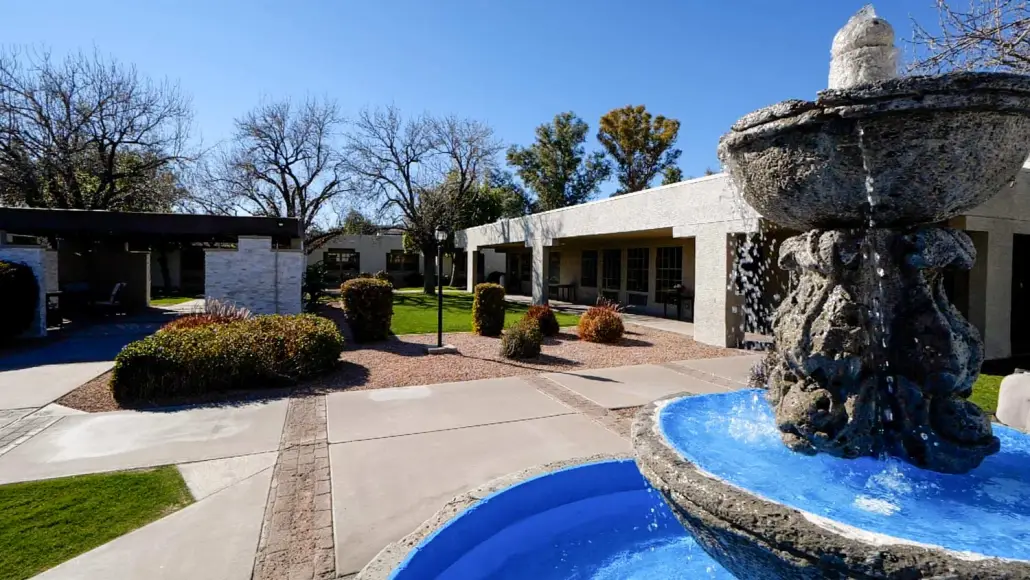
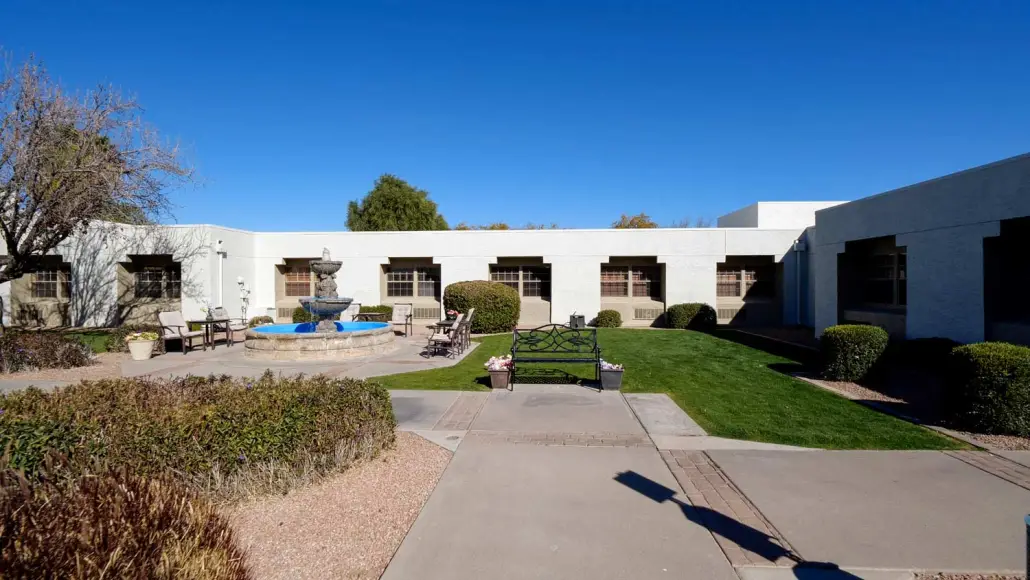
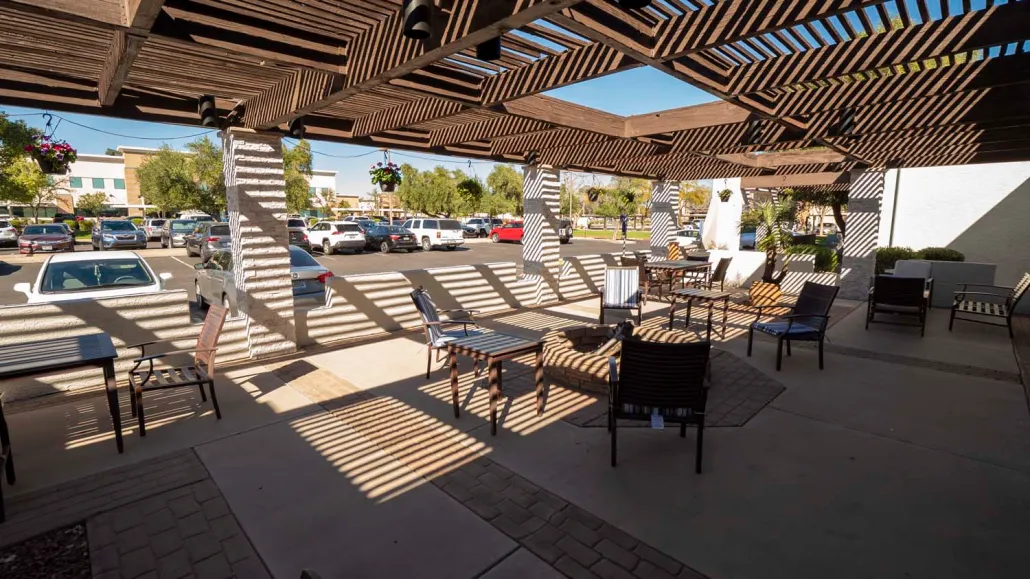
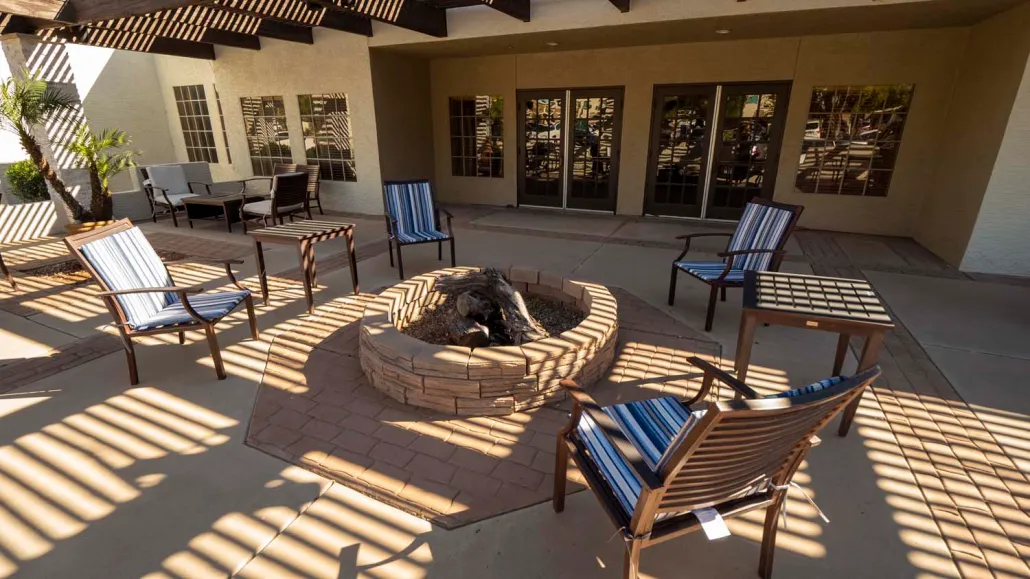
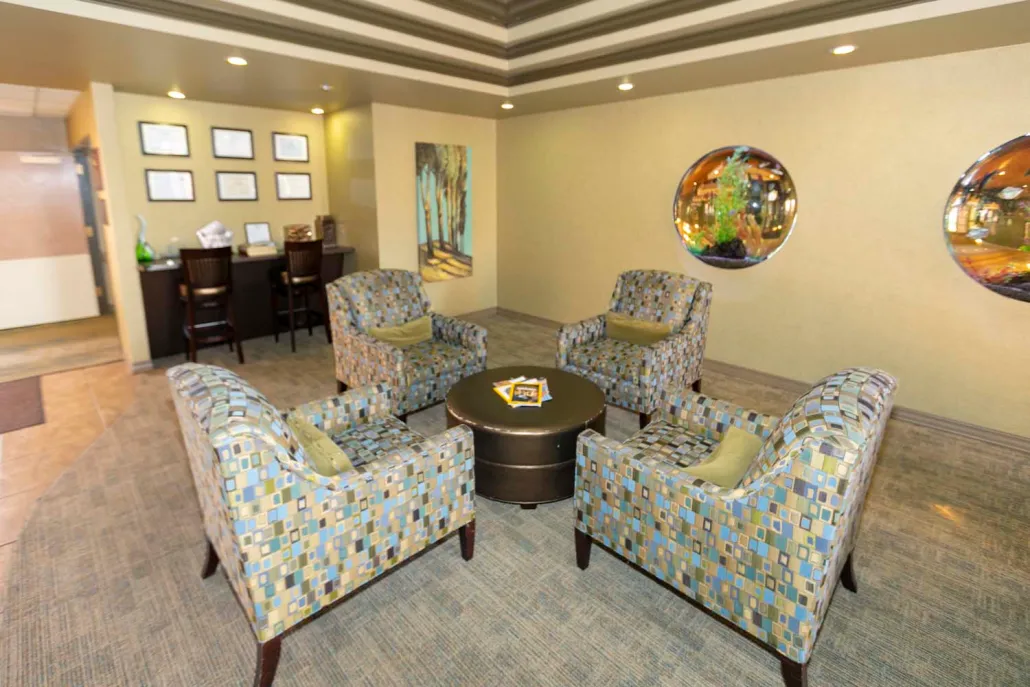
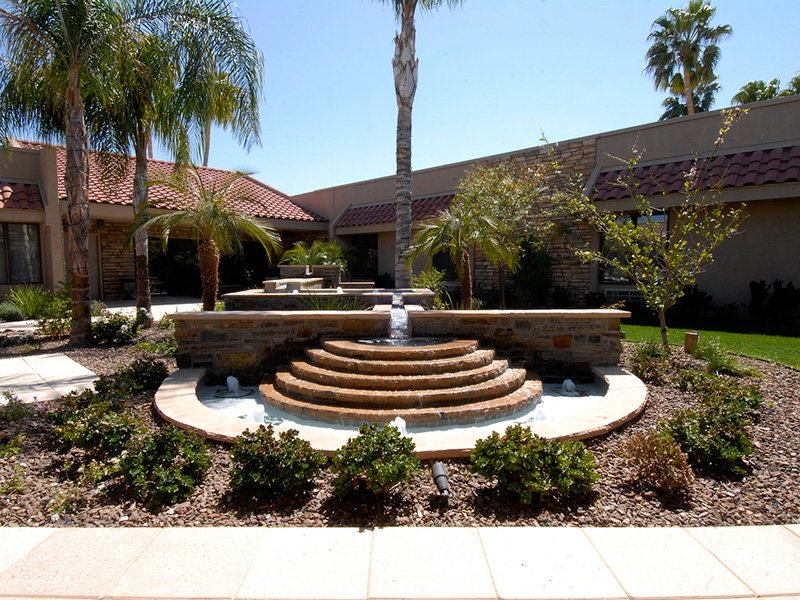
In Chandler Post Acute and Rehabilitation center, residents thrive; they provide quality caregiving for skilled nursing and rehabilitation. It offers a warm and welcoming atmosphere where residents and staff are encouraged to create friendships and build a mutual level of trust with each other. Families can rest easy knowing their loved ones are in good hands because of the dedicated team of professionals. Chandler Post Acute and Rehab are ideal for seniors looking for a homelike setting in a nurturing environment.
Chandler aims to enhance the quality of life for its residents by ensuring that seniors can satisfy their holistic wellness. They house state-of-the-art technologies that help recover a range of medical conditions– wound care, neurological recovery, lymphedema, and pulmonary programs; as well as physical, occupational, and speech therapy.
Offers a balance of services and community atmosphere.
Lower occupancy suggests more openings may be available.
Most residents stay long-term, while a smaller portion are admitted for short-term rehab.
11% of new residents, usually for short-term rehab.
64% of new residents, often for short stays.
25% of new residents, often for long-term daily care.
Chandler Post Acute and Rehabilitation is legally operated by Chandler Post Acute And Rehabilitation, and administrated by Connor Monks.
In Arizona, the Department of Health Services, Bureau of Long Term Care Licensing performs regular onsite inspections and investigates complaints for all licensed residential and nursing facilities.
26 complaint inspections
Arizona average: 6 complaint visits
Arizona average: 5 inspections
Formal expressions of dissatisfaction or concern made by residents, or their families regarding various aspects of the care, services, and environment provided.
Arizona average: 6 complaints
Deficiencies indicate regulatory issues. A higher number implies the facility had several areas requiring improvement.
Arizona average: 9 deficiencies
The most recent inspection on April 30, 2025, found no deficiencies. Earlier inspections generally showed no deficiencies, with isolated citations related mainly to care plan compliance and quality of care appearing in a few complaint surveys during late 2023 and early 2024. Complaint investigations were mostly unsubstantiated, with no enforcement actions, fines, or license issues listed in the available reports. The main themes of cited deficiencies involved care plan compliance and quality of care, with occasional issues in physical health services policies. The inspection history suggests a stable compliance pattern with no recent deficiencies and no clear trend of worsening or improvement.
Arizona average 6.3
Last Health inspection on Nov 2025
Arizona average 23.2
Arizona average 3.82
Health citations are formal notices following inspections when they fail to comply with safety and care standards.
10 of 18 citations resulted from standard inspections; and 8 of 18 resulted from complaint investigations.
Arizona average: 0.1
Arizona average: 0.6
Data sourced from CMS Health Deficiencies reports. Citation severity codes range from A (least serious) to L (most serious). Immediate Jeopardy (J-L) citations indicate situations where the facility's noncompliance has placed residents at risk of death or serious harm.
Assisted Living A licensed, long-term care setting for seniors or individuals with disabilities who need help with daily activities — like bathing, dressing, and medication management — but not 24-hour skilled nursing. Offers housing, meals, and around-the-clock support while aiming to maximize resident independence.
Nursing Home Licensed facility providing 24/7 skilled nursing care for residents with complex, ongoing medical needs. Staffed by RNs, LPNs, and CNAs. Inspected and star-rated annually by CMS. Accepts Medicare (short-term rehab) and Medicaid (long-term care).
Nursing Home Licensed facility providing 24/7 skilled nursing care for residents with complex, ongoing medical needs. Staffed by RNs, LPNs, and CNAs. Inspected and star-rated annually by CMS. Accepts Medicare (short-term rehab) and Medicaid (long-term care).
Assisted Living A licensed, long-term care setting for seniors or individuals with disabilities who need help with daily activities — like bathing, dressing, and medication management — but not 24-hour skilled nursing. Offers housing, meals, and around-the-clock support while aiming to maximize resident independence.
Nursing Home Licensed facility providing 24/7 skilled nursing care for residents with complex, ongoing medical needs. Staffed by RNs, LPNs, and CNAs. Inspected and star-rated annually by CMS. Accepts Medicare (short-term rehab) and Medicaid (long-term care).
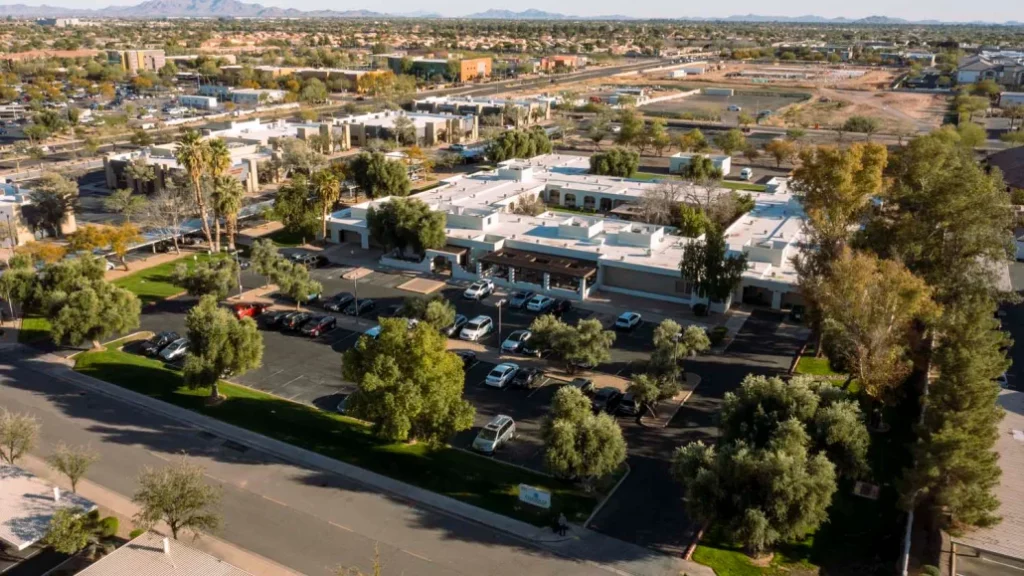
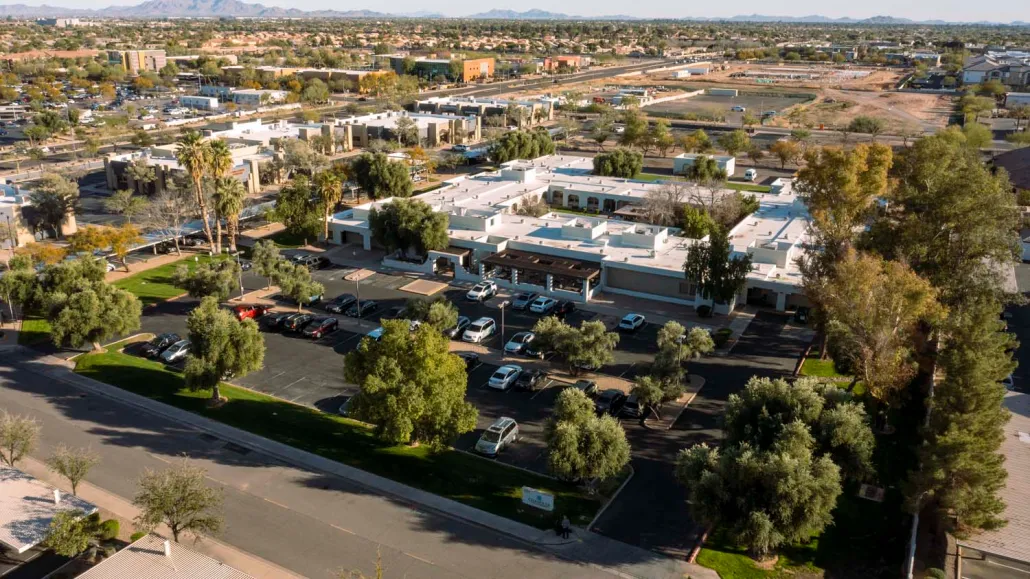
![]() 3.2 miles from city center — 6.37 miles to nearest hospital (Banner Children's at Desert | Mesa, AZ | Dobson Rd.)
3.2 miles from city center — 6.37 miles to nearest hospital (Banner Children's at Desert | Mesa, AZ | Dobson Rd.)
![]() 2121 W Elgin St, Chandler, AZ 85224
2121 W Elgin St, Chandler, AZ 85224
Add your location
This data corresponds to Q2 2025 and is based on CMS Payroll-Based Journal.
Arizona average ratio: 1.83:1
Arizona average: 8.5 hours
Manages medical care and health needs.
This role is partially covered by contractors.
Assists with medical care and medications.
No contractors work on this role.
Helps with daily care and mobility.
No contractors work on this role.
Total hours from contractors
206 contractor hours this quarter
| Certified Nursing Assistant | 74 | 0 | 74 | 20,628 | 91 | 100% | 7.5 |
| Licensed Practical Nurse | 27 | 0 | 27 | 10,293 | 91 | 100% | 10.1 |
| Registered Nurse | 18 | 1 | 19 | 5,144 | 91 | 100% | 8.9 |
| Dental Services Staff | 8 | 0 | 8 | 3,014 | 91 | 100% | 8.2 |
| Speech Language Pathologist | 7 | 0 | 7 | 1,907 | 71 | 78% | 7.1 |
| Physical Therapy Assistant | 6 | 0 | 6 | 1,867 | 79 | 87% | 7.3 |
| RN Director of Nursing | 5 | 0 | 5 | 1,510 | 67 | 74% | 9.7 |
| Respiratory Therapy Technician | 6 | 0 | 6 | 983 | 77 | 85% | 8.1 |
| Qualified Social Worker | 6 | 0 | 6 | 909 | 67 | 74% | 7.6 |
| Other Dietary Services Staff | 3 | 0 | 3 | 791 | 76 | 84% | 7.8 |
| Physical Therapy Aide | 7 | 0 | 7 | 736 | 68 | 75% | 6.3 |
| Clinical Nurse Specialist | 3 | 0 | 3 | 606 | 63 | 69% | 8.9 |
| Nurse Practitioner | 1 | 0 | 1 | 569 | 62 | 68% | 9.2 |
| Administrator | 1 | 0 | 1 | 520 | 65 | 71% | 8 |
| Dietitian | 1 | 0 | 1 | 479 | 60 | 66% | 8 |
| Occupational Therapy Aide | 1 | 1 | 2 | 140 | 28 | 31% | 4.7 |
| Medical Director | 0 | 1 | 1 | 50 | 3 | 3% | 16.5 |
Source: CMS Long-Term Care Facility Characteristics (Data as of Jan 2026)
Residents meet regularly to discuss policies, care quality, and activities
Organized group of residents that meets regularly to discuss facility policies, quality of life, and activities.
Data sourced from CMS Long-Term Care Facility Characteristics quarterly report. Payer mix reflects the current resident census by primary payment source.
These measures show how residents usually do over time at this home, based on health outcomes and preventive care.
Arizona average: 7.6
Arizona average: 16.1
Arizona average: 11.2%
Arizona average: 15.8%
Arizona average: 20.8%
Arizona average: 2.1%
Arizona average: 5.1%
Arizona average: 1.3%
Arizona average: 5.4%
Arizona average: 4.5%
Arizona average: 10.3%
Arizona average: 97.2%
Arizona average: 94.6%
Arizona average: 91.5%
Arizona average: 1.0%
Arizona average: 87.3%
Arizona average: 24.6%
Arizona average: 10.7%
Arizona average: 0.8%
Arizona average: 53.7%
Arizona average: 50.6%
Quality measures are calculated from Minimum Data Set (MDS) assessments. For most measures, lower percentages indicate better care quality.
Historical financial and operational data for Chandler Post Acute and Rehabilitation based on CMS SNF Cost Reports.
Loading trend charts...
Care Cost Calculator: See Prices in Your Area
Nursing Home Data Explorer
Don’t Wait Too Long: 7 Red Flag Signs Your Parent Needs Assisted Living Now
The True Cost of Assisted Living in 2025 – And How Families Are Paying For It
Understanding Senior Living Costs: Pricing Models, Discounts & Financial Assistance

Touring a community? Use this expert-backed checklist to stay organized, ask the right questions, and find the perfect fit.
We'll send you a PDF version of the touring checklist.