Desert Cove Nursing Center
CMS overall rating Info CMS (the Centers for Medicare & Medicaid Services) is the federal agency that rates nursing home quality. Its Overall Rating runs from 1 to 5 stars, combining health inspections, staffing, and quality measures, with inspections weighted most heavily.

Desert Cove Nursing Center

CMS overall rating Info CMS (the Centers for Medicare & Medicaid Services) is the federal agency that rates nursing home quality. Its Overall Rating runs from 1 to 5 stars, combining health inspections, staffing, and quality measures, with inspections weighted most heavily.
Calculator: See prices in your area
Desert Cove Nursing Center accepts Medicare, Medicaid, and private pay.

Overview of Desert Cove Nursing Center

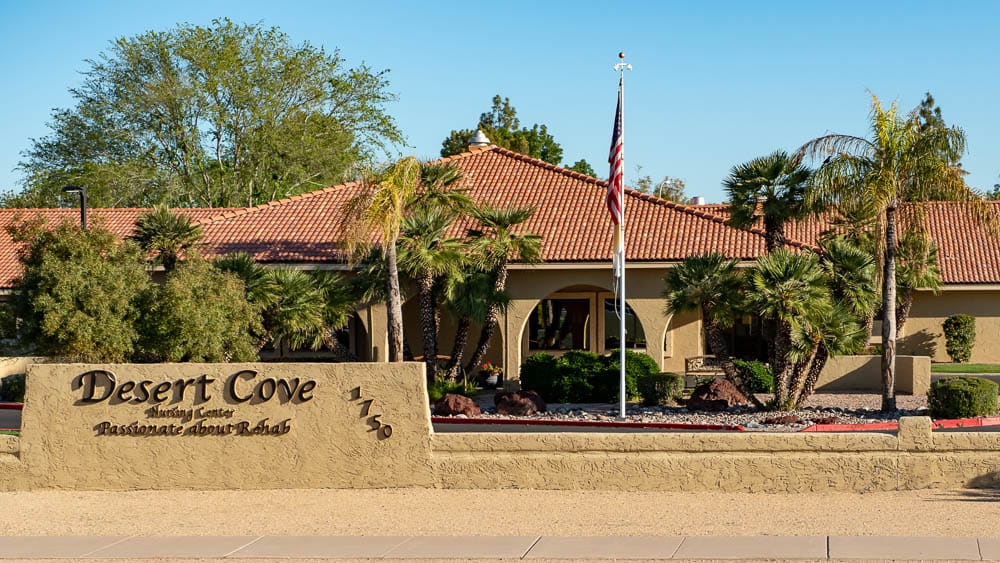
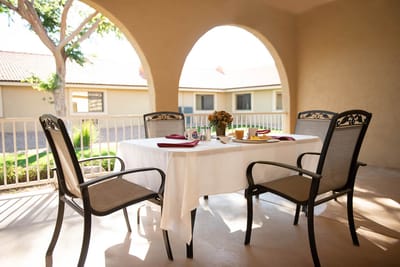
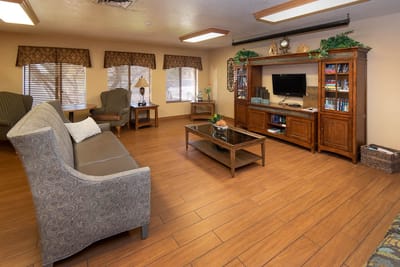
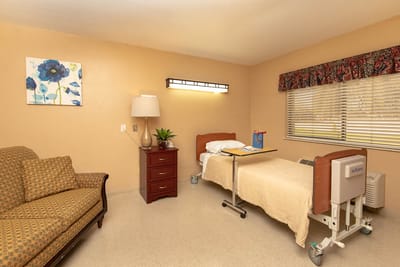
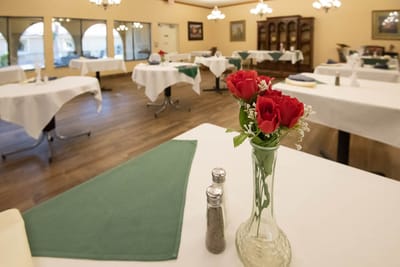
Desert Cove Nursing Center is a skilled nursing and rehabilitation center in Chandler. The upscale nursing home aims to change the meaning of skilled nursing and rehabilitation for seniors through the exceptional care delivered by their patient-friendly staff to offer the best care possible for their residents. Desert Cove is trusted as a safe and secure community that cares for every patient’s needs. 

Convenience and hassle-free living are the centers of Desert Cove services: medication management, post-surgical care, and wound care; their 24-hour skilled nursing care services provide compassionate care as their utmost priority. Other benefits include 24/7 easy admissions, fall prevention, IV therapy, discharge planning, and case management.

Quality ratings

Measured by Centers for Medicare & Medicaid Services (CMS)

Overall rating Info The Overall CMS Rating combines results from health inspections, staffing levels and quality measures. Health inspections carry the most weight. Staffing and quality scores can increase or decrease the final rating based on performance compared to state and national standards.
▼ 39.7% Below AZ avg. ▼ 39.7% Below AZ avg.AZ average: 3.3Click the badge to see the full State ranking.Click here to see the full State ranking.
Health Inspection Info Based on the results of the facility's three most recent standard inspections and any complaint investigations. CMS reviews the number, scope, and severity of deficiencies, with more recent findings weighted more heavily.
▼ 63.9% Below AZ avg. ▼ 63.9% Below AZ avg.AZ average: 2.8Click the badge to see the full State ranking.Click here to see the full State ranking.
Staffing Info Measures average nursing staff hours per resident per day, including Registered Nurses (RNs) and total nursing staff. Ratings are adjusted based on the level of care residents require and are compared to state and national benchmarks.
At AZ avg. At AZ avg.AZ average: 3.0Click the badge to see the full State ranking.Click here to see the full State ranking.
Quality Measures Info Based on clinical and physical health indicators reported to CMS, such as hospital readmissions, falls, pressure ulcers, and improvements in mobility. These measures reflect how well residents' health needs are being managed.
▲ 10.8% Above AZ avg. ▲ 10.8% Above AZ avg.AZ average: 4.5Click the badge to see the full State ranking.Click here to see the full State ranking.

Staffing hours breakdown

Info Daily nursing hours per resident by staff type, reported to CMS. Higher is generally better — compare this facility to state and national averages to see where staffing stands.

Hours per resident per day — compared to Arizona state averages

Total nursing care / resident Info This home is ranked 55th out of 71 homes in Arizona for nurse hours. Total adjusted nursing hours per resident per day, combining RN, LPN, and aide time. CMS adjusts this for case-mix so facilities can be fairly compared.
3h 26m per day
Rank #55 / 71Nurse hours — State benchmarkedThis home is ranked 55th out of 71 homes in Arizona. Shows adjusted nurse hours per resident per day benchmarked to the Arizona average, with a ranking across 71 Arizona facilities. More hours mean more direct care. The national average is about 3.5 hrs; below 3.0 is a red flag.Rankings are based only on facilities in Arizona that report data for that category. Facilities without available data are excluded from the ranking.Click the rank badge to see the full State ranking.Click here to see the full State ranking.
This facility Arizona avg (4h 4m per day)
vs Arizona avg
-16%

4 of 6 metrics below state avg

Standout metric LPN / LVN is +24% above state avg
Staff typeHours / Day / Residentvs state avg
Registered Nurse (RN) Info RNs hold the highest nursing license and can assess residents, interpret test results, and direct care plans. More RN hours per day often signals stronger clinical oversight and faster response to health changes. 26m per day ▼ 39% State avg: 43m per day · National avg: 41m per day
LPN / LVN Info Licensed Practical Nurses (LPNs) or Licensed Vocational Nurses (LVNs) deliver routine hands-on care — medication administration, wound dressing, and monitoring vital signs. They work under RN supervision and make up a large share of daily bedside care. 1h 18m per day ▲ 24% State avg: 1h 3m per day · National avg: 52m per day
Nurse Aide Info Certified Nurse Aides (CNAs) provide the most direct day-to-day assistance: bathing, dressing, feeding, and mobility. Nurse aide hours are typically the largest staffing category and directly affect residents' quality of life. 2h 7m per day ▼ 11% State avg: 2h 22m per day · National avg: 2h 21m per day
Weekend Total Nursing Info Combined nursing hours (RN + LPN + Nurse Aide) per resident per day on weekends. Staffing often drops on weekends — this figure reveals whether the facility maintains adequate coverage outside of weekday hours. 3h 33m per day ■ Avg State avg: 3h 38m per day · National avg: 3h 26m per day
Physical Therapist Info Hours per resident per day provided by licensed Physical Therapists (PTs) or PT Assistants. PT services help residents recover mobility after injury or illness and are especially important for post-acute (short-stay) rehabilitation. 4m per day ▼ 37% State avg: 6m per day · National avg: 4m per day
Weekend RN Info Registered nurse hours specifically on weekends. Facilities sometimes reduce RN presence on Saturdays and Sundays — a low weekend RN figure compared to weekday hours can indicate reduced clinical oversight when most administrative staff are absent. 22m per day ▼ 29% State avg: 31m per day · National avg: 29m per day

Capacity and availability

This home usually has availability

Lower occupancy than the Arizona average: 72.7%
Occupancy rate
52.8% Rank #61 / 76Occupancy rate — State benchmarkedThis home is ranked 61st out of 76 homes in Arizona. Shows this facility's occupancy rate versus the Arizona average, with its Statewide rank out of 76. Higher occupancy signals strong local demand and financial stability.Rankings are based only on facilities in Arizona that report data for that category. Facilities without available data are excluded from the ranking.Click the rank badge to see the full State ranking.Click here to see the full State ranking.
Avg. Length of Stay
40 days
Bed community size
120-bed community
A larger shared setting that may offer more common spaces and organized community services.
Walk Score
Walk Score: 57 / 100
Moderately walkable. Some errands can be accomplished on foot, with a mix of nearby amenities.

Therapy & Rehabilitation

1 service
Rehabilitation Services

Additional Services

2 services
Alzheimer's & Dementia Care
Independent & Assisted Living

Contact Desert Cove Nursing Center

Staffing Data

Reporting period: October 1 – December 31, 2025 (Q4 2025). Source: CMS Payroll-Based Journal report.

Total staff 107
Employees 102
Contractors 5
Staff to resident ratio 1.75 : 1
0% compared with Arizona average
Arizona average ratio: 1.80 : 1 Arizona average ratio: 1.80 : 1See full Arizona ranking
Avg staff/day 34
Average shift 8.9 hours
5% better than Arizona average
Arizona average: 8.5 hours Arizona average shift: 8.5 hoursSee full Arizona ranking
Total staff hours (quarter) 27,768

Nursing staff breakdown

Q4 2025 · Oct 1 – Dec 31 More info This data comes from the CMS Payroll-Based Journal report covering October 1 – December 31, 2025.
Registered Nurse

Manages medical care and health needs.

RN Staff Info All 10 RN Staff are full-time employees. No contractors work on this role. 10
Average shift length Info Average shift length. Calculated as total hours divided by days worked and average staff per day. 10 hours
Licensed Practical Nurse

Assists with medical care and medications.

LPN Staff Info All 18 LPN Staff are full-time employees. No contractors work on this role. 18
Average shift length Info Average shift length. Calculated as total hours divided by days worked and average staff per day. 9.8 hours
Certified Nursing Assistant

Helps with daily care and mobility.

CNA Staff Info All 43 CNA Staff are full-time employees. No contractors work on this role. 43
Average shift length Info Average shift length. Calculated as total hours divided by days worked and average staff per day. 9.2 hours

Contractor staffing

Q4 2025 · Oct 1 – Dec 31 More info This data comes from the CMS Payroll-Based Journal report covering October 1 – December 31, 2025.

Total hours from contractors

0.5%

151 contractor hours this quarter

Occupational Therapy Aide: 2 Occupational Therapy Assistant: 2 Medical Director: 1

Staff by category

Q4 2025 · Oct 1 – Dec 31 More info This data comes from the CMS Payroll-Based Journal report covering October 1 – December 31, 2025.
Certified Nursing Assistant4304312,33292100%9.2
Licensed Practical Nurse180187,30192100%9.8
Registered Nurse100101,9449199%10
Speech Language Pathologist5059247480%7.2
Clinical Nurse Specialist2025685762%8.7
Physical Therapy Aide2025638188%6.7
RN Director of Nursing2025506166%8
Physical Therapy Assistant3034606672%6.8
Qualified Social Worker2024556368%7.2
Other Dietary Services Staff1014456065%7.4
Dietitian1014446773%6.6
Mental Health Service Worker1014405560%8
Medication Aide/Technician1013993740%10.8
Respiratory Therapy Technician6063796975%4.9
Administrator3032883134%8
Nurse Practitioner2021261415%9
Occupational Therapy Aide022812830%2.7
Occupational Therapy Assistant0224233%10.5
Medical Director0112933%9.5
43 Certified Nursing Assistant
% of Days 100%
18 Licensed Practical Nurse
% of Days 100%
10 Registered Nurse
% of Days 99%
5 Speech Language Pathologist
% of Days 80%
2 Clinical Nurse Specialist
% of Days 62%
2 Physical Therapy Aide
% of Days 88%
2 RN Director of Nursing
% of Days 66%
3 Physical Therapy Assistant
% of Days 72%
2 Qualified Social Worker
% of Days 68%
1 Other Dietary Services Staff
% of Days 65%
1 Dietitian
% of Days 73%
1 Mental Health Service Worker
% of Days 60%
1 Medication Aide/Technician
% of Days 40%
6 Respiratory Therapy Technician
% of Days 75%
3 Administrator
% of Days 34%
2 Nurse Practitioner
% of Days 15%
2 Occupational Therapy Aide
% of Days 30%
2 Occupational Therapy Assistant
% of Days 3%
1 Medical Director
% of Days 3%

Penalties and fines

Federal penalties imposed by CMS for regulatory violations, including civil money penalties (fines) and denials of payment for new Medicare/Medicaid admissions.

Source: CMS Penalties Database

No penalties in the past 3 years

No civil money penalties or payment denials were reported in the last 3 years.

Quality of care over time

These measures show how residents usually do over time at this home, based on health outcomes and preventive care.

High-risk clinical events score Info A composite score based on pressure ulcers, falls with injury, weight loss, walking ability decline, and activities of daily living decline. 3.5
54% better than Arizona average

Arizona average: 7.6

Functional decline score Info A composite score based on activities of daily living decline, walking ability decline, and incontinence. 5.4
67% better than Arizona average

Arizona average: 16.1

Long-stay resident measures
Significantly above average Arizona avg: 3.8 Info CMS star rating based on long-stay quality measure performance. 5 stars = significantly above average, 1 star = significantly below average.
Need for Help with Daily Activities Increased Info Percent of long-stay residents whose need for help with daily activities has increased 2.3%
79% better than Arizona average

Arizona average: 11.2%

Walking Ability Worsened Info Percent of long-stay residents whose ability to move independently worsened 0.0%
100% better than Arizona average

Arizona average: 15.8%

Low Risk Residents with Bowel/Bladder Incontinence Info Percent of low risk long-stay residents who lose control of their bowels or bladder 13.8%
34% better than Arizona average

Arizona average: 20.8%

Falls with Major Injury Info Percent of long-stay residents experiencing one or more falls with major injury 0.6%
71% better than Arizona average

Arizona average: 2.1%

High Risk Residents with Pressure Ulcers Info Percent of long-stay high risk residents with pressure ulcers 9.8%
94% worse than Arizona average

Arizona average: 5.1%

Urinary Tract Infection Info Percent of long-stay residents with a urinary tract infection 0.6%
54% better than Arizona average

Arizona average: 1.3%

Lost Too Much Weight Info Percent of long-stay residents who lose too much weight 4.7%
14% better than Arizona average

Arizona average: 5.4%

Depressive Symptoms Info Percent of long-stay residents who have depressive symptoms 3.9%
14% better than Arizona average

Arizona average: 4.5%

Antipsychotic Use Info Percent of long-stay residents who received an antipsychotic medication 8.2%
20% better than Arizona average

Arizona average: 10.3%

Pneumococcal Vaccine Info Percent of long-stay residents assessed and appropriately given the pneumococcal vaccine 100.0%
In line with Arizona average

Arizona average: 97.2%

Influenza Vaccine Info Percent of long-stay residents assessed and appropriately given the seasonal influenza vaccine 95.7%
In line with Arizona average

Arizona average: 94.6%

Short-stay resident measures
Significantly above average Arizona avg: 4.2 Info CMS star rating based on short-stay quality measure performance. 5 stars = much above average, 1 star = much below average.
Pneumococcal Vaccine Info Percent of short-stay residents assessed and appropriately given the pneumococcal vaccine 87.6%
In line with Arizona average

Arizona average: 91.5%

Antipsychotic medication increase Info Percent of short-stay residents who newly received an antipsychotic medication 0.3%
73% better than Arizona average

Arizona average: 1.0%

Influenza Vaccine Info Percent of short-stay residents assessed and appropriately given the seasonal influenza vaccine 78.4%
10% worse than Arizona average

Arizona average: 87.3%

Re-hospitalized after SNF stay Info Percentage of short-stay residents who were re-hospitalized after their nursing home admission. 29.3%
19% worse than Arizona average

Arizona average: 24.6%

Emergency department visits Info Percentage of short-stay residents who had an outpatient emergency department visit. 4.0%
63% better than Arizona average

Arizona average: 10.7%

Falls with major injury Info Percentage of SNF residents who experience falls with major injury during their stay. 0.0%
100% better than Arizona average

Arizona average: 0.8%

Ability to care for self at discharge Info Percentage of residents at or above expected ability to care for themselves at discharge. 76.7%
43% better than Arizona average

Arizona average: 53.7%

Successful return to home or community Info Rate of successful return to home or community from a skilled nursing facility. 63.2%
25% better than Arizona average

Arizona average: 50.6%

Breakdown by payment type

Medicare

8% of new residents, usually for short-term rehab.

Typical stay 27 days

Private pay

72% of new residents, often for short stays.

Typical stay 16 days

Medicaid

20% of new residents, often for long-term daily care.

Typical stay 4 - 5 months

Facility Characteristics

Source: CMS Long-Term Care Facility Characteristics (Data as of Jan 2026)

Total residents 61
Medicare
3
4.9% of residents
Medicaid
39
63.9% of residents
Private pay or other
19
31.1% of residents
Programs & Services
Residents Group

Residents meet regularly to discuss policies, care quality, and activities

Active Resident Council

Organized group of residents that meets regularly to discuss facility policies, quality of life, and activities.

Finances and operations

Based on CMS SNF Cost Report for fiscal year ending in 12/2023.

For-profit
Corporation
Net patient revenue Info Net patient revenue — what the home actually collects for resident care, after contractual allowances, bad debt and discounts are subtracted from its gross charges (CMS cost report, Worksheet G-3). It covers resident care only; money the home earns from other sources is shown separately as "Other income."
$8.2M
Net patient income Info Net patient income: net patient revenue minus the home's total operating expenses. A positive figure means it earns more from resident care than it spends to deliver it; a negative figure means the opposite. It excludes non-operating "other income."
-$747.4K
For-profit Corporation
Net patient revenue Info Net patient revenue — what the home actually collects for resident care, after contractual allowances, bad debt and discounts are subtracted from its gross charges (CMS cost report, Worksheet G-3). It covers resident care only; money the home earns from other sources is shown separately as "Other income."
$8.2M Rank #51 / 79Revenue — State benchmarkedThis home is ranked 51st out of 79 homes in Arizona. Shows this facility's annual revenue compared to the Arizona average. Higher revenue generally means more resources for staffing and capital — read alongside Payroll %.Rankings are based only on facilities in Arizona that report data for that category. Facilities without available data are excluded from the ranking.Click the rank badge to see the full State ranking.Click here to see the full State ranking.
Net patient income Info Net patient income: net patient revenue minus the home's total operating expenses. A positive figure means it earns more from resident care than it spends to deliver it; a negative figure means the opposite. It excludes non-operating "other income."
-$747.4K
Other income Info Money the home earns outside of resident care — such as investments, grants, rentals and other non-operating sources (CMS cost report, Worksheet G-3). It is tracked separately from net patient revenue: it is not part of that figure, and it is not included in net patient income.
$89.9K
Payroll costs Info Staff salaries plus wage-related costs — benefits such as payroll taxes, health insurance and retirement — from the home's own accounting records (CMS cost report, Worksheet A). Contract or agency labor is counted separately, under other operating costs. Rank #58 / 79Payroll — State benchmarkedThis home is ranked 58th out of 79 homes in Arizona. Shows total annual staff payroll benchmarked to the Arizona average. Higher payroll investment relative to peers often signals better staffing and less reliance on cheaper contract labor.Rankings are based only on facilities in Arizona that report data for that category. Facilities without available data are excluded from the ranking.Click the rank badge to see the full State ranking.Click here to see the full State ranking.
$5.3M 65.5% of net patient revenue Info Payroll as a share of revenue: staff salaries and wage-related benefits divided by net patient revenue. A higher figure means more of each revenue dollar goes to staff pay. Rank #41 / 79Payroll % — State benchmarkedThis home is ranked 41st out of 79 homes in Arizona. Shows payroll as a percentage of revenue versus the Arizona average. Well-run Arizona facilities typically land around 58–71% — the top third Statewide. Below 25% may signal understaffing or heavy agency use — read with Staffing ratings.Rankings are based only on facilities in Arizona that report data for that category. Facilities without available data are excluded from the ranking.Click the rank badge to see the full State ranking.Click here to see the full State ranking.
Other operating costs Info Everything it costs to run the home apart from payroll — food, utilities, supplies, maintenance, contract labor and administration. Calculated as total operating expense minus payroll (staff salaries and wage-related benefits).
$3.6M
Total costs Info The home's total operating expense for the year — all the costs of running it, salaries included (CMS cost report, Worksheet G-3).
$8.9M

Who this home usually serves

TYPE OF STAY

Primarily long-term care, limited rehab

Most residents stay long-term, while a smaller portion are admitted for short-term rehab.

Most new residents arrive under private pay (72% of admissions), and a typical private pay stay runs around 16 days.

Admissions
566 total

Coverage residents most often arrive under.

Medicare 8%
Private pay 72%
Medicaid 20%
Discharges
571 total

Coverage residents most often leave under.

Medicare 7%
Private pay 72%
Medicaid 21%

Places of interest near Desert Cove Nursing Center

Address 2.8 miles from city center Info Estimated distance in miles from Chandler's city center to Desert Cove Nursing Center's address, calculated via Google Maps.

Calculate Travel Distance to Desert Cove Nursing Center

Add your location

Address

Compare Nursing Homes around Chandler

The information below is reported by the Arizona Department of Health Services, Bureau of Long Term Care Licensing.

4 facilities compared · CMS & AZ Dept. of Health data

Archstone Care Center
NH
Chandler (West Pecos Road)120
45.8%
Facility 45.8%
AZ AVG 72.7%
Rank #64 / 76
-37%
3.67
Facility 3.67
AZ AVG 4.06
Rank #43 / 71
+6%-10%
$0
Facility $0
AZ AVG $31.7k
Rank #1 / 75
77
Facility 77
AZ AVG 82
Rank #16 / 53
16
Facility 16
AZ AVG 23.2
Rank #27 / 75
4.0
Facility 4.0
AZ AVG 3.8
Rank #42 / 75
-55- 29 Beh Properties Inc
$10.0M
Facility $10.0M
AZ AVG $14.7M
Rank #68 / 79
$5.5M
Facility $5.5M
AZ AVG $6.4M
Rank #53 / 79
55.4%
Facility 55.4%
AZ AVG 48.1%
Rank #10 / 79
35130
Santé of Chandler – Skilled Nursing & Rehabilitation
NH
HC
PC
Chandler (South 94Th Street)70
96.1%
Facility 96.1%
AZ AVG 72.7%
Rank #7 / 76
+32%- -44%-
$0
Facility $0
AZ AVG $31.7k
Rank #1 / 75
-
10
Facility 10
AZ AVG 23.2
Rank #11 / 75
5.0
Facility 5.0
AZ AVG 3.8
Rank #58 / 75
-68- 29 Santana Falls LLC
$14.9M
Facility $14.9M
AZ AVG $14.7M
Rank #11 / 79
$7.7M
Facility $7.7M
AZ AVG $6.4M
Rank #33 / 79
52.1%
Facility 52.1%
AZ AVG 48.1%
Rank #77 / 79
35283
Chandler Post Acute and Rehabilitation
NH
Chandler (West Elgin Street)120
85.0%
Facility 85.0%
AZ AVG 72.7%
Rank #25 / 76
+17%
4.05
Facility 4.05
AZ AVG 4.06
Rank #30 / 71
-3%0%
$15.9k
Facility $15.9k
AZ AVG $31.7k
Rank #70 / 75
74
Facility 74
AZ AVG 82
Rank #20 / 53
18
Facility 18
AZ AVG 23.2
Rank #28 / 75
2.0
Facility 2.0
AZ AVG 3.8
Rank #6 / 75
-106- 44 Brett Jones
$17.9M
Facility $17.9M
AZ AVG $14.7M
Rank #37 / 79
$9.2M
Facility $9.2M
AZ AVG $6.4M
Rank #24 / 79
51.4%
Facility 51.4%
AZ AVG 48.1%
Rank #12 / 79
35101
Desert Cove Nursing Center
NH
Chandler120
52.8%
Facility 52.8%
AZ AVG 72.7%
Rank #61 / 76
-27%
3.43
Facility 3.43
AZ AVG 4.06
Rank #55 / 71
-7%-16%
$0
Facility $0
AZ AVG $31.7k
Rank #1 / 75
-
35
Facility 35
AZ AVG 23.2
Rank #60 / 75
3.5
Facility 3.5
AZ AVG 3.8
Rank #35 / 75
166- 57 Life Care Affiliates II
$8.2M
Facility $8.2M
AZ AVG $14.7M
Rank #51 / 79
$5.3M
Facility $5.3M
AZ AVG $6.4M
Rank #58 / 79
65.5%
Facility 65.5%
AZ AVG 48.1%
Rank #41 / 79
35095

Financial Assistance for
Nursing Home in Arizona

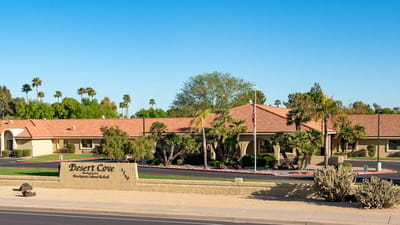
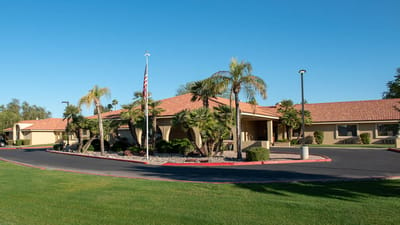
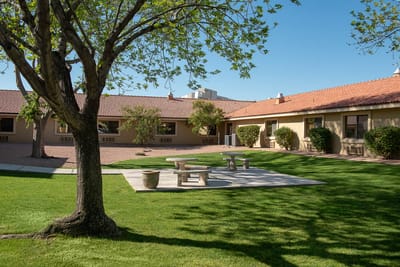
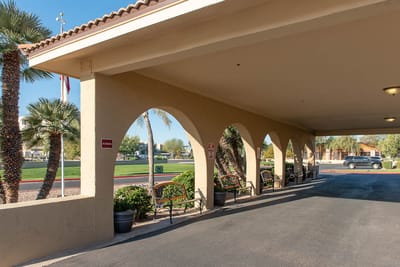
Desert Cove Nursing Center is located in Chandler, Arizona.
Here are the financial assistance programs available to residents in Arizona.

Get Financial aid guidance

Arizona Long Term Care System

ALTCS

Age 65+ or disabled
General Arizona resident, Medicaid-eligible, nursing home-level care need.
Income Limits (2025) ~$2,829/month 300% FBR, individual
Asset Limits $2,000 (individual), $3,000 (couple).
AZ

Covers tribal members; rural outreach.

Benefits
In-home care (6-8 hours/day) Assisted living Nursing home care Medical services Transportation (10 trips/month)

Non-Medical Home and Community Based Services

AZ DES Non-Medical HCBS

Age 60+
General Arizona resident, at risk of institutionalization.
Income Limits ~$2,000/month individual, varies
Asset Limits $10,000 individual
AZ

Limited funding; waitlists common.

Benefits
Homemaker services (3-5 hours/week) Respite care (up to 10 days/year) Adult day care (~$60/day)

Weatherization Assistance Program (WAP)

AZ WAP

Age 60+ priority
General Arizona resident, own/rent home, low-income.
Income Limits (2025) ~$2,510/month 200% of poverty level, individual
Asset Limits Not applicable; income-focused.
AZ

High demand in rural desert areas; limited annual funds.

Benefits
Insulation Weather stripping HVAC repairs (avg. $500-$1,000/year savings)

Section 202 Supportive Housing for the Elderly

AZ Section 202

Age 62+
General Arizona resident, very low income, able to live independently with support.
Income Limits (2025) ~$1,645/month 50% of area median income, individual, varies by county
Asset Limits $10,000 individual, excludes home if owned
AZ

Limited units; high demand in metro areas like Phoenix.

Benefits
Subsidized rent (30% of income, e.g., $300-$500/month) On-site services (housekeeping, transportation, ~$200/month value)

Arizona CARES Program

AZ CARES

Age
General Caregivers of Arizona residents 60+ needing help with 3+ daily activities; no caregiver age limit.
Income Limits No strict limit; cost-sharing above ~$2,500/month threshold.
Asset Limits Not applicable; need-based.
AZ

Focus on rural access; complements ALTCS respite.

Benefits
Respite care (up to 10 days/year) Counseling (4-6 sessions/year) Training (2-3 workshops/year) Supplies (~$200/year)

AZ DES Non-Medical Home and Community Based Services (HCBS)

AZ DES Non-Medical HCBS

Age 60+ or disabled
General Arizona resident, need assistance with daily activities, not eligible for Medicaid/ALTCS.
Income Limits Above Medicaid threshold but low-income ~$1,500-$2,500/month, varies by region
Asset Limits Not specified; income-driven eligibility.
AZ

Targets those ineligible for ALTCS; prioritizes rural and tribal areas.

Benefits
Homemaker services (3-5 hours/week) Personal care (limited hours) Respite care (up to 10 days/year) Transportation (~5 trips/month)

Frequently Asked Questions about Desert Cove Nursing Center

Is Desert Cove Nursing Center in a walkable area?

Desert Cove Nursing Center has a walk score of 57. Moderately walkable. Some errands can be accomplished on foot, with a mix of nearby amenities.

What is the occupancy rate at Desert Cove Nursing Center?

Desert Cove Nursing Center's occupancy is 52.8%.

Does Desert Cove Nursing Center operate as a for-profit or non-profit?

Desert Cove Nursing Center is registered as a for-profit.

Are there photos of Desert Cove Nursing Center?

Yes — there are 25 photos of Desert Cove Nursing Center in the photo gallery on this page.

What is the address of Desert Cove Nursing Center?

Desert Cove Nursing Center is located at Parking Lot, 1750 W Frye Rd, Chandler, AZ 85224.

What is the phone number of Desert Cove Nursing Center?

(480) 899-0641 will put you in contact with the team at Desert Cove Nursing Center.

Is Desert Cove Nursing Center Medicare or Medicaid certified?

Yes — Desert Cove Nursing Center is a CMS-certified provider of Medicare and Medicaid.

Guides for Better Senior Living

Care Cost Calculator: See Prices in Your Area

Nursing Home Data Explorer

Don’t Wait Too Long: 7 Red Flag Signs Your Parent Needs Assisted Living Now

The True Cost of Assisted Living in 2025 – And How Families Are Paying For It

Understanding Senior Living Costs: Pricing Models, Discounts & Financial Assistance