Total health inspections
9
Illinois average 10.4
Last Health inspection on Jan 2025

We arrange tours, appointments, and even moving support so you don’t have to
Thank you for your interest!
Our team will be in touch shortly to help with next steps.
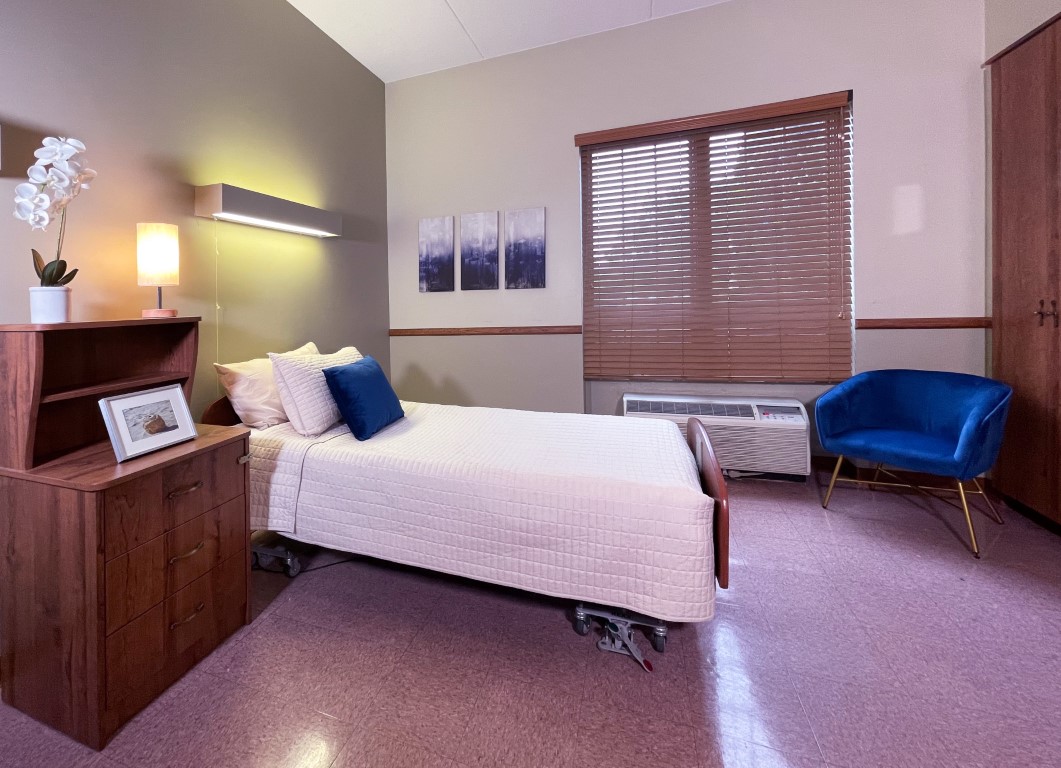

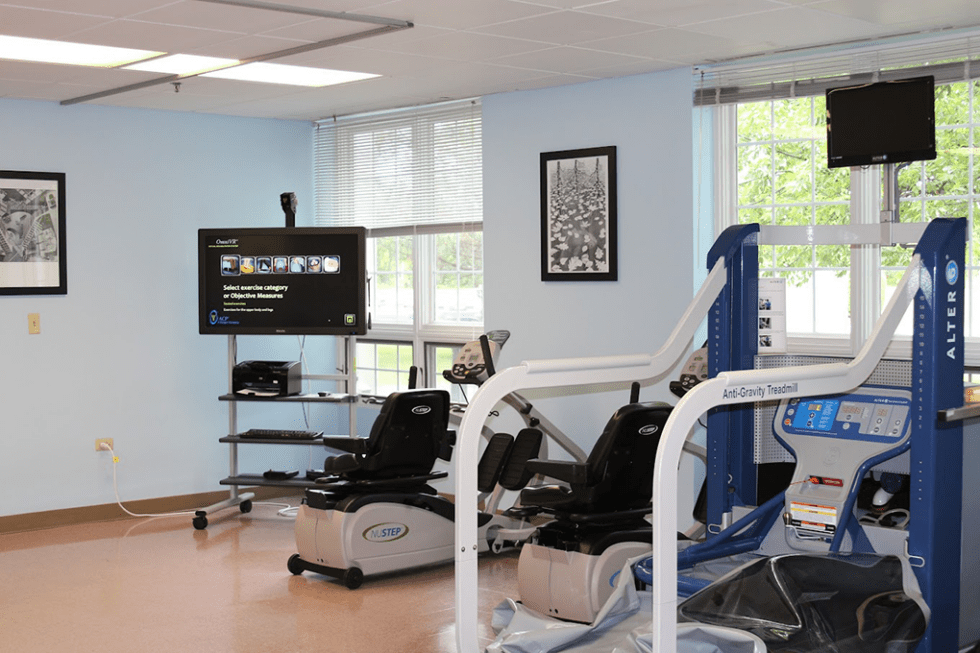


Live a fulfilling lifestyle while maintaining your maximum potential in Chateau Nursing and Rehabilitation Center, a vibrant and welcoming community in Willowbrook, IL, offering exceptional care. Their team is highly skilled in providing residents with skilled nursing care and various rehabilitation services, helping residents maintain their overall functioning. Residents here are given pain management services and access to physical, speech, and occupational services for a comfortable and pain-free healing journey.
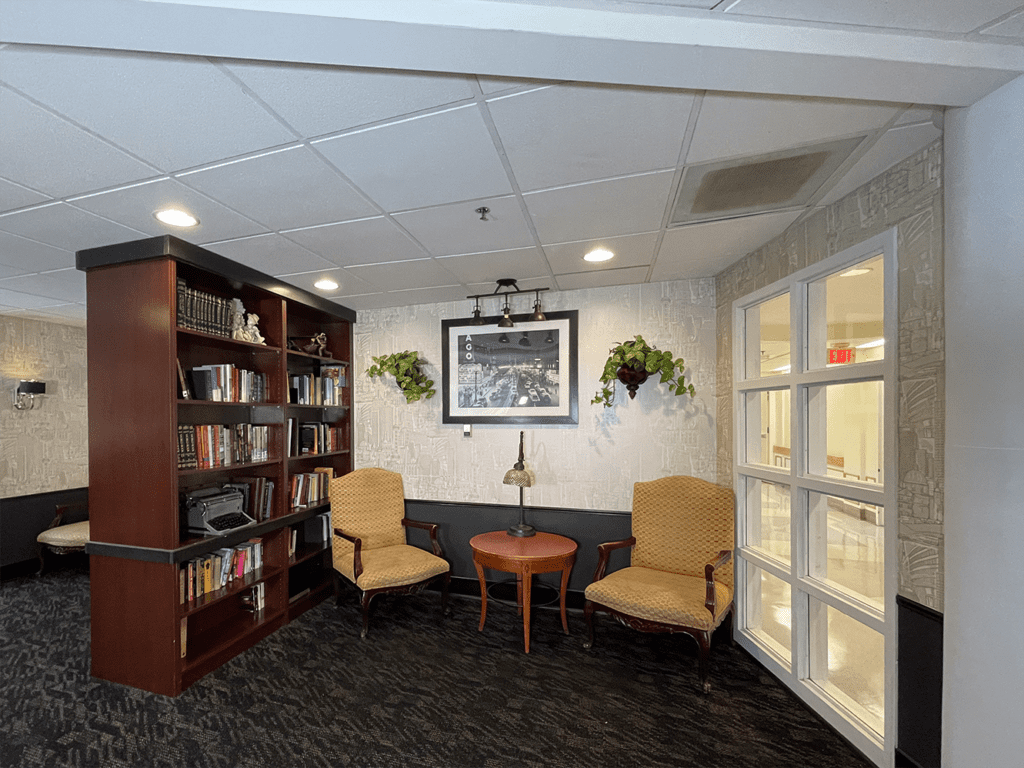
Countless leisure and recreational activities are also available to ensure residents stay active and well-connected. With housekeeping services provided regularly, residents can focus on living their best lives while enjoying the comfort of their safe and well-organized living environment. Here, residents are given all the comfort and support they need to maintain their well-being and continue enjoying the golden years they deserve.
Offers a balance of services and community atmosphere.
Lower occupancy suggests more openings may be available.
Most residents stay for extended periods and receive ongoing daily care.
28% of new residents, usually for short-term rehab.
18% of new residents, often for short stays.
54% of new residents, often for long-term daily care.
Housing Options: Private / Semi-Private Rooms
Building Type: 2-story
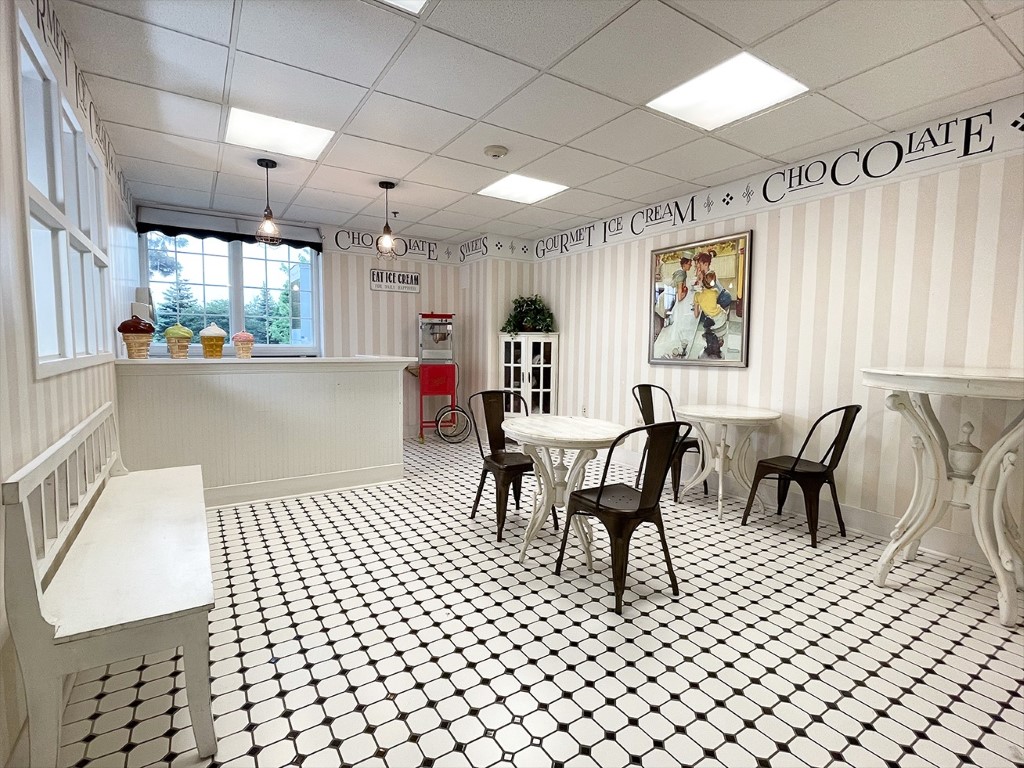
Dining Services
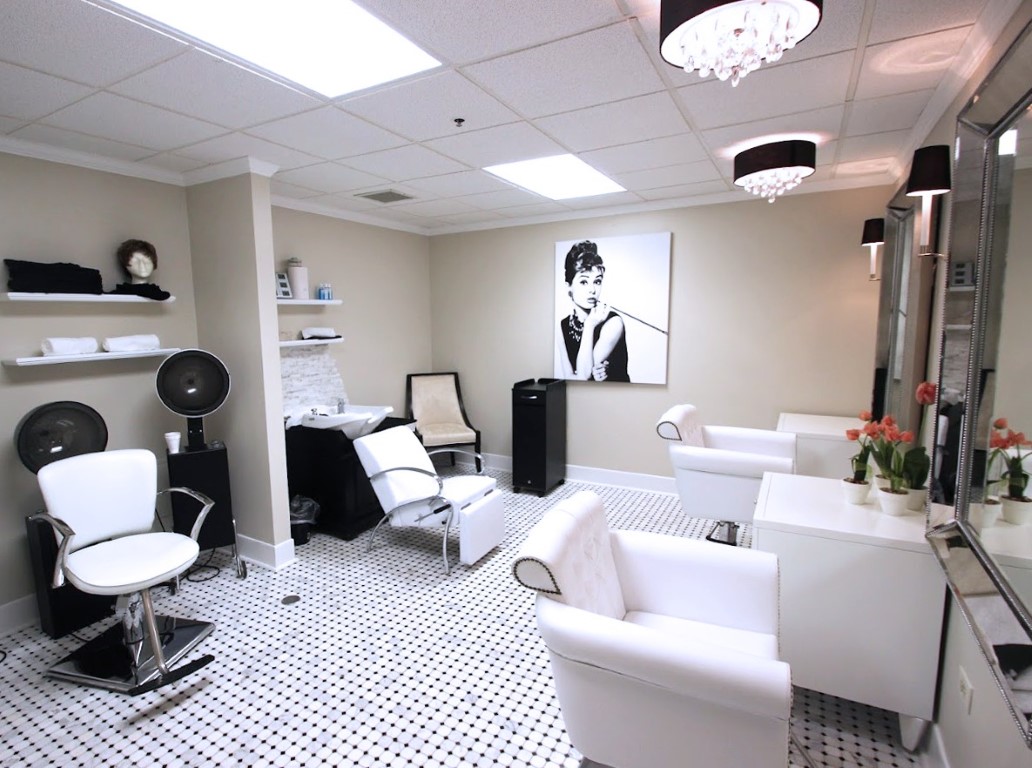
Beauty Services
Housekeeping Services
Recreational Activities
Exercise Programs
Illinois average 10.4
Last Health inspection on Jan 2025
Illinois average 36.8
Illinois average 3.68
Health citations are formal notices following inspections when they fail to comply with safety and care standards.
24 of 35 citations resulted from standard inspections; 10 of 35 resulted from complaint investigations; and 1 of 35 came from combined inspections (standard and complaint).
Illinois average: 0.7
Illinois average: 3.6
Data sourced from CMS Health Deficiencies reports. Citation severity codes range from A (least serious) to L (most serious). Immediate Jeopardy (J-L) citations indicate situations where the facility's noncompliance has placed residents at risk of death or serious harm.
Nursing Home Licensed facility providing 24/7 skilled nursing care for residents with complex, ongoing medical needs. Staffed by RNs, LPNs, and CNAs. Inspected and star-rated annually by CMS. Accepts Medicare (short-term rehab) and Medicaid (long-term care).
Nursing Home Licensed facility providing 24/7 skilled nursing care for residents with complex, ongoing medical needs. Staffed by RNs, LPNs, and CNAs. Inspected and star-rated annually by CMS. Accepts Medicare (short-term rehab) and Medicaid (long-term care).
Memory Care Secured, specialized care for people living with Alzheimer's or dementia. Staff trained in cognitive impairment, with higher staff-to-resident ratios and an environment designed to reduce confusion and wandering risk.
Nursing Home Licensed facility providing 24/7 skilled nursing care for residents with complex, ongoing medical needs. Staffed by RNs, LPNs, and CNAs. Inspected and star-rated annually by CMS. Accepts Medicare (short-term rehab) and Medicaid (long-term care).
Home Care Professional care delivered in the person's own home — from companionship and errands to skilled nursing and therapy. Allows seniors to age in place. Medicare covers skilled home health when medically necessary.
Nursing Home Licensed facility providing 24/7 skilled nursing care for residents with complex, ongoing medical needs. Staffed by RNs, LPNs, and CNAs. Inspected and star-rated annually by CMS. Accepts Medicare (short-term rehab) and Medicaid (long-term care).
![]() 7.7 miles from city center
7.7 miles from city center
![]() 7050 S Madison St, Willowbrook, IL 60527
7050 S Madison St, Willowbrook, IL 60527
Add your location
This data corresponds to Q2 2025 and is based on CMS Payroll-Based Journal.
Illinois average ratio: 1.90:1
Illinois average: 7.6 hours
Manages medical care and health needs.
This role is partially covered by contractors.
Assists with medical care and medications.
This role is partially covered by contractors.
Helps with daily care and mobility.
This role is partially covered by contractors.
Total hours from contractors
5,107 contractor hours this quarter
| Certified Nursing Assistant | 85 | 33 | 118 | 21,293 | 91 | 100% | 7.8 |
| Registered Nurse | 22 | 22 | 44 | 7,301 | 91 | 100% | 9.4 |
| Licensed Practical Nurse | 22 | 16 | 38 | 6,129 | 91 | 100% | 7.8 |
| Other Dietary Services Staff | 8 | 0 | 8 | 2,445 | 90 | 99% | 7 |
| Physical Therapy Aide | 0 | 3 | 3 | 900 | 64 | 70% | 7.9 |
| Speech Language Pathologist | 0 | 4 | 4 | 893 | 74 | 81% | 7.1 |
| RN Director of Nursing | 2 | 0 | 2 | 848 | 66 | 73% | 8 |
| Mental Health Service Worker | 1 | 1 | 2 | 510 | 58 | 64% | 8 |
| Dental Services Staff | 1 | 0 | 1 | 505 | 63 | 69% | 8 |
| Nurse Practitioner | 1 | 0 | 1 | 443 | 59 | 65% | 7.5 |
| Administrator | 1 | 0 | 1 | 420 | 56 | 62% | 7.5 |
| Dietitian | 1 | 0 | 1 | 416 | 52 | 57% | 8 |
| Physical Therapy Assistant | 0 | 2 | 2 | 387 | 54 | 59% | 7.2 |
| Qualified Social Worker | 0 | 3 | 3 | 256 | 45 | 49% | 5.7 |
| Respiratory Therapy Technician | 0 | 1 | 1 | 235 | 45 | 49% | 5.2 |
| Occupational Therapy Aide | 0 | 3 | 3 | 179 | 53 | 58% | 2.8 |
| Clinical Nurse Specialist | 0 | 2 | 2 | 100 | 15 | 16% | 6.7 |
| Occupational Therapy Assistant | 0 | 1 | 1 | 28 | 3 | 3% | 9.3 |
| Medical Director | 0 | 1 | 1 | 24 | 6 | 7% | 4 |
Source: CMS Long-Term Care Facility Characteristics (Data as of Jan 2026)
Residents meet regularly to discuss policies, care quality, and activities
Organized group of residents that meets regularly to discuss facility policies, quality of life, and activities.
Data sourced from CMS Long-Term Care Facility Characteristics quarterly report. Payer mix reflects the current resident census by primary payment source.
These measures show how residents usually do over time at this home, based on health outcomes and preventive care.
Illinois average: 9.7
Illinois average: 18.6
Illinois average: 15.5%
Illinois average: 18.4%
Illinois average: 21.6%
Illinois average: 3.4%
Illinois average: 5.3%
Illinois average: 1.8%
Illinois average: 6.5%
Illinois average: 48.1%
Illinois average: 20.2%
Illinois average: 89.2%
Illinois average: 91.6%
Illinois average: 2.05
Illinois average: 2.25
Illinois average: 68.3%
Illinois average: 2.3%
Illinois average: 63.0%
Illinois average: 26.2%
Illinois average: 14.0%
Illinois average: 0.8%
Illinois average: 53.7%
Illinois average: 50.6%
Quality measures are calculated from Minimum Data Set (MDS) assessments. For most measures, lower percentages indicate better care quality.
Federal penalties imposed by CMS for regulatory violations, including civil money penalties (fines) and denials of payment for new Medicare/Medicaid admissions.
Source: CMS Penalties Database (Data as of Jan 2026)
Illinois average: $143K
Illinois average: 3.0
Illinois average: 1.1
Penalties are imposed by CMS for violations of federal nursing home regulations.
Last updated: Jan 2026
Historical financial and operational data for Chateau Nursing and Rehabilitation Center based on CMS SNF Cost Reports.
Loading trend charts...
Care Cost Calculator: See Prices in Your Area
Nursing Home Data Explorer
Don’t Wait Too Long: 7 Red Flag Signs Your Parent Needs Assisted Living Now
The True Cost of Assisted Living in 2025 – And How Families Are Paying For It
Understanding Senior Living Costs: Pricing Models, Discounts & Financial Assistance

Touring a community? Use this expert-backed checklist to stay organized, ask the right questions, and find the perfect fit.
We'll send you a PDF version of the touring checklist.